
$419,900
Investment Summary
- Monthly Cash Flow
- -$767
- Cap Rate
- 4.1%
- Cash-on-Cash Return
- -9.5%
- Debt Coverage Ratio
- 0.65
- Internal Rate of Return (5 years)
- -5.2%
Cash Flow
Net Operating Income (NOI) minus mortgage payments.
Calculation:
NOI - Mortgage Payments
Cap Rate (Market Value)
Capitalization Rate is a rate of return that compares the yearly Net Operating Income (NOI) to the market value.
Calculation:
NOI / Market Value
Cash-on-Cash Return (CoC)
Annual Cash Flow / Cash Invested
Calculation:
Annual cash flow divided by initial cash invested.
Debt Coverage Ratio (DCR)
Net Operating Income (NOI) divided by total debt payments.
Calculation:
NOI / Total Debt Payments
Internal Rate of Return (IRR)
A metric for assessing profitability over time. IRR is the discount rate at which the net present value (NPV) of all future cash flows (positive and negative) from an investment equals zero — including both periodic cash flow (such as rent) and a projected sale at the end of the holding period. It represents the expected annualized return, accounting for income, expenses, and the recovery of capital through a future sale.
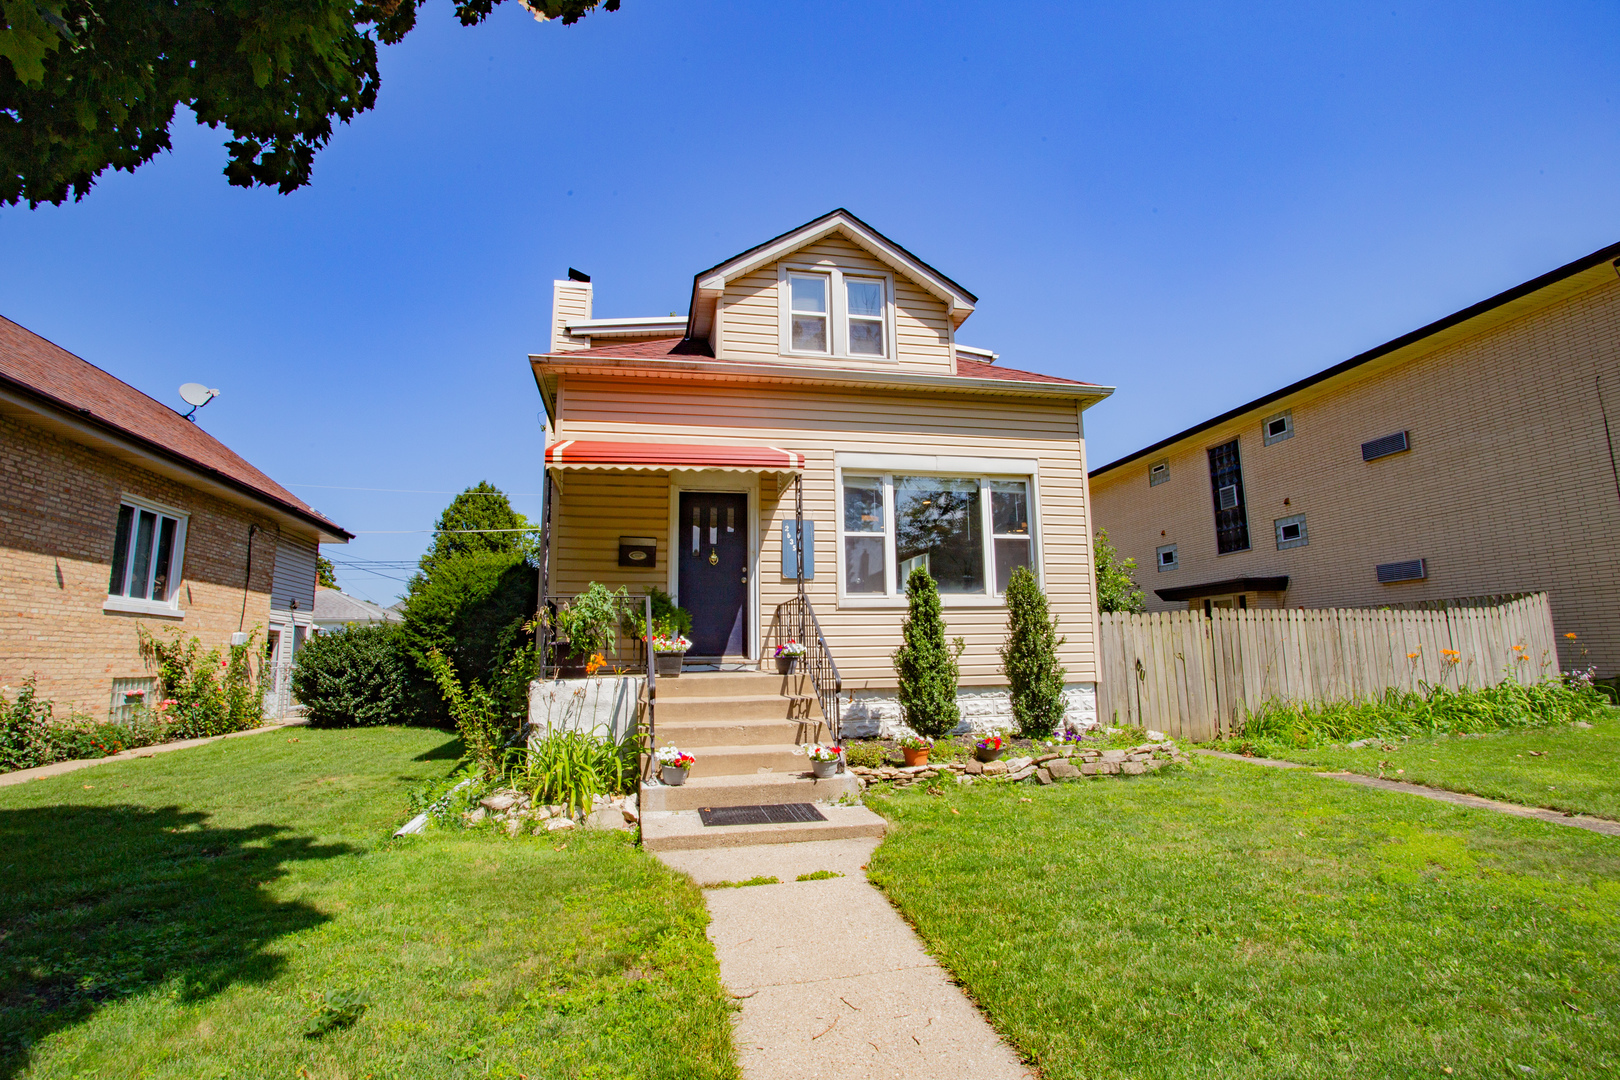
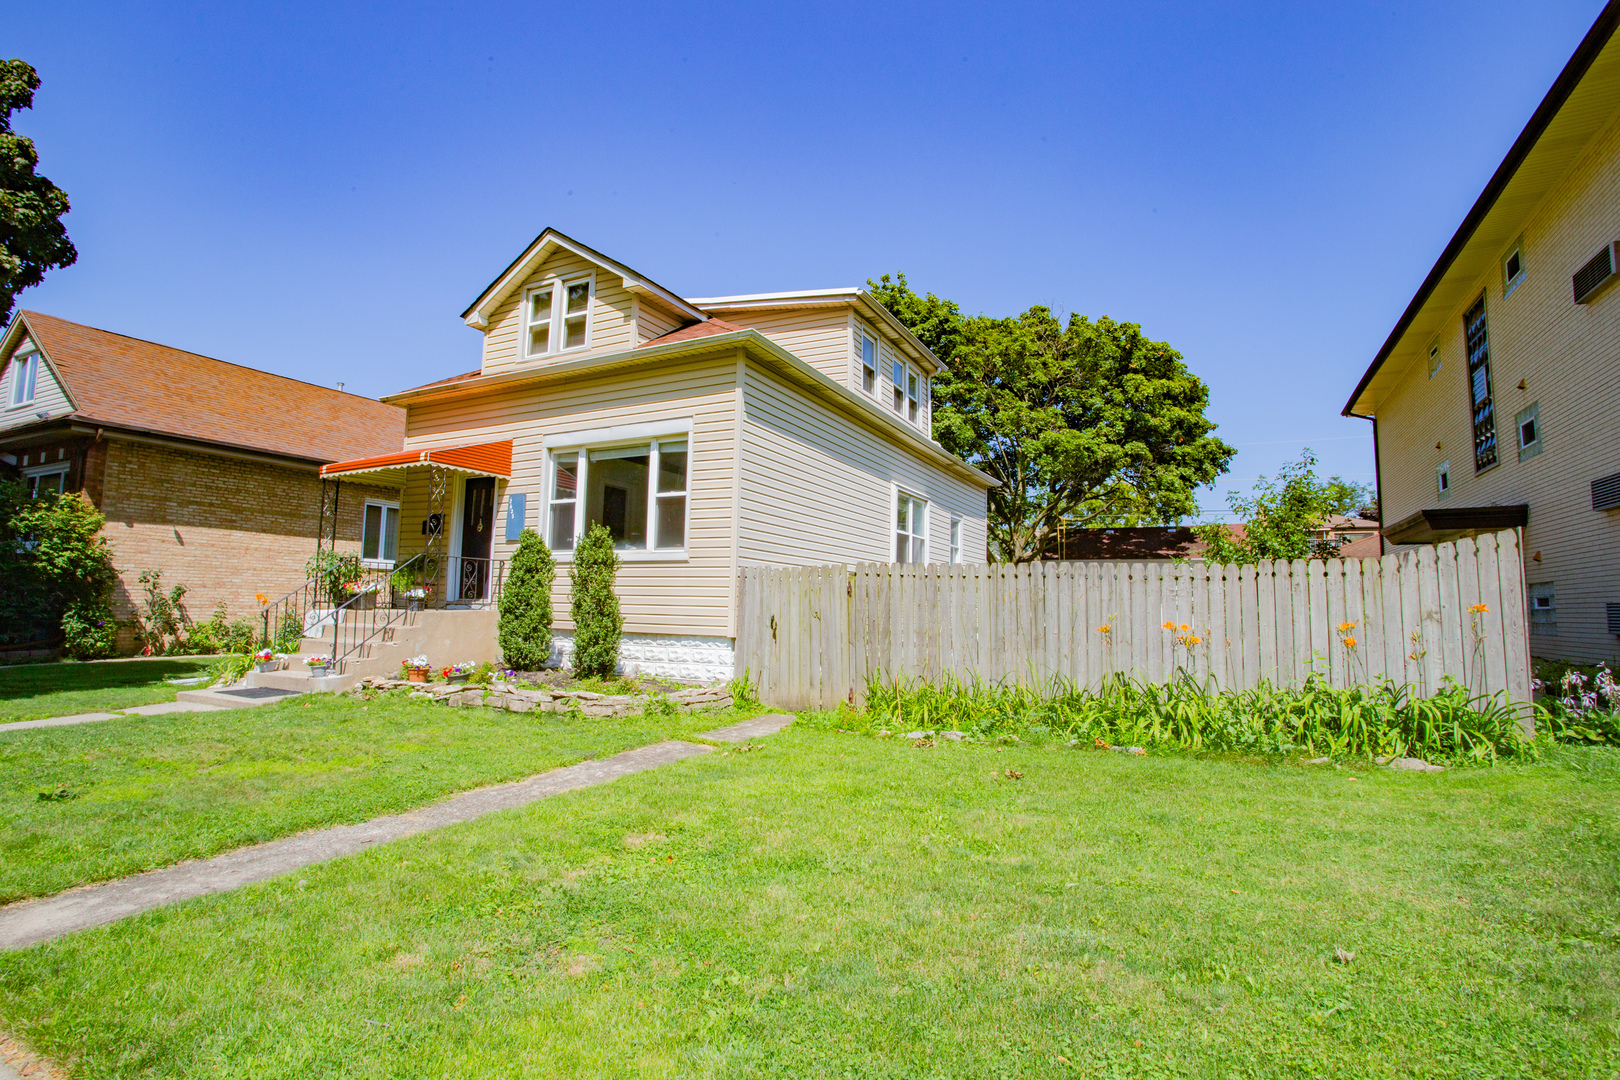
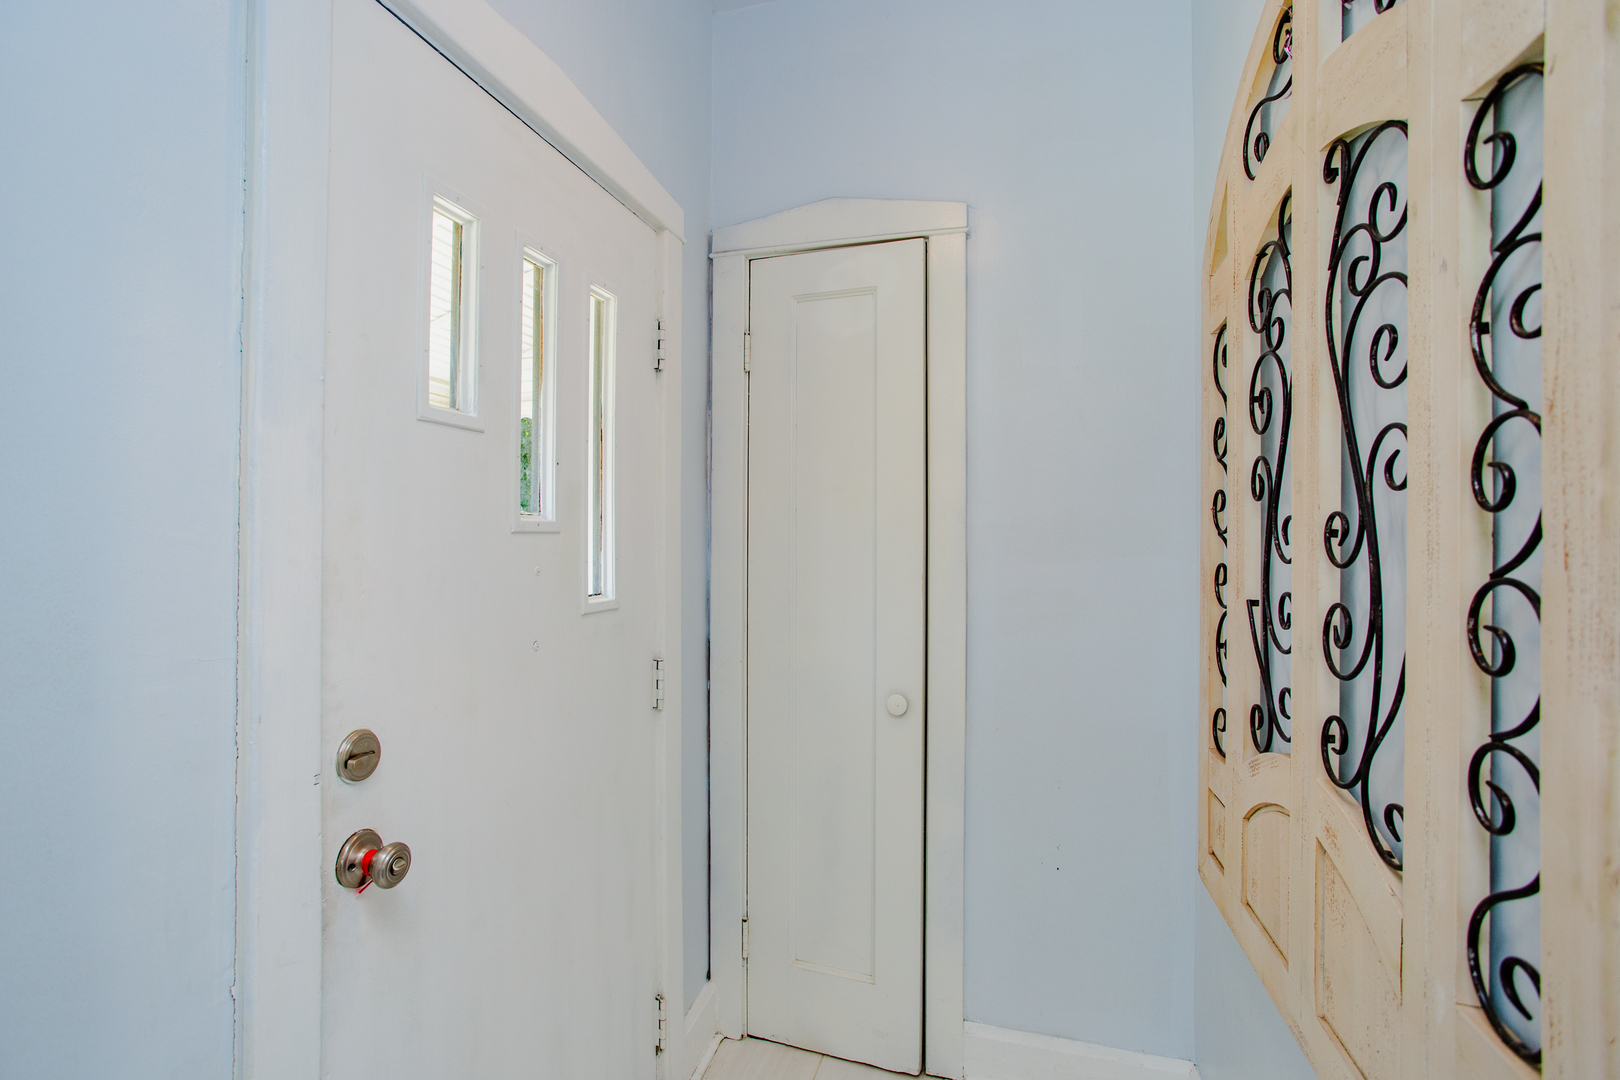
Property Description
RARE OPPORTUNITY TO OWN A BEAUTIFUL REMODELED HOUSE IN ELMWOOD PARK ON DOUBLE LOT 50 x 125 (6,250 Sq Ft)!!! This does not happen too often for a "double lot" house to be offered for sale!!! The sellers completed tons of updates since they purchased the house. Updates include newer roof, newer windows, updated electrical and plumbing, updated exterior, deck and landscaping. New furnace 2023, AC 2020. The main floor has been totally rehabbed. When you enter the front door to the foyer, a remodeled open style living room and dining room invites you with hardwood floors, crown moldings, modern style fan. There is a bedroom on the first floor for your convenience. Totally rehabbed kitchen with top of the line finishes, custom white new cabinets with custom drawers and cabinets, Professional Hallman Nostalgie Series stove from Italy with 5 burners in modern blue color, sink/pot filler over the stove for your easier cooking, modern style backsplash, custom kitchen island in blue color matching Hallman stove, quartz counter tops, stainless steel appliances, in-drawer Sharp microwave, Samsung dishwasher and refrigerator. Kitchen opens to a family room or eating area, completely rehabbed main level bathroom with brand new plumbing, top of the line features including soaking tub, Luxury Woodbridge Bidet Toilet (Elongated One Piece Toilet with Advanced Bidet Seat/Smart Toilet Seat), Exhaust bathroom light with Wifi and Bluetooth. Second floor has 3 Bedrooms and a Family Room/Play Room, brand new carpeting, fresh paint. Basement is part finished with most of the drywall new, installed can lighting in the ceiling. It consists of a recreation room, bedroom, a den and a bath with shower. Beautiful large back and side yard with a deck, large patio for your enjoinment, barbequing and relaxing under a tree. Large 2 car garage and large concrete parking slab to fit 2 cars or a boat. Lots of space on the side yard for a pool installation for the entire family enjoyment. Great location!! Elmwood Park is one of the most desirable suburbs with city amenities. Convenient location close to the Elmwood Park Metra station, Close to the Elementary Public school, steps from downtown, recreation center with pool, library, shopping and restaurants. There is no home owner's exemption on RE Taxes, so the taxes will be lower with the home owner's exemption. The house is in good condition, however, the sellers would like to sell it AS IS. The village inspection was already completed. Additional items can be included, if the buyers want it: 3 TV sets (Living/Dining Room, Bedroom and Family Room), living room glass coffee table, white leather sofa, 1st floor Bedroom dresser, second floor bedroom bed, small cabinet/table in the living room, 3 bar stools in the kitchen. WELCOME TO YOUR DREAM HOME WITH A SUPER LARGE SIZE BACK AND SIDE YARD!!!
Build Your Team
Quickly find investor-friendly professionals who can help you succeed in real estate investing at any stage of the investing journey.


Agents
Match with investor-friendly agents who can help you find, analyze, and close your next deal


Lenders
Get the best funding…find investor-friendly lenders who specialize in your deal strategy


Property Managers
Transition to passive investing. Find a trusted property management partnership that lasts.


Tax Pros & Accountants
Taxes and financial reporting made easy—find experts to create tax savings strategies, file taxes, and more
Location
Property Details
Parking
- Description: Driveway
- Details: Concrete, On Site, Detached, Driveway, Garage
- Garage Spaces: 2
- Spaces Total: 4
Bedroom Information
- # of Bedrooms: 4
Bathroom Information
- # of Baths (Full): 3
- # of Baths (Total): 3.0
Interior Features
- # of Rooms: 11
- # of Stories: 2
- Attic: Yes
- Basement: Yes
- Basement Description: Partially Finished, Walk-Out Access
Exterior Features
- Exterior Walls Materials: Wood
Land Information
- Land Use: Residential
- Land Use Subtype: Single Family Residential
Lot Information
- Parcel ID: 1225414039
- Lot Size: 0 sqft
Property Information
- Property Type: Single Family Residence
- Year Built: 1922
Tax Information
- Annual Tax: $9,396
Utilities
- Heating: Forced Air
- Cooling: Central Air
Location
- County: Cook
Listing Details
Investment Summary
- Monthly Cash Flow
- -$767
- Cap Rate
- 4.1%
- Cash-on-Cash Return
- -9.5%
- Debt Coverage Ratio
- 0.65
- Internal Rate of Return (5 years)
- -5.2%
Cash Flow
Net Operating Income (NOI) minus mortgage payments.
Calculation:
NOI - Mortgage Payments
Cap Rate (Market Value)
Capitalization Rate is a rate of return that compares the yearly Net Operating Income (NOI) to the market value.
Calculation:
NOI / Market Value
Cash-on-Cash Return (CoC)
Annual Cash Flow / Cash Invested
Calculation:
Annual cash flow divided by initial cash invested.
Debt Coverage Ratio (DCR)
Net Operating Income (NOI) divided by total debt payments.
Calculation:
NOI / Total Debt Payments
Internal Rate of Return (IRR)
A metric for assessing profitability over time. IRR is the discount rate at which the net present value (NPV) of all future cash flows (positive and negative) from an investment equals zero — including both periodic cash flow (such as rent) and a projected sale at the end of the holding period. It represents the expected annualized return, accounting for income, expenses, and the recovery of capital through a future sale.
Purchase Details
Purchase PriceThe price paid for the property. Purchase price:
| $419,900 |
|---|---|
Amount FinancedThe amount of the purchase financed through a loan. Amount financed:
| -$335,920 |
Down paymentThe initial payment made towards the purchase. Down payment:
| $83,980 |
Closing CostsFees and expenses associated with purchasing a property, typically ranging from 2% to 5% of the home’s purchase price, paid at the end of a home purchase to cover services like lending, title transfer, and taxes. Closing costs:
| $12,597 |
Rehab CostsCosts incurred to repair or improve the property, including: roof, flooring, exterior siding, kitchen, exterior paint, bathrooms, etc. Rehab costs:
| $0 |
Initial Cash InvestedThe total initial cash invested in the property. Calculation:Down payment + Buying costs + Rehab costs Initial cash invested:
| $96,577 |
Square Feet (SQFT)The total square footage of the property. Square feet:
| 1,596 |
Cost Per Square FootCost per square foot of the property. Calculation:Purchase Price / Square Feet Cost per square foot:
| $263 |
Monthly Rent Per Square FootMonthly rent divided by the number of square feet. This ratio helps investors compare rental income efficiency across properties, markets, and unit sizes Calculation:Monthly Rent / Square Feet Monthly rent per square foot:
| $2.01 |
Financing Details
Loan AmountThe total sum of money borrowed from a lender to finance a property purchase. Calculation:Purchase Price - Down Payment
Loan amount:
| $335,920 |
|---|---|
Loan to Value Ratio (LTV)Loan amount divided by the market value of the property. Calculation:Loan Amount / Market Value
Loan to value ratio:
| 80.0% |
Loan TypeThe type of loan (e.g., fixed, adjustable).
Loan type:
| Amortizing |
TermThe loan repayment period in years.
Term:
| 30 years |
Interest RateThe percentage a lender charges on the borrowed amount of a loan, determining the cost of borrowing money.
Interest rate:
| 6.810% |
Principal & Interest (PI)The principal is the portion of the loan payment that reduces the loan balance. The interest is the lender's charge for borrowing money. Calculation:(P * r * (1 + r) ** n) / ((1 + r) ** n - 1) Where:
P = Loan amount (principal)
Principal & interest:
| $2,192 |
Property TaxesAnnual taxes levied by local governments on real estate properties. These taxes fund public services like schools, roads, and emergency services.
Property tax:
| $783 |
InsuranceThe costs for insurance coverage to protect against financial losses due to risks like fire, natural disasters, theft, liability, or tenant-related damages. Calculation:Assumes 7% of gross rental income, unless insurance rates are specified.
Insurance:
| $224 |
Private Mortgage Insurance (PMI)A fee that borrowers pay when they take out a conventional loan with a loan-to-value (LTV) ratio above 80%.
Private mortgage insurance (PMI):
| $0 |
Monthly PaymentThe fixed amount a borrower pays each month to repay a loan. It typically includes principal and interest (P&I) and may also cover property taxes, insurance, HOA fees, and PMI if escrowed. Monthly payment:
| $3,199 |
Operating Income
| % Rent | Monthly | Yearly | |
|---|---|---|---|
Gross RentThe total rental income received from tenants before deducting any expenses. Includes base rent, late fees, pet fees, parking fees, and other recurring charges.
Gross rent:
| $3,200 | $38,400 | |
Vacancy LossExpected loss of rent due to vacancies.
Vacancy loss:
(6%)
| 6% | -$192 | -$2,304 |
Operating IncomeGross rental income minus vacancy loss. Calculation:Gross rent - Vacancy loss
Operating income:
| $3,008 | $36,096 |
Operating Expenses
| % Rent | Monthly | Yearly | |
|---|---|---|---|
Property TaxesAnnual taxes levied by local governments on real estate properties. These taxes fund public services like schools, roads, and emergency services. | 24% | -$783 | -$9,397 |
InsuranceThe costs for insurance coverage to protect against financial losses due to risks like fire, natural disasters, theft, liability, or tenant-related damages. Calculation:Assumes 7% of gross rental income, unless insurance rates are specified. | 7% | -$224 | -$2,688 |
Property ManagementThe costs associated with hiring a property manager to handle the day-to-day operations of a rental property. Includes management fees, leasing fes, eviction fees, etc. Calculation:Assumes 8% of gross rental income. | 8% | -$256 | -$3,072 |
Repairs & MaintenanceOngoing costs for routine upkeep and minor fixes needed to keep a property in good working condition. Calculation:Assumes 5% of gross rental income. Varies by property age and condition. | 5% | -$160 | -$1,920 |
Capital ExpensesLarge, infrequent costs for major improvements or replacements, like a new roof, HVAC system, or appliances. Calculation:Assumes 5% of gross rental income. Varies by property age. | 5% | -$160 | -$1,920 |
HOA FeesRegular dues paid to a Homeowners Association for community maintenance, amenities, and management. Similar fees include: Condo Association Fees, Co-op Maintenance Fees, etc. | n/a | n/a | n/a |
Operating ExpensesRecurring costs required to maintain and manage a rental property, including property taxes, insurance, maintenance, repairs, utilities (if paid by the owner), property management fees, and other day-to-day expenses. Calculation:Insurance + Property Taxes + Property Management + Repairs & Maintenance + Capital Expenditures + HOA Fees | 49% | -$1,583 | -$18,997 |
Cash Flow
| Monthly | Yearly | |
|---|---|---|
Net Operating Income (NOI)The income generated from a property after deducting all operating expenses but before deducting mortgage payments, taxes, and capital expenditures. Calculation:Gross Operating Income - Operating Expenses
Net operating income:
| $1,425 | $17,100 |
Mortgage PaymentThe fixed amount a borrower pays each month to repay a loan. It typically includes principal and interest (P&I) and may also cover property taxes, insurance, HOA fees, and PMI if escrowed. | -$2,192 | -$26,304 |
Cash FlowNet Operating Income (NOI) minus mortgage payments. Calculation:NOI - Mortgage Payments | $767 | $9,204 |