$2,349,900
Investment Summary
- Monthly Cash Flow
- -$10,124
- Cap Rate
- 1.0%
- Cash-on-Cash Return
- -22.5%
- Debt Coverage Ratio
- 0.16
- Internal Rate of Return (5 years)
- -17.7%
Cash Flow
Net Operating Income (NOI) minus mortgage payments.
Calculation:
NOI - Mortgage Payments
Cap Rate (Market Value)
Capitalization Rate is a rate of return that compares the yearly Net Operating Income (NOI) to the market value.
Calculation:
NOI / Market Value
Cash-on-Cash Return (CoC)
Annual Cash Flow / Cash Invested
Calculation:
Annual cash flow divided by initial cash invested.
Debt Coverage Ratio (DCR)
Net Operating Income (NOI) divided by total debt payments.
Calculation:
NOI / Total Debt Payments
Internal Rate of Return (IRR)
A metric for assessing profitability over time. IRR is the discount rate at which the net present value (NPV) of all future cash flows (positive and negative) from an investment equals zero — including both periodic cash flow (such as rent) and a projected sale at the end of the holding period. It represents the expected annualized return, accounting for income, expenses, and the recovery of capital through a future sale.
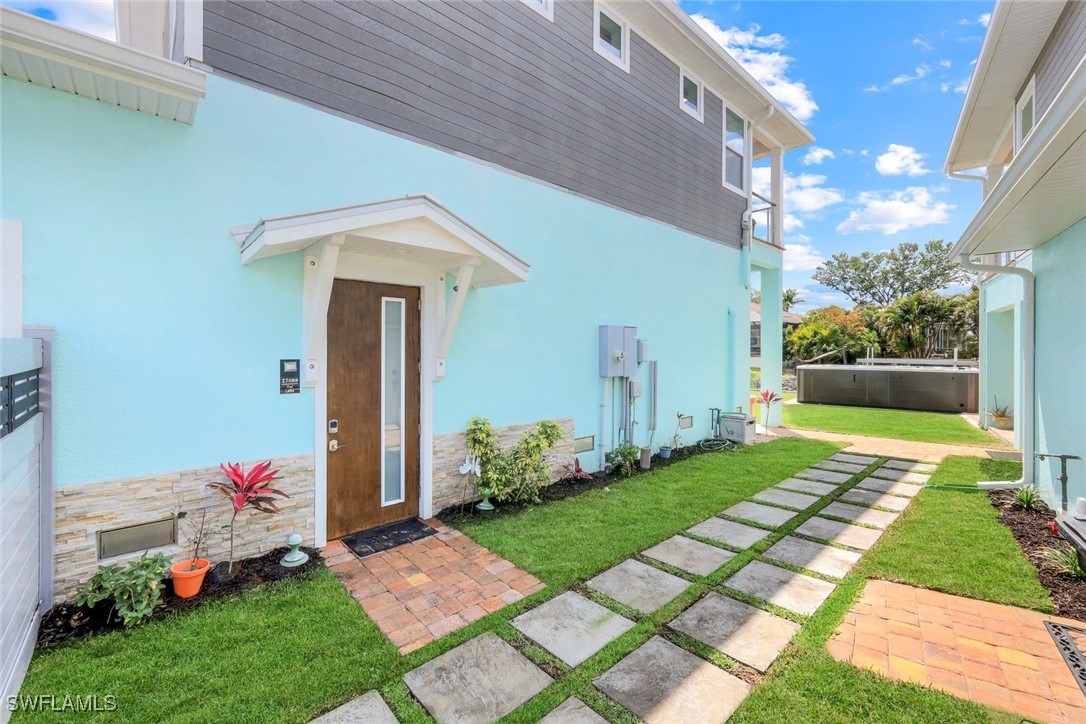
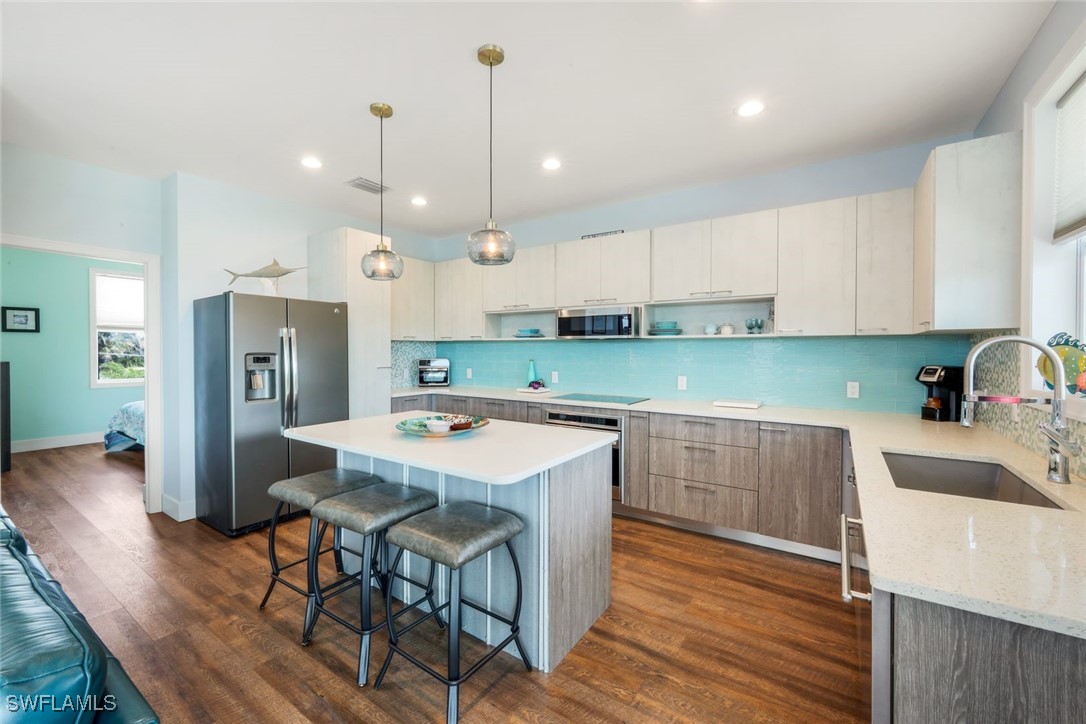
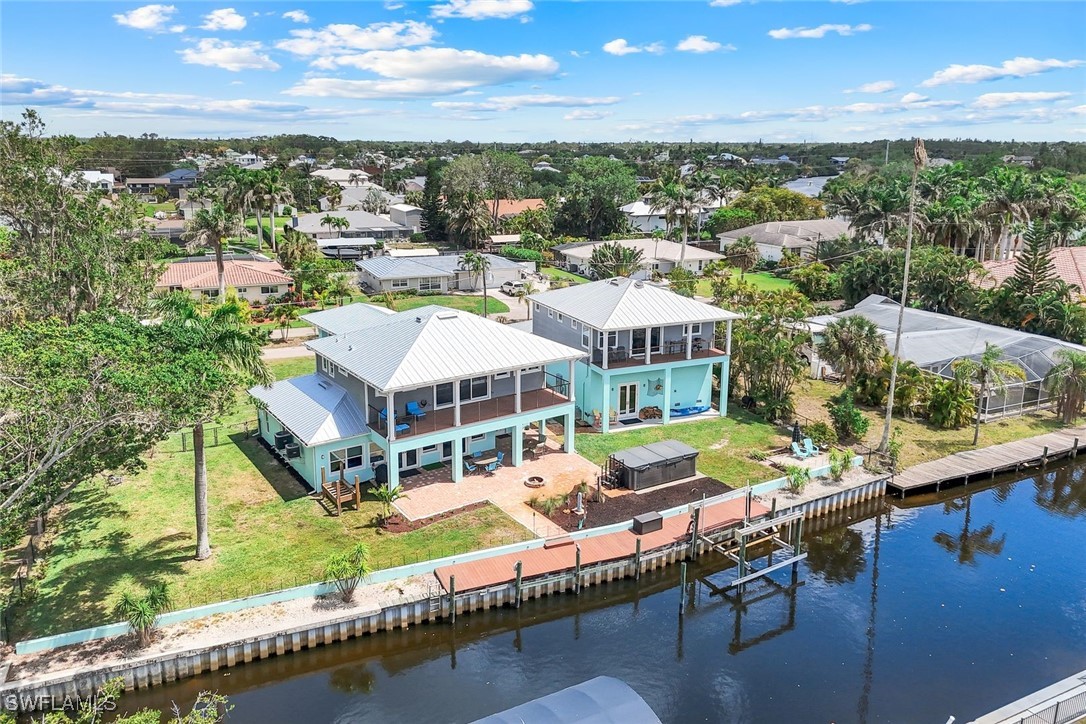
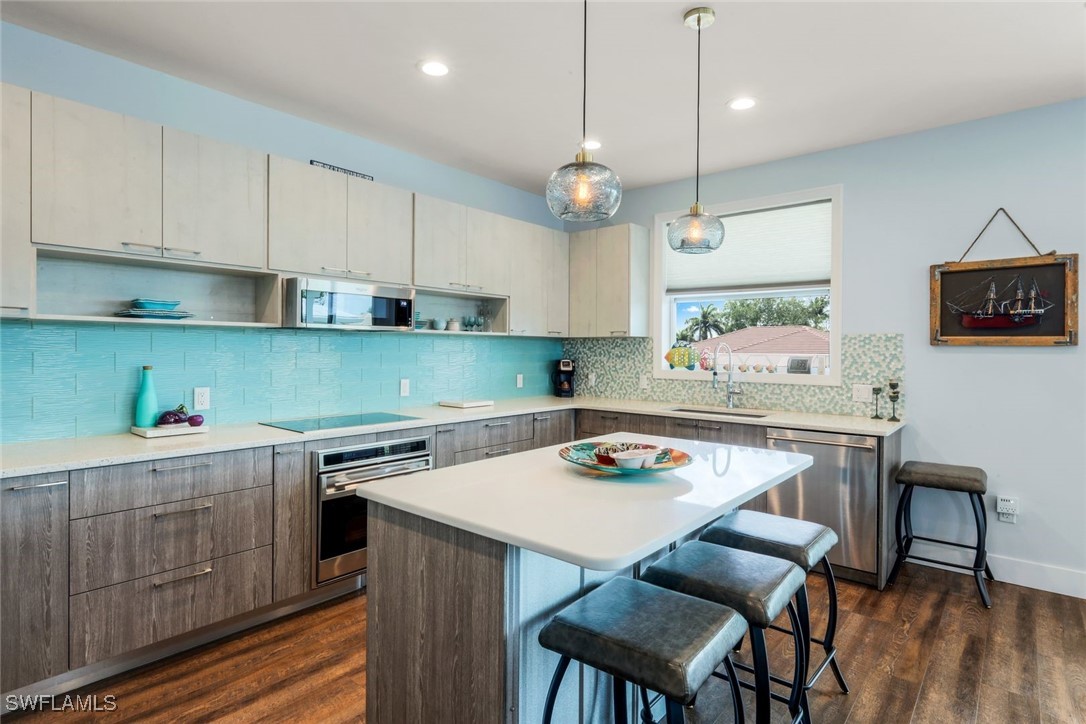
Property Description
This Gulf-Access Compound is a Once in a Lifetime Dream Come True | Located on one of the largest gulf-access lots in the area, this unique property (combines for over 4,100 sq ft of living area) offers something for everyone. If your criteria is: over half an acre of land, no HOA, concrete block construction, and 3,000+ sq ft of living area, this is the lowest priced property within 13 radial miles. This premier waterfront property expertly combines modern luxury with functionality, ideal for both leisure and adventure. The property is in a private neighborhood, on a private street, and offers the peace and quiet you desire while also being within 15 minutes of public beaches and lots of entertainment. The 3,100+ sq ft home welcomes you with a stunning two-story foyer and a temperature controlled wine tower display. There is plenty of room to create memorable moments with a family room that opens up to over 450 sq ft of outdoor patio space. All this is adjacent to the gourmet kitchen with quartz countertops, euro style cabinets, upgraded stainless steel appliances, and 39' Ruvati kitchen sink workstation. The home features two laundry rooms, one on each level. A flexible office/flex room on the main floor doubles as a fourth bedroom, perfect for remote work. Two guest bedrooms share a bathroom and there is also a full spa/pool bath. The second floor is the primary suite and it is a true retreat; complete with an electric fireplace, a large walk-in closet with laundry facilities, and a luxurious bathroom that includes a smart bidet toilet, dual sinks, multi-head shower, and Ionic foot bath station. The balcony offers serene views of the sunset. Outdoors, the 8x16 swim spa, adjacent to the fire-pit and dock, caters to both adult relaxation and kids’ pool play. It features water effects, lighting, and a Bluetooth sound system. Boating enthusiasts will appreciate the 150' of seawall and canal frontage, a 14,000 lb boat lift, and 60' of dock space (with power) providing easy access to the Gulf. You will see dolphins, rabbits, osprey, manatees, otters, and other wildlife! The property includes a massive 30x50 air-conditioned garage that accommodates a Class B or C motorhome and includes a 220V outlet. Above the garage, a 1,000+ sq. ft. studio offers additional living space with a bedroom and a bath, a large kitchen, a laundry area, and a balcony overlooking the canal; perfect for guests or potential rental income. Notably, both structures meet Florida's stringent building codes, featuring impact-rated windows and doors. For the Survivalist amongst us, the property also boasts a rainwater harvesting system, a 1,300 gal cistern (three stage filtration) for excellent drinking water, an emergency generator that ensures continuous power to the garage and studio, and some pre-planning and conduit are in place for future solar panels. This home is truly a versatile masterpiece; blending comfort, luxury, and practicality for every family member and visitor.
Build Your Team
Quickly find investor-friendly professionals who can help you succeed in real estate investing at any stage of the investing journey.


Agents
Match with investor-friendly agents who can help you find, analyze, and close your next deal


Lenders
Get the best funding…find investor-friendly lenders who specialize in your deal strategy


Property Managers
Transition to passive investing. Find a trusted property management partnership that lasts.


Tax Pros & Accountants
Taxes and financial reporting made easy—find experts to create tax savings strategies, file taxes, and more
Location
Property Details
Parking
- Description: Garage
- Details: Detached, Garage, Garage Door Opener
- Garage Spaces: 4
- Spaces Total: 0
Bedroom Information
- # of Bedrooms: 4
Bathroom Information
- # of Baths (Full): 3
- # of Baths (Total): 3.0
Interior Features
- # of Stories: 2
- Fireplace: Yes
Exterior Features
- Exterior Walls Materials: Stucco
- Roof Type: Gable
- Roof Material: Metal
Land Information
- Land Use: Residential
- Land Use Subtype: Single Family Residential
Lot Information
- Parcel ID: 344725B100111.0030
- Lot Size: 0 sqft
Property Information
- Property Type: Single Family Residence
- Style: Contemporary, Multi Level, Two Story, See Remarks
- Year Built: 2024
Tax Information
- Annual Tax: $6,849
Utilities
- Water & Sewer: Public
- Heating: Central, Electric, Zoned
- Cooling: Central Air, Ceiling Fan(s), Electric, Zoned
Location
- County: Lee
Listing Details
Investment Summary
- Monthly Cash Flow
- -$10,124
- Cap Rate
- 1.0%
- Cash-on-Cash Return
- -22.5%
- Debt Coverage Ratio
- 0.16
- Internal Rate of Return (5 years)
- -17.7%
Cash Flow
Net Operating Income (NOI) minus mortgage payments.
Calculation:
NOI - Mortgage Payments
Cap Rate (Market Value)
Capitalization Rate is a rate of return that compares the yearly Net Operating Income (NOI) to the market value.
Calculation:
NOI / Market Value
Cash-on-Cash Return (CoC)
Annual Cash Flow / Cash Invested
Calculation:
Annual cash flow divided by initial cash invested.
Debt Coverage Ratio (DCR)
Net Operating Income (NOI) divided by total debt payments.
Calculation:
NOI / Total Debt Payments
Internal Rate of Return (IRR)
A metric for assessing profitability over time. IRR is the discount rate at which the net present value (NPV) of all future cash flows (positive and negative) from an investment equals zero — including both periodic cash flow (such as rent) and a projected sale at the end of the holding period. It represents the expected annualized return, accounting for income, expenses, and the recovery of capital through a future sale.
Purchase Details
Purchase PriceThe price paid for the property. Purchase price:
| $2,349,900 |
|---|---|
Amount FinancedThe amount of the purchase financed through a loan. Amount financed:
| -$1,879,920 |
Down paymentThe initial payment made towards the purchase. Down payment:
| $469,980 |
Closing CostsFees and expenses associated with purchasing a property, typically ranging from 2% to 5% of the home’s purchase price, paid at the end of a home purchase to cover services like lending, title transfer, and taxes. Closing costs:
| $70,497 |
Rehab CostsCosts incurred to repair or improve the property, including: roof, flooring, exterior siding, kitchen, exterior paint, bathrooms, etc. Rehab costs:
| $0 |
Initial Cash InvestedThe total initial cash invested in the property. Calculation:Down payment + Buying costs + Rehab costs Initial cash invested:
| $540,477 |
Square Feet (SQFT)The total square footage of the property. Square feet:
| 3,112 |
Cost Per Square FootCost per square foot of the property. Calculation:Purchase Price / Square Feet Cost per square foot:
| $755 |
Monthly Rent Per Square FootMonthly rent divided by the number of square feet. This ratio helps investors compare rental income efficiency across properties, markets, and unit sizes Calculation:Monthly Rent / Square Feet Monthly rent per square foot:
| $1.16 |
Financing Details
Loan AmountThe total sum of money borrowed from a lender to finance a property purchase. Calculation:Purchase Price - Down Payment
Loan amount:
| $1,879,920 |
|---|---|
Loan to Value Ratio (LTV)Loan amount divided by the market value of the property. Calculation:Loan Amount / Market Value
Loan to value ratio:
| 80.0% |
Loan TypeThe type of loan (e.g., fixed, adjustable).
Loan type:
| Amortizing |
TermThe loan repayment period in years.
Term:
| 30 years |
Interest RateThe percentage a lender charges on the borrowed amount of a loan, determining the cost of borrowing money.
Interest rate:
| 6.625% |
Principal & Interest (PI)The principal is the portion of the loan payment that reduces the loan balance. The interest is the lender's charge for borrowing money. Calculation:(P * r * (1 + r) ** n) / ((1 + r) ** n - 1) Where:
P = Loan amount (principal)
Principal & interest:
| $12,037 |
Property TaxesAnnual taxes levied by local governments on real estate properties. These taxes fund public services like schools, roads, and emergency services.
Property tax:
| $571 |
InsuranceThe costs for insurance coverage to protect against financial losses due to risks like fire, natural disasters, theft, liability, or tenant-related damages. Calculation:Assumes 7% of gross rental income, unless insurance rates are specified.
Insurance:
| $252 |
Private Mortgage Insurance (PMI)A fee that borrowers pay when they take out a conventional loan with a loan-to-value (LTV) ratio above 80%.
Private mortgage insurance (PMI):
| $0 |
Monthly PaymentThe fixed amount a borrower pays each month to repay a loan. It typically includes principal and interest (P&I) and may also cover property taxes, insurance, HOA fees, and PMI if escrowed. Monthly payment:
| $12,860 |
Operating Income
| % Rent | Monthly | Yearly | |
|---|---|---|---|
Gross RentThe total rental income received from tenants before deducting any expenses. Includes base rent, late fees, pet fees, parking fees, and other recurring charges.
Gross rent:
| $3,600 | $43,200 | |
Vacancy LossExpected loss of rent due to vacancies.
Vacancy loss:
(6%)
| 6% | -$216 | -$2,592 |
Operating IncomeGross rental income minus vacancy loss. Calculation:Gross rent - Vacancy loss
Operating income:
| $3,384 | $40,608 |
Operating Expenses
| % Rent | Monthly | Yearly | |
|---|---|---|---|
Property TaxesAnnual taxes levied by local governments on real estate properties. These taxes fund public services like schools, roads, and emergency services. | 16% | -$571 | -$6,849 |
InsuranceThe costs for insurance coverage to protect against financial losses due to risks like fire, natural disasters, theft, liability, or tenant-related damages. Calculation:Assumes 7% of gross rental income, unless insurance rates are specified. | 7% | -$252 | -$3,024 |
Property ManagementThe costs associated with hiring a property manager to handle the day-to-day operations of a rental property. Includes management fees, leasing fes, eviction fees, etc. Calculation:Assumes 8% of gross rental income. | 8% | -$288 | -$3,456 |
Repairs & MaintenanceOngoing costs for routine upkeep and minor fixes needed to keep a property in good working condition. Calculation:Assumes 5% of gross rental income. Varies by property age and condition. | 5% | -$180 | -$2,160 |
Capital ExpensesLarge, infrequent costs for major improvements or replacements, like a new roof, HVAC system, or appliances. Calculation:Assumes 5% of gross rental income. Varies by property age. | 5% | -$180 | -$2,160 |
HOA FeesRegular dues paid to a Homeowners Association for community maintenance, amenities, and management. Similar fees include: Condo Association Fees, Co-op Maintenance Fees, etc. | n/a | n/a | n/a |
Operating ExpensesRecurring costs required to maintain and manage a rental property, including property taxes, insurance, maintenance, repairs, utilities (if paid by the owner), property management fees, and other day-to-day expenses. Calculation:Insurance + Property Taxes + Property Management + Repairs & Maintenance + Capital Expenditures + HOA Fees | 41% | -$1,471 | -$17,649 |
Cash Flow
| Monthly | Yearly | |
|---|---|---|
Net Operating Income (NOI)The income generated from a property after deducting all operating expenses but before deducting mortgage payments, taxes, and capital expenditures. Calculation:Gross Operating Income - Operating Expenses
Net operating income:
| $1,913 | $22,956 |
Mortgage PaymentThe fixed amount a borrower pays each month to repay a loan. It typically includes principal and interest (P&I) and may also cover property taxes, insurance, HOA fees, and PMI if escrowed. | -$12,037 | -$144,444 |
Cash FlowNet Operating Income (NOI) minus mortgage payments. Calculation:NOI - Mortgage Payments | $10,124 | $121,488 |