$1,999,000
Investment Summary
- Monthly Cash Flow
- -$5,519
- Cap Rate
- 3.0%
- Cash-on-Cash Return
- -14.4%
- Debt Coverage Ratio
- 0.47
- Internal Rate of Return (5 years)
- -9.9%
Cash Flow
Net Operating Income (NOI) minus mortgage payments.
Calculation:
NOI - Mortgage Payments
Cap Rate (Market Value)
Capitalization Rate is a rate of return that compares the yearly Net Operating Income (NOI) to the market value.
Calculation:
NOI / Market Value
Cash-on-Cash Return (CoC)
Annual Cash Flow / Cash Invested
Calculation:
Annual cash flow divided by initial cash invested.
Debt Coverage Ratio (DCR)
Net Operating Income (NOI) divided by total debt payments.
Calculation:
NOI / Total Debt Payments
Internal Rate of Return (IRR)
A metric for assessing profitability over time. IRR is the discount rate at which the net present value (NPV) of all future cash flows (positive and negative) from an investment equals zero — including both periodic cash flow (such as rent) and a projected sale at the end of the holding period. It represents the expected annualized return, accounting for income, expenses, and the recovery of capital through a future sale.
Property Description
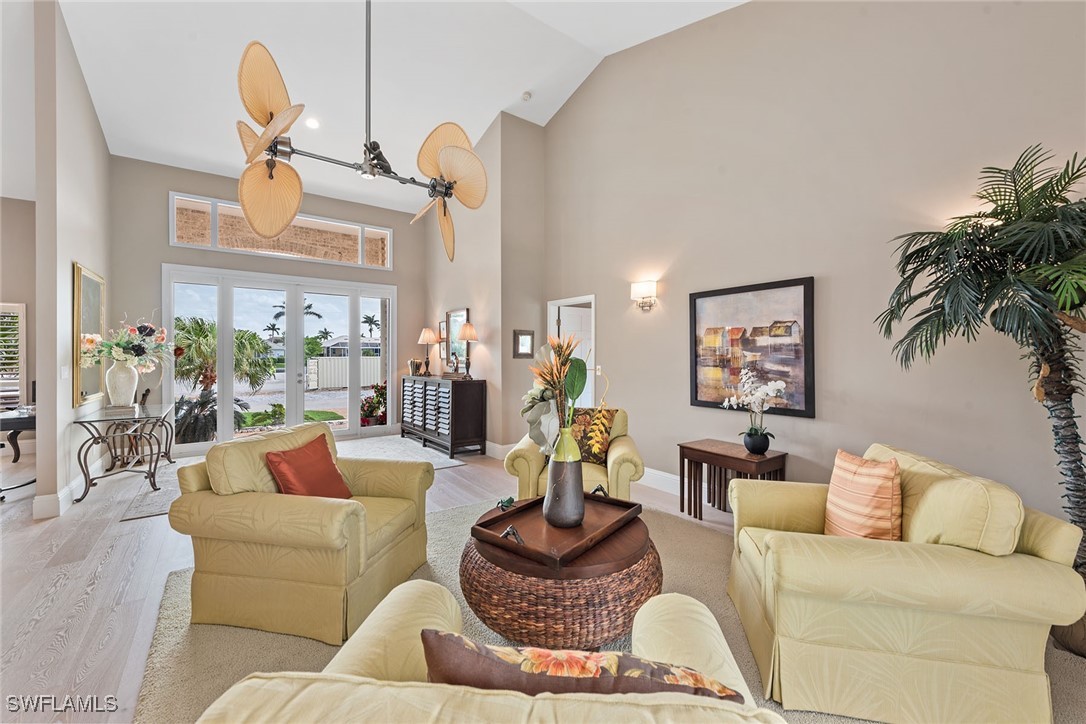
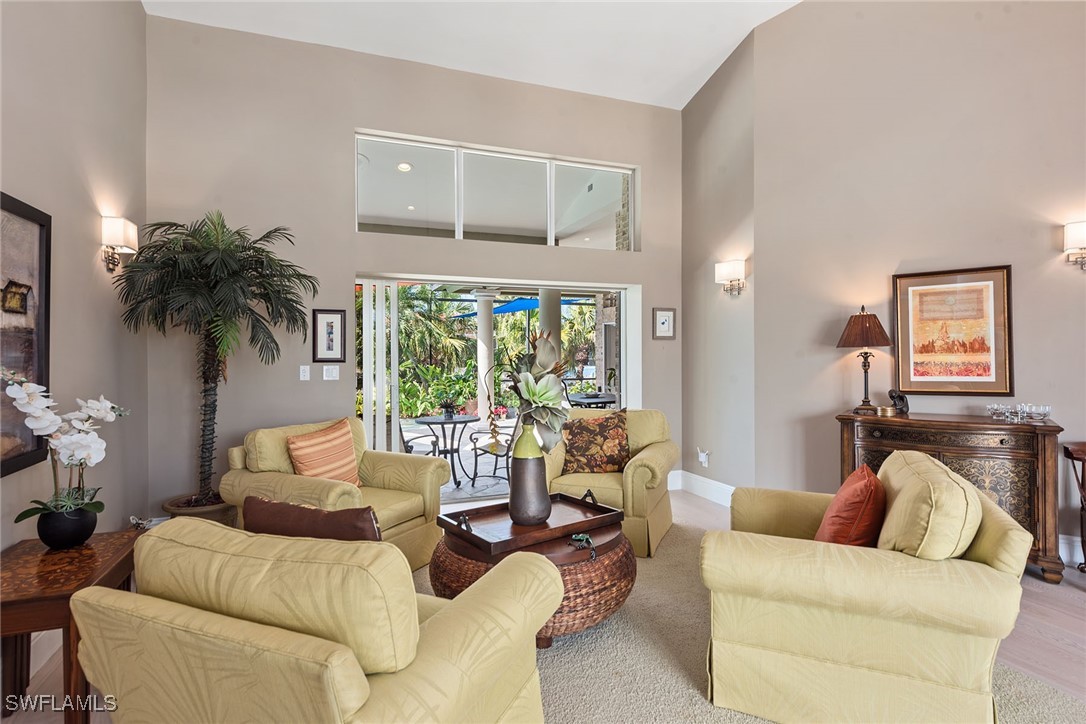
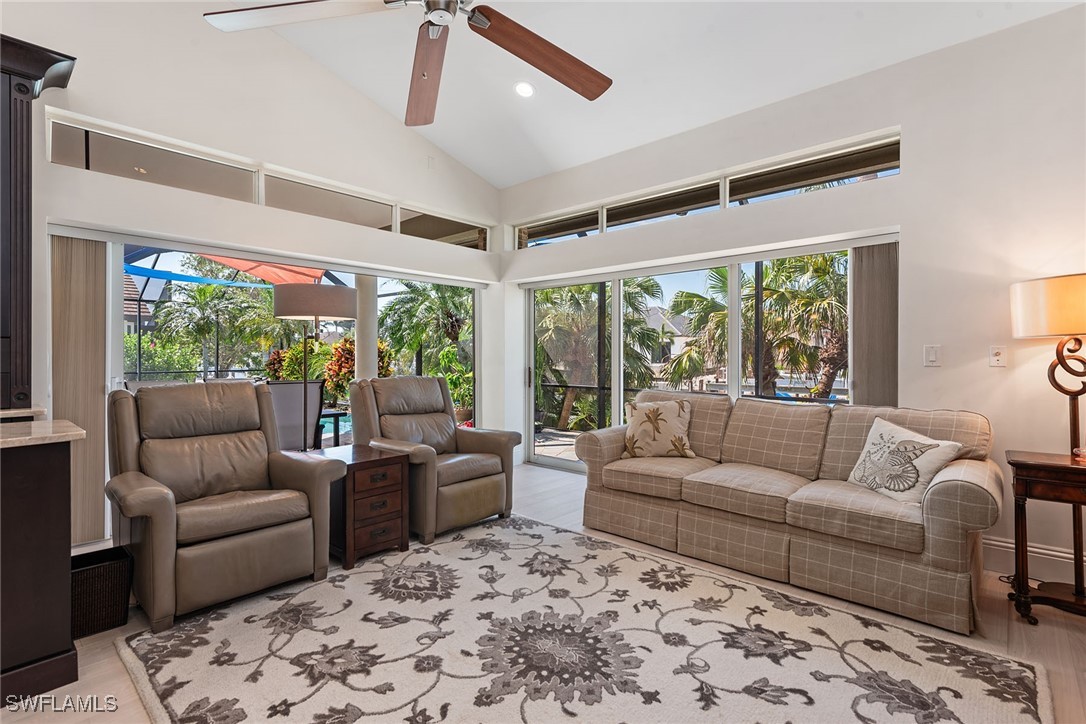
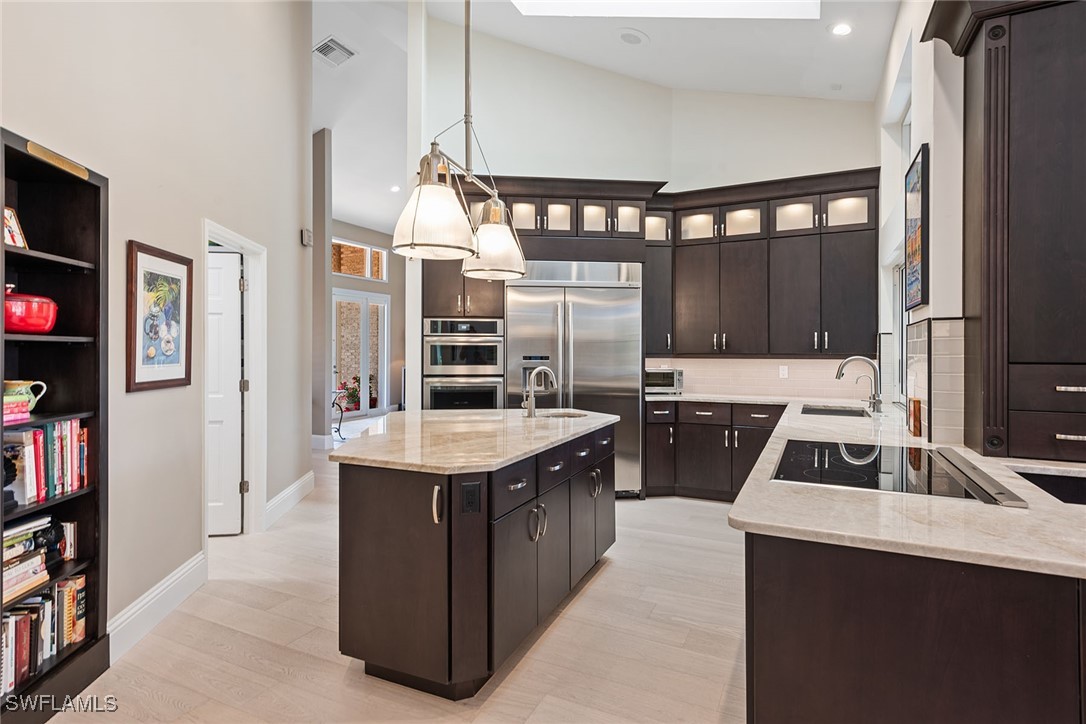
Have you been searching for a private waterfront escape with direct Gulf access, a boat lift and lush tropical surroundings? This beautifully maintained three-bedroom plus den, four-bath home on Marco Island offers serene canal views, southwest exposure and a private dock with a 12,000-pound lift (2022), providing quick access to open waters, ideal for boating, fishing or sunset cruising right from your backyard. Among swaying palms and vibrant landscaping, this residence blends privacy, space and coastal living with effortless style. Step inside to an airy open layout with vaulted ceilings, hardwood floors and baseboards (2023), and abundant natural light throughout. The kitchen, updated with designer finishes, features quartzite countertops, tile backsplash, custom shelving, and under- and in-cabinet lighting, with a pass-through window to the lanai for added convenience. A central island and built-in wet bar enhance functionality and flow, offering multiple sinks and custom cabinetry, ideal for entertaining. Stainless steel appliances, including a cooktop, wall oven, microwave, refrigerator and dishwasher, are seamlessly integrated into this stylish, well-appointed space. The family room opens through pocket doors to the screened lanai, offering expansive indoor-outdoor living and stunning views of the water. The primary suite is a private retreat with lanai access, water views and a spacious remodeled en-suite bath featuring granite counters, dual sinks, a makeup vanity and a floor-to-ceiling tiled shower with frameless glass enclosure, bench seating, and multiple shower heads. A walk-in closet with custom-built-ins adds function to the luxurious feel. Just off the suite, a versatile den with pocket sliders can serve as an office, gym or nursery, and includes its full bath with a walk-in shower, which also serves as the pool bath. Two guest bedrooms offer thoughtful privacy, one enjoys canal views, lanai access, and an en-suite bath with a skylight and tub-shower combo, while the other has direct outdoor access and a nearby bath with a walk-in shower. The laundry room includes an LG washer and dryer, utility sink, and ample cabinetry for storage. The garage features built-in cabinets, and recent upgrades provide added peace of mind such as HVAC (2021), main electrical panel (2024), pool/ dock subpanel (2022), Xfinity cable rewiring (2019), GenerLink generator hookup, 2024 exterior repaint and a reverse osmosis system serving the kitchen sink, bar sink and icemaker. Outside, enjoy the expansive screened lanai with pool, spa, sunshade, and covered outdoor living space, all leading to your private dock and lift, ready for your next adventure. Just moments from Marco Island’s beaches, this home is near yacht clubs, marinas, golf, tennis, pickleball, dining, boutiques, museums and an executive airport, with easy access to Naples and all of Southwest Florida’s top attractions. Schedule your private showing today.
Build Your Team
Quickly find investor-friendly professionals who can help you succeed in real estate investing at any stage of the investing journey.


Agents
Match with investor-friendly agents who can help you find, analyze, and close your next deal


Lenders
Get the best funding…find investor-friendly lenders who specialize in your deal strategy


Property Managers
Transition to passive investing. Find a trusted property management partnership that lasts.


Tax Pros & Accountants
Taxes and financial reporting made easy—find experts to create tax savings strategies, file taxes, and more
Location
Property Details
Parking
- Description: Circle Drive, Driveway Paved
- Details: Attached, Covered, Driveway, Garage, Paved
- Garage Spaces: 2
- Spaces Total: 0
Bedroom Information
- # of Bedrooms: 3
Bathroom Information
- # of Baths (Full): 4
- # of Baths (Total): 4.0
Interior Features
- # of Rooms: 8
- # of Stories: 1
Exterior Features
- Roof Material: Tile
- Pool: Yes
Land Information
- Land Use: Residential
- Land Use Subtype: Single Family Residential
Lot Information
- Parcel ID: 56791240000
- Lot Size: 0 sqft
Property Information
- Property Type: Single Family Residence
- Style: Ranch, One Story
- Year Built: 1990
Tax Information
- Annual Tax: $7,685
Utilities
- Water & Sewer: Public
- Heating: Central, Electric
- Cooling: Central Air, Ceiling Fan(s), Electric
Location
- County: Collier
Listing Details
Investment Summary
- Monthly Cash Flow
- -$5,519
- Cap Rate
- 3.0%
- Cash-on-Cash Return
- -14.4%
- Debt Coverage Ratio
- 0.47
- Internal Rate of Return (5 years)
- -9.9%
Cash Flow
Net Operating Income (NOI) minus mortgage payments.
Calculation:
NOI - Mortgage Payments
Cap Rate (Market Value)
Capitalization Rate is a rate of return that compares the yearly Net Operating Income (NOI) to the market value.
Calculation:
NOI / Market Value
Cash-on-Cash Return (CoC)
Annual Cash Flow / Cash Invested
Calculation:
Annual cash flow divided by initial cash invested.
Debt Coverage Ratio (DCR)
Net Operating Income (NOI) divided by total debt payments.
Calculation:
NOI / Total Debt Payments
Internal Rate of Return (IRR)
A metric for assessing profitability over time. IRR is the discount rate at which the net present value (NPV) of all future cash flows (positive and negative) from an investment equals zero — including both periodic cash flow (such as rent) and a projected sale at the end of the holding period. It represents the expected annualized return, accounting for income, expenses, and the recovery of capital through a future sale.
Purchase Details
Purchase PriceThe price paid for the property. Purchase price:
| $1,999,000 |
|---|---|
Amount FinancedThe amount of the purchase financed through a loan. Amount financed:
| -$1,599,200 |
Down paymentThe initial payment made towards the purchase. Down payment:
| $399,800 |
Closing CostsFees and expenses associated with purchasing a property, typically ranging from 2% to 5% of the home’s purchase price, paid at the end of a home purchase to cover services like lending, title transfer, and taxes. Closing costs:
| $59,970 |
Rehab CostsCosts incurred to repair or improve the property, including: roof, flooring, exterior siding, kitchen, exterior paint, bathrooms, etc. Rehab costs:
| $0 |
Initial Cash InvestedThe total initial cash invested in the property. Calculation:Down payment + Buying costs + Rehab costs Initial cash invested:
| $459,770 |
Square Feet (SQFT)The total square footage of the property. Square feet:
| 2,613 |
Cost Per Square FootCost per square foot of the property. Calculation:Purchase Price / Square Feet Cost per square foot:
| $765 |
Monthly Rent Per Square FootMonthly rent divided by the number of square feet. This ratio helps investors compare rental income efficiency across properties, markets, and unit sizes Calculation:Monthly Rent / Square Feet Monthly rent per square foot:
| $3.10 |
Financing Details
Loan AmountThe total sum of money borrowed from a lender to finance a property purchase. Calculation:Purchase Price - Down Payment
Loan amount:
| $1,599,200 |
|---|---|
Loan to Value Ratio (LTV)Loan amount divided by the market value of the property. Calculation:Loan Amount / Market Value
Loan to value ratio:
| 80.0% |
Loan TypeThe type of loan (e.g., fixed, adjustable).
Loan type:
| Amortizing |
TermThe loan repayment period in years.
Term:
| 30 years |
Interest RateThe percentage a lender charges on the borrowed amount of a loan, determining the cost of borrowing money.
Interest rate:
| 6.840% |
Principal & Interest (PI)The principal is the portion of the loan payment that reduces the loan balance. The interest is the lender's charge for borrowing money. Calculation:(P * r * (1 + r) ** n) / ((1 + r) ** n - 1) Where:
P = Loan amount (principal)
Principal & interest:
| $10,468 |
Property TaxesAnnual taxes levied by local governments on real estate properties. These taxes fund public services like schools, roads, and emergency services.
Property tax:
| $640 |
InsuranceThe costs for insurance coverage to protect against financial losses due to risks like fire, natural disasters, theft, liability, or tenant-related damages. Calculation:Assumes 7% of gross rental income, unless insurance rates are specified.
Insurance:
| $567 |
Private Mortgage Insurance (PMI)A fee that borrowers pay when they take out a conventional loan with a loan-to-value (LTV) ratio above 80%.
Private mortgage insurance (PMI):
| $0 |
Monthly PaymentThe fixed amount a borrower pays each month to repay a loan. It typically includes principal and interest (P&I) and may also cover property taxes, insurance, HOA fees, and PMI if escrowed. Monthly payment:
| $11,675 |
Operating Income
| % Rent | Monthly | Yearly | |
|---|---|---|---|
Gross RentThe total rental income received from tenants before deducting any expenses. Includes base rent, late fees, pet fees, parking fees, and other recurring charges.
Gross rent:
| $8,100 | $97,200 | |
Vacancy LossExpected loss of rent due to vacancies.
Vacancy loss:
(6%)
| 6% | -$486 | -$5,832 |
Operating IncomeGross rental income minus vacancy loss. Calculation:Gross rent - Vacancy loss
Operating income:
| $7,614 | $91,368 |
Operating Expenses
| % Rent | Monthly | Yearly | |
|---|---|---|---|
Property TaxesAnnual taxes levied by local governments on real estate properties. These taxes fund public services like schools, roads, and emergency services. | 8% | -$640 | -$7,685 |
InsuranceThe costs for insurance coverage to protect against financial losses due to risks like fire, natural disasters, theft, liability, or tenant-related damages. Calculation:Assumes 7% of gross rental income, unless insurance rates are specified. | 7% | -$567 | -$6,804 |
Property ManagementThe costs associated with hiring a property manager to handle the day-to-day operations of a rental property. Includes management fees, leasing fes, eviction fees, etc. Calculation:Assumes 8% of gross rental income. | 8% | -$648 | -$7,776 |
Repairs & MaintenanceOngoing costs for routine upkeep and minor fixes needed to keep a property in good working condition. Calculation:Assumes 5% of gross rental income. Varies by property age and condition. | 5% | -$405 | -$4,860 |
Capital ExpensesLarge, infrequent costs for major improvements or replacements, like a new roof, HVAC system, or appliances. Calculation:Assumes 5% of gross rental income. Varies by property age. | 5% | -$405 | -$4,860 |
HOA FeesRegular dues paid to a Homeowners Association for community maintenance, amenities, and management. Similar fees include: Condo Association Fees, Co-op Maintenance Fees, etc. | n/a | n/a | n/a |
Operating ExpensesRecurring costs required to maintain and manage a rental property, including property taxes, insurance, maintenance, repairs, utilities (if paid by the owner), property management fees, and other day-to-day expenses. Calculation:Insurance + Property Taxes + Property Management + Repairs & Maintenance + Capital Expenditures + HOA Fees | 33% | -$2,665 | -$31,985 |
Cash Flow
| Monthly | Yearly | |
|---|---|---|
Net Operating Income (NOI)The income generated from a property after deducting all operating expenses but before deducting mortgage payments, taxes, and capital expenditures. Calculation:Gross Operating Income - Operating Expenses
Net operating income:
| $4,949 | $59,388 |
Mortgage PaymentThe fixed amount a borrower pays each month to repay a loan. It typically includes principal and interest (P&I) and may also cover property taxes, insurance, HOA fees, and PMI if escrowed. | -$10,468 | -$125,616 |
Cash FlowNet Operating Income (NOI) minus mortgage payments. Calculation:NOI - Mortgage Payments | $5,519 | $66,228 |