$1,095,000
Investment Summary
- Monthly Cash Flow
- -$1,975
- Cap Rate
- 4.1%
- Cash-on-Cash Return
- -9.4%
- Debt Coverage Ratio
- 0.65
- Internal Rate of Return (5 years)
- -5.1%
Cash Flow
Net Operating Income (NOI) minus mortgage payments.
Calculation:
NOI - Mortgage Payments
Cap Rate (Market Value)
Capitalization Rate is a rate of return that compares the yearly Net Operating Income (NOI) to the market value.
Calculation:
NOI / Market Value
Cash-on-Cash Return (CoC)
Annual Cash Flow / Cash Invested
Calculation:
Annual cash flow divided by initial cash invested.
Debt Coverage Ratio (DCR)
Net Operating Income (NOI) divided by total debt payments.
Calculation:
NOI / Total Debt Payments
Internal Rate of Return (IRR)
A metric for assessing profitability over time. IRR is the discount rate at which the net present value (NPV) of all future cash flows (positive and negative) from an investment equals zero — including both periodic cash flow (such as rent) and a projected sale at the end of the holding period. It represents the expected annualized return, accounting for income, expenses, and the recovery of capital through a future sale.
Property Description
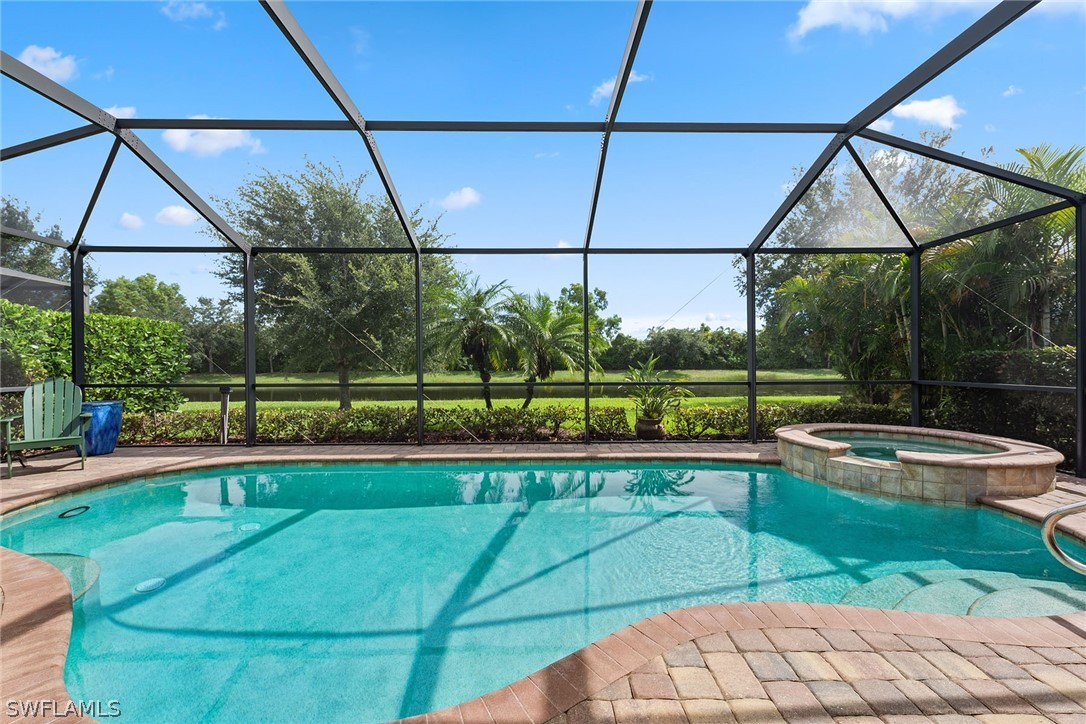
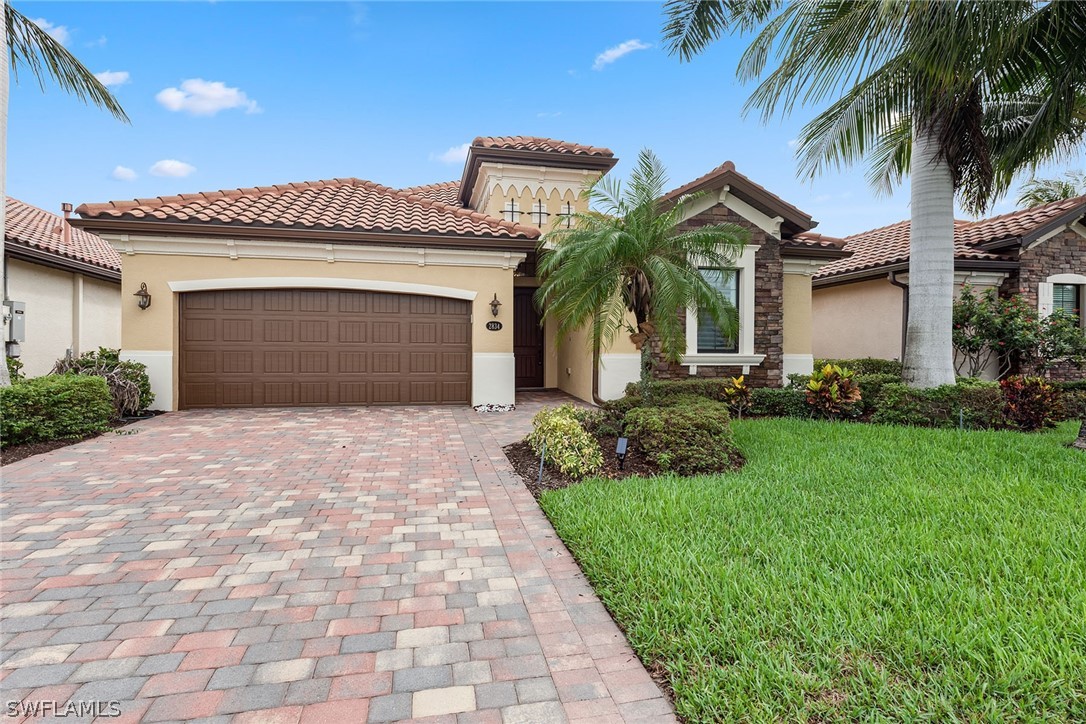
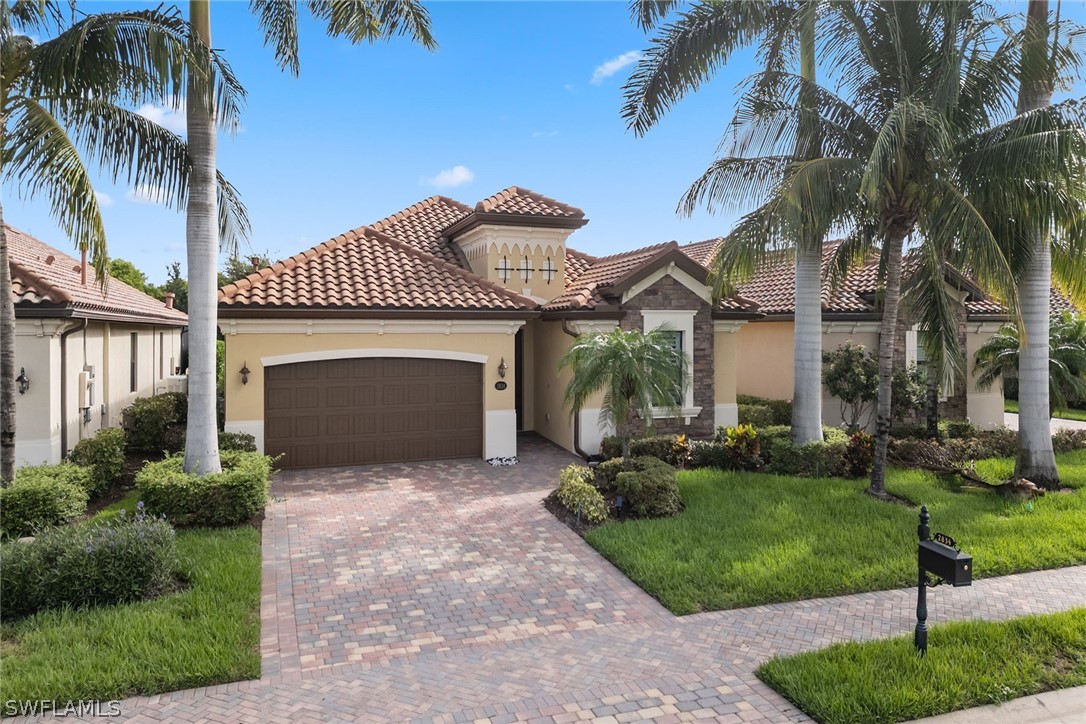
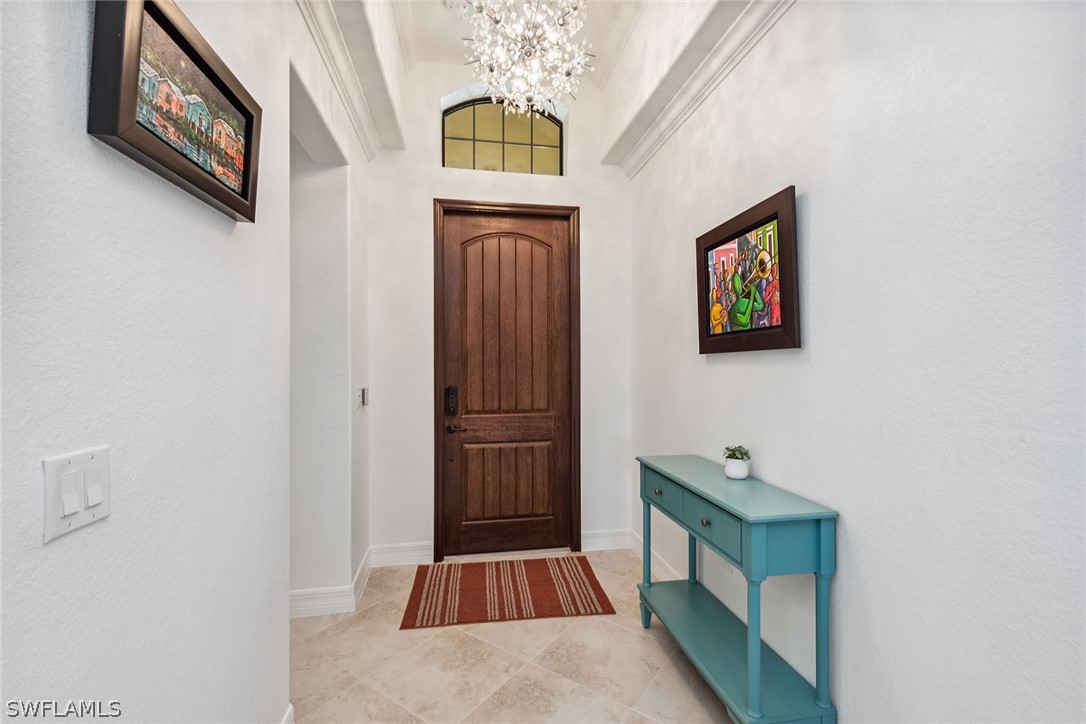
Experience luxury living in this meticulously maintained home in the prestigious Millbrook community of Fiddler’s Creek, Naples. This stunning residence, featuring the Sophia Floor Plan, offers 2,032 square feet of living space with four bedrooms and three full baths. The property is enhanced by private lake views and features a tile roof with newly upgraded insulation, impact doors and windows, and a wide paver driveway and walkway. Step into a foyer adorned with a tray ceiling and spectacular chandelier, leading to an interior that boasts white plantation shutters, tile floors throughout and elegant crown molding. The home comes beautifully furnished, offering style and convenience. The kitchen is a chef’s delight, featuring white cabinets, under-cabinet lighting, granite countertops and a tile backsplash. The large three-seater center island, walk-in pantry, built-in desk and stainless-steel GE appliances, including a gas range, wall oven, microwave, French door refrigerator and dishwasher, make it ideal for culinary endeavors. The formal dining area and living room are highlighted by a brick tile accent wall, custom tray ceilings and glass sliders opening to the lanai. The owner’s suite is a private retreat with access to the lanai, a walk-in closet, and an en-suite bath featuring a white dual sink vanity with granite countertops, a walk-in shower with a glass enclosure and a separate soaking tub. One guest bedroom is at the front of the house and is adjacent to a bath with a vanity, granite countertop and a shower-tub combo. Another guest bedroom, which can also serve as a den or study, is equipped with glass French doors. The fourth bedroom offers an en-suite bath with a vanity, granite countertop and walk-in shower. The outdoor living space is an oasis, featuring a screened lanai with a brick paver floor, a covered outdoor living area with a cypress ceiling and recessed lighting, and an outdoor kitchen equipped with a built-in gas grill and hood, mini refrigerator and brick tile backsplash. Enjoy the heated saltwater pool with a waterfall feature, ideal for relaxation. Additional features include a laundry area with ample storage, white cabinets, a GE top-load washer and a GE front-load dryer. The garage is equipped with epoxy flooring and a utility sink. The home has been updated with new paint inside and out, a tankless gas water heater installed in 2023 and a new HVAC system in 2023. The Fiddler’s Creek community offers award-winning amenities, including a clubhouse, fitness center, full-service spa, sauna, multiple pools, tennis, pickleball, bocce, restaurants, and a full social and event calendar. Optional memberships are available for a beach club and a marina, as well as an optional golf membership with a new clubhouse and renovated golf course to be completed in 2024, offering immediate memberships. This home provides a luxurious lifestyle tailored to the discerning homeowner.
Build Your Team
Quickly find investor-friendly professionals who can help you succeed in real estate investing at any stage of the investing journey.


Agents
Match with investor-friendly agents who can help you find, analyze, and close your next deal


Lenders
Get the best funding…find investor-friendly lenders who specialize in your deal strategy


Property Managers
Transition to passive investing. Find a trusted property management partnership that lasts.


Tax Pros & Accountants
Taxes and financial reporting made easy—find experts to create tax savings strategies, file taxes, and more
Location
Property Details
Parking
- Description: Attached, Covered, Driveway, ElectricVehicleChargingStations, Garage, Paved, TwoSpaces, GarageDoorOpener
- Details: Attached, Covered, Driveway, Electric Vehicle Charging Station(s), Garage, Paved, Garage Door Opener
- Garage Spaces: 2
- Spaces Total: 0
Bedroom Information
- # of Bedrooms: 4
Bathroom Information
- # of Baths (Full): 3
- # of Baths (Total): 3.0
Interior Features
- # of Rooms: 9
- # of Stories: 1
Exterior Features
- Roof Material: Tile
- Pool: Yes
- Pool Community: Yes
HOA
- Has HOA: Yes
- Additional HOA Fee: $880/quarterly
Land Information
- Land Use: Residential
- Land Use Subtype: Single Family Residential
Lot Information
- Parcel ID: 60175000522
- Lot Size: 0 sqft
Property Information
- Property Type: Single Family Residence
- Style: Ranch, One Story
- Year Built: 2016
Tax Information
- Annual Tax: $9,539
Utilities
- Water & Sewer: Public
- Heating: Central, Electric
- Cooling: Central Air, Ceiling Fan(s), Electric
Location
- County: Collier
Listing Details
Investment Summary
- Monthly Cash Flow
- -$1,975
- Cap Rate
- 4.1%
- Cash-on-Cash Return
- -9.4%
- Debt Coverage Ratio
- 0.65
- Internal Rate of Return (5 years)
- -5.1%
Cash Flow
Net Operating Income (NOI) minus mortgage payments.
Calculation:
NOI - Mortgage Payments
Cap Rate (Market Value)
Capitalization Rate is a rate of return that compares the yearly Net Operating Income (NOI) to the market value.
Calculation:
NOI / Market Value
Cash-on-Cash Return (CoC)
Annual Cash Flow / Cash Invested
Calculation:
Annual cash flow divided by initial cash invested.
Debt Coverage Ratio (DCR)
Net Operating Income (NOI) divided by total debt payments.
Calculation:
NOI / Total Debt Payments
Internal Rate of Return (IRR)
A metric for assessing profitability over time. IRR is the discount rate at which the net present value (NPV) of all future cash flows (positive and negative) from an investment equals zero — including both periodic cash flow (such as rent) and a projected sale at the end of the holding period. It represents the expected annualized return, accounting for income, expenses, and the recovery of capital through a future sale.
Purchase Details
Purchase PriceThe price paid for the property. Purchase price:
| $1,095,000 |
|---|---|
Amount FinancedThe amount of the purchase financed through a loan. Amount financed:
| -$876,000 |
Down paymentThe initial payment made towards the purchase. Down payment:
| $219,000 |
Closing CostsFees and expenses associated with purchasing a property, typically ranging from 2% to 5% of the home’s purchase price, paid at the end of a home purchase to cover services like lending, title transfer, and taxes. Closing costs:
| $32,850 |
Rehab CostsCosts incurred to repair or improve the property, including: roof, flooring, exterior siding, kitchen, exterior paint, bathrooms, etc. Rehab costs:
| $0 |
Initial Cash InvestedThe total initial cash invested in the property. Calculation:Down payment + Buying costs + Rehab costs Initial cash invested:
| $251,850 |
Square Feet (SQFT)The total square footage of the property. Square feet:
| 2,032 |
Cost Per Square FootCost per square foot of the property. Calculation:Purchase Price / Square Feet Cost per square foot:
| $539 |
Monthly Rent Per Square FootMonthly rent divided by the number of square feet. This ratio helps investors compare rental income efficiency across properties, markets, and unit sizes Calculation:Monthly Rent / Square Feet Monthly rent per square foot:
| $3.44 |
Financing Details
Loan AmountThe total sum of money borrowed from a lender to finance a property purchase. Calculation:Purchase Price - Down Payment
Loan amount:
| $876,000 |
|---|---|
Loan to Value Ratio (LTV)Loan amount divided by the market value of the property. Calculation:Loan Amount / Market Value
Loan to value ratio:
| 80.0% |
Loan TypeThe type of loan (e.g., fixed, adjustable).
Loan type:
| Amortizing |
TermThe loan repayment period in years.
Term:
| 30 years |
Interest RateThe percentage a lender charges on the borrowed amount of a loan, determining the cost of borrowing money.
Interest rate:
| 6.810% |
Principal & Interest (PI)The principal is the portion of the loan payment that reduces the loan balance. The interest is the lender's charge for borrowing money. Calculation:(P * r * (1 + r) ** n) / ((1 + r) ** n - 1) Where:
P = Loan amount (principal)
Principal & interest:
| $5,717 |
Property TaxesAnnual taxes levied by local governments on real estate properties. These taxes fund public services like schools, roads, and emergency services.
Property tax:
| $795 |
InsuranceThe costs for insurance coverage to protect against financial losses due to risks like fire, natural disasters, theft, liability, or tenant-related damages. Calculation:Assumes 7% of gross rental income, unless insurance rates are specified.
Insurance:
| $490 |
Private Mortgage Insurance (PMI)A fee that borrowers pay when they take out a conventional loan with a loan-to-value (LTV) ratio above 80%.
Private mortgage insurance (PMI):
| $0 |
Monthly PaymentThe fixed amount a borrower pays each month to repay a loan. It typically includes principal and interest (P&I) and may also cover property taxes, insurance, HOA fees, and PMI if escrowed. Monthly payment:
| $7,002 |
Operating Income
| % Rent | Monthly | Yearly | |
|---|---|---|---|
Gross RentThe total rental income received from tenants before deducting any expenses. Includes base rent, late fees, pet fees, parking fees, and other recurring charges.
Gross rent:
| $7,000 | $84,000 | |
Vacancy LossExpected loss of rent due to vacancies.
Vacancy loss:
(6%)
| 6% | -$420 | -$5,040 |
Operating IncomeGross rental income minus vacancy loss. Calculation:Gross rent - Vacancy loss
Operating income:
| $6,580 | $78,960 |
Operating Expenses
| % Rent | Monthly | Yearly | |
|---|---|---|---|
Property TaxesAnnual taxes levied by local governments on real estate properties. These taxes fund public services like schools, roads, and emergency services. | 11% | -$795 | -$9,540 |
InsuranceThe costs for insurance coverage to protect against financial losses due to risks like fire, natural disasters, theft, liability, or tenant-related damages. Calculation:Assumes 7% of gross rental income, unless insurance rates are specified. | 7% | -$490 | -$5,880 |
Property ManagementThe costs associated with hiring a property manager to handle the day-to-day operations of a rental property. Includes management fees, leasing fes, eviction fees, etc. Calculation:Assumes 8% of gross rental income. | 8% | -$560 | -$6,720 |
Repairs & MaintenanceOngoing costs for routine upkeep and minor fixes needed to keep a property in good working condition. Calculation:Assumes 5% of gross rental income. Varies by property age and condition. | 5% | -$350 | -$4,200 |
Capital ExpensesLarge, infrequent costs for major improvements or replacements, like a new roof, HVAC system, or appliances. Calculation:Assumes 5% of gross rental income. Varies by property age. | 5% | -$350 | -$4,200 |
HOA FeesRegular dues paid to a Homeowners Association for community maintenance, amenities, and management. Similar fees include: Condo Association Fees, Co-op Maintenance Fees, etc. | 4% | -$293 | -$3,516 |
Operating ExpensesRecurring costs required to maintain and manage a rental property, including property taxes, insurance, maintenance, repairs, utilities (if paid by the owner), property management fees, and other day-to-day expenses. Calculation:Insurance + Property Taxes + Property Management + Repairs & Maintenance + Capital Expenditures + HOA Fees | 41% | -$2,838 | -$34,056 |
Cash Flow
| Monthly | Yearly | |
|---|---|---|
Net Operating Income (NOI)The income generated from a property after deducting all operating expenses but before deducting mortgage payments, taxes, and capital expenditures. Calculation:Gross Operating Income - Operating Expenses
Net operating income:
| $3,742 | $44,904 |
Mortgage PaymentThe fixed amount a borrower pays each month to repay a loan. It typically includes principal and interest (P&I) and may also cover property taxes, insurance, HOA fees, and PMI if escrowed. | -$5,717 | -$68,604 |
Cash FlowNet Operating Income (NOI) minus mortgage payments. Calculation:NOI - Mortgage Payments | $1,975 | $23,700 |