$1,099,900
Investment Summary
- Monthly Cash Flow
- -$2,905
- Cap Rate
- 3.0%
- Cash-on-Cash Return
- -13.8%
- Debt Coverage Ratio
- 0.48
- Internal Rate of Return (5 years)
- -9.3%
Cash Flow
Net Operating Income (NOI) minus mortgage payments.
Calculation:
NOI - Mortgage Payments
Cap Rate (Market Value)
Capitalization Rate is a rate of return that compares the yearly Net Operating Income (NOI) to the market value.
Calculation:
NOI / Market Value
Cash-on-Cash Return (CoC)
Annual Cash Flow / Cash Invested
Calculation:
Annual cash flow divided by initial cash invested.
Debt Coverage Ratio (DCR)
Net Operating Income (NOI) divided by total debt payments.
Calculation:
NOI / Total Debt Payments
Internal Rate of Return (IRR)
A metric for assessing profitability over time. IRR is the discount rate at which the net present value (NPV) of all future cash flows (positive and negative) from an investment equals zero — including both periodic cash flow (such as rent) and a projected sale at the end of the holding period. It represents the expected annualized return, accounting for income, expenses, and the recovery of capital through a future sale.
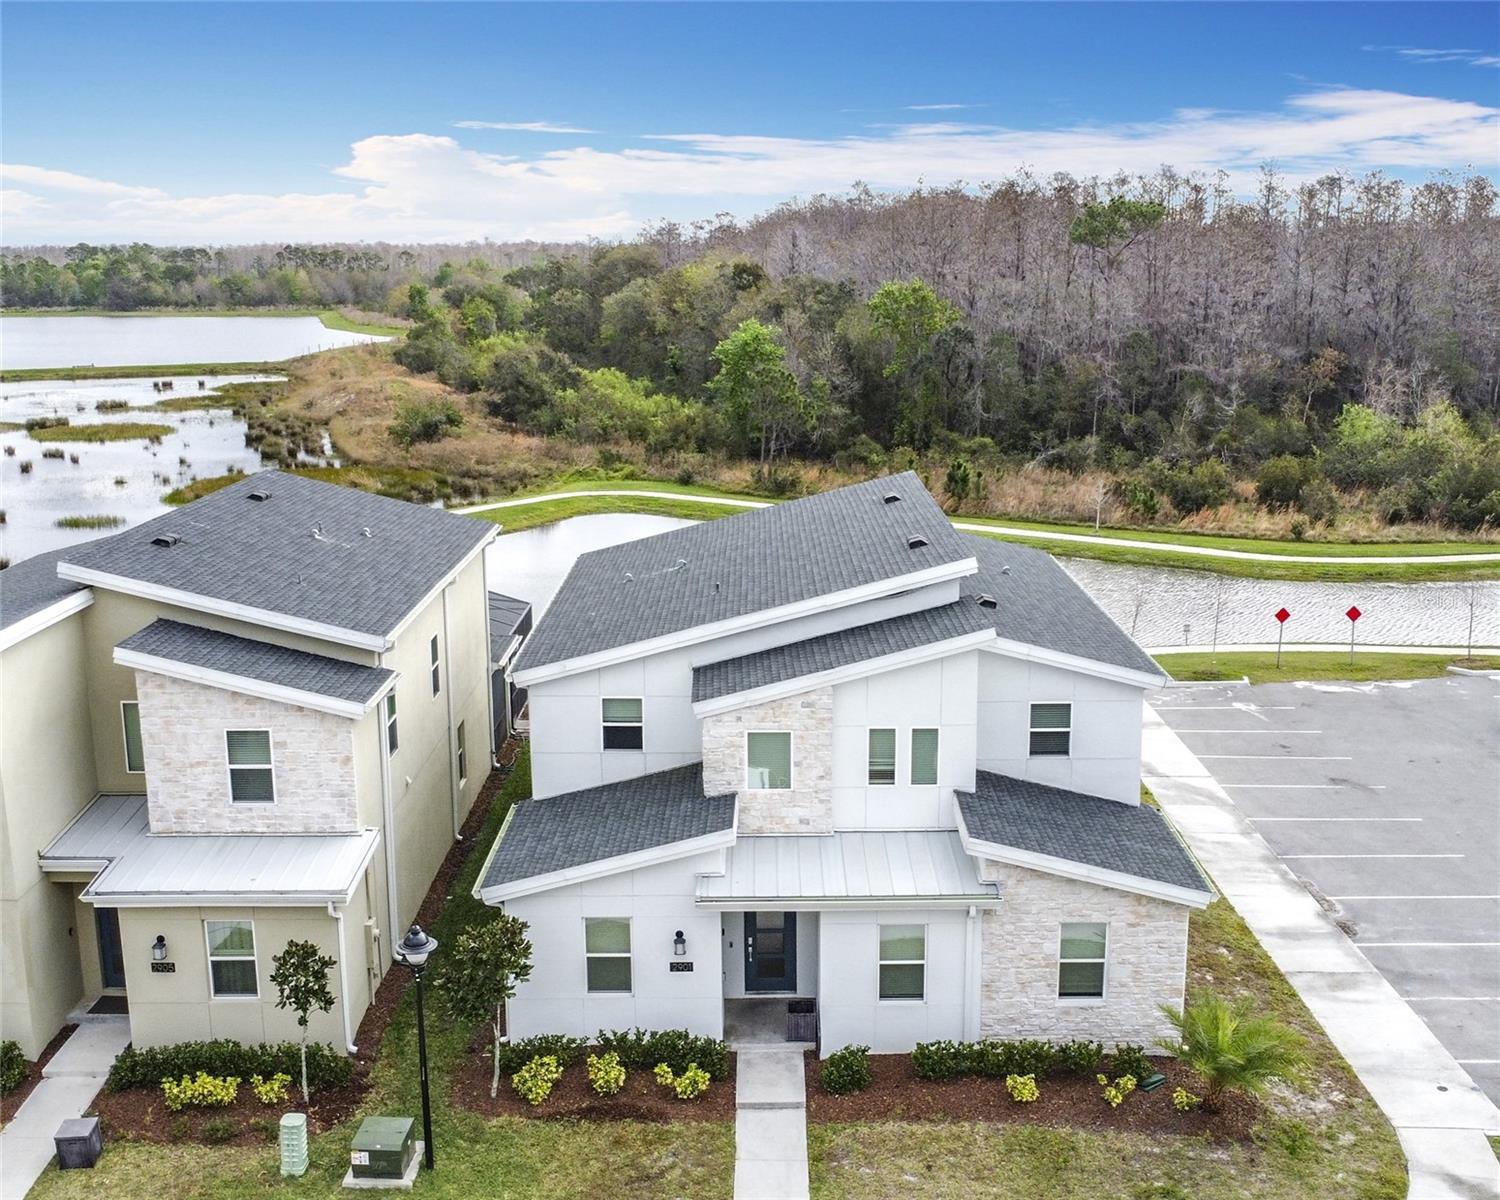
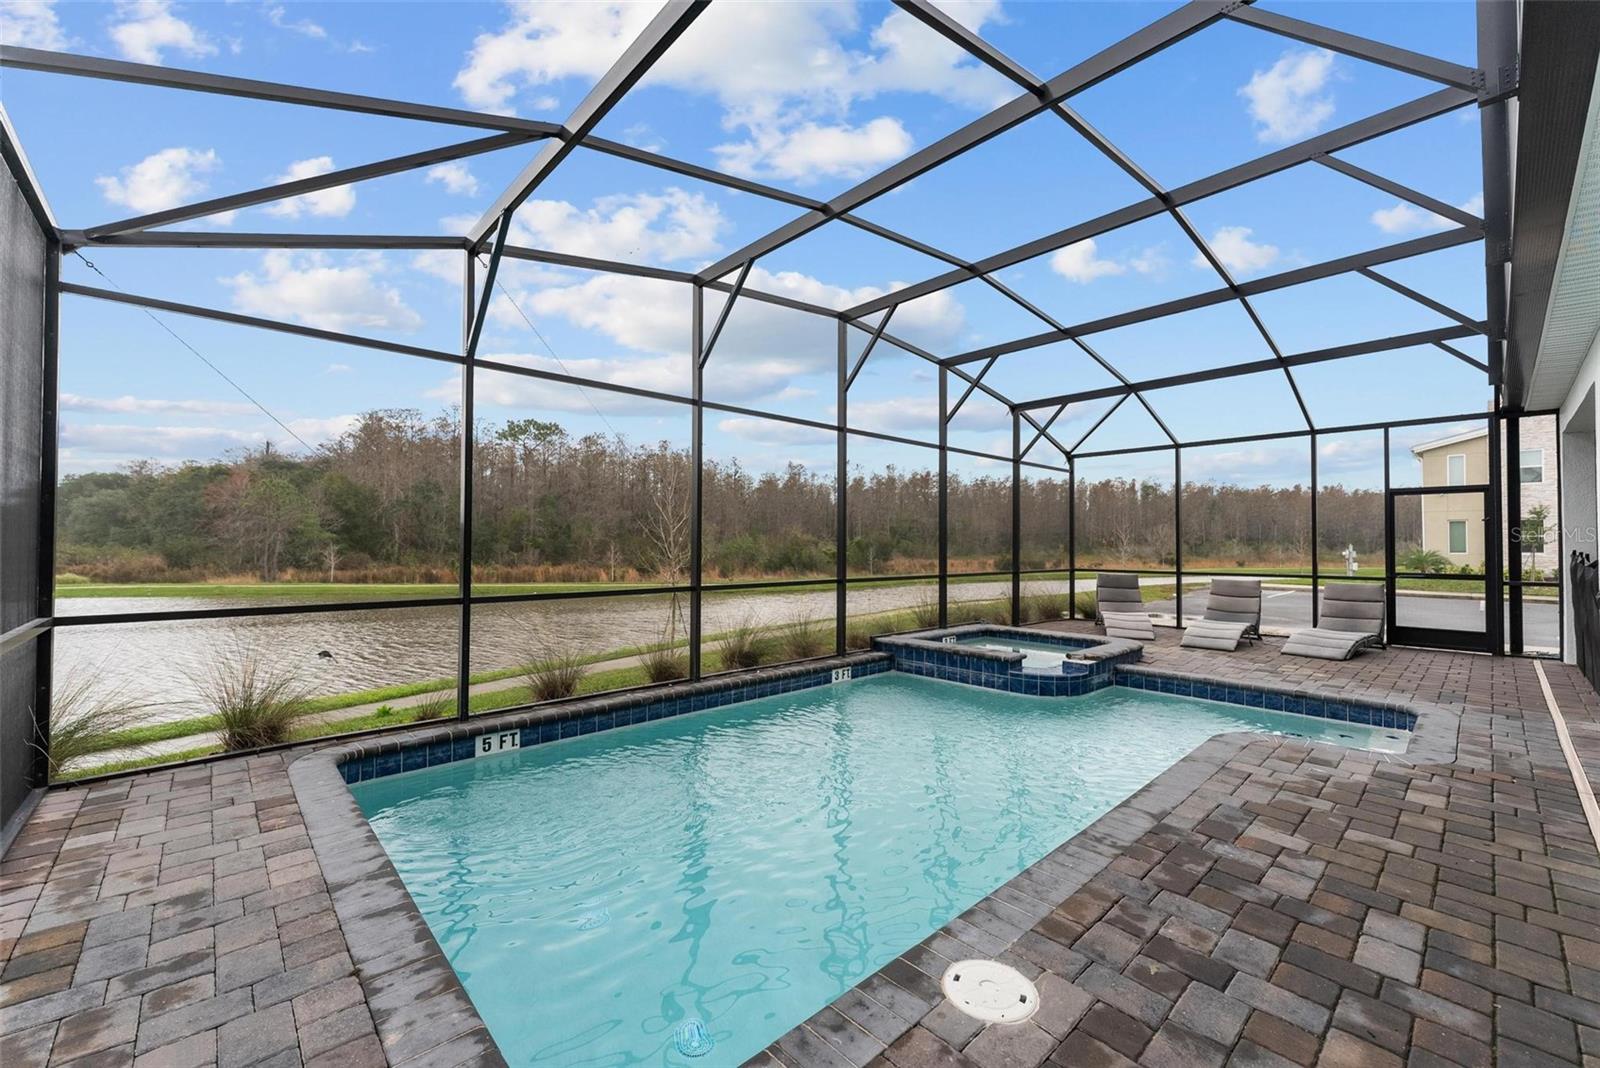
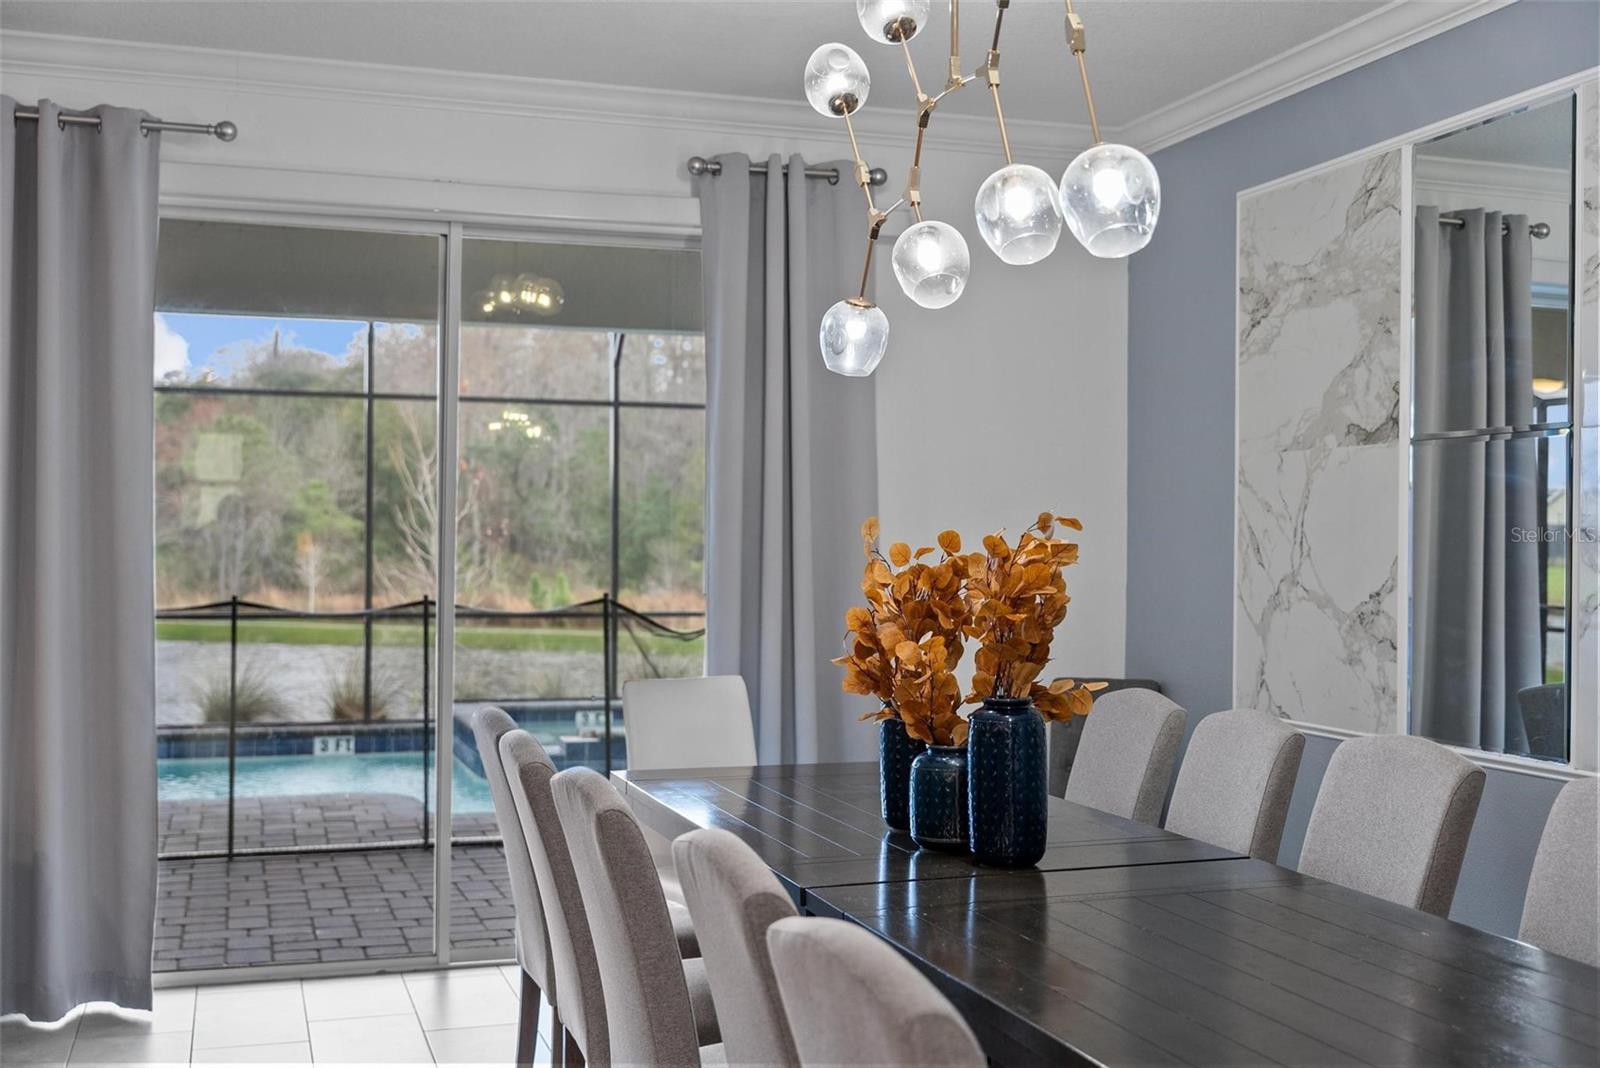
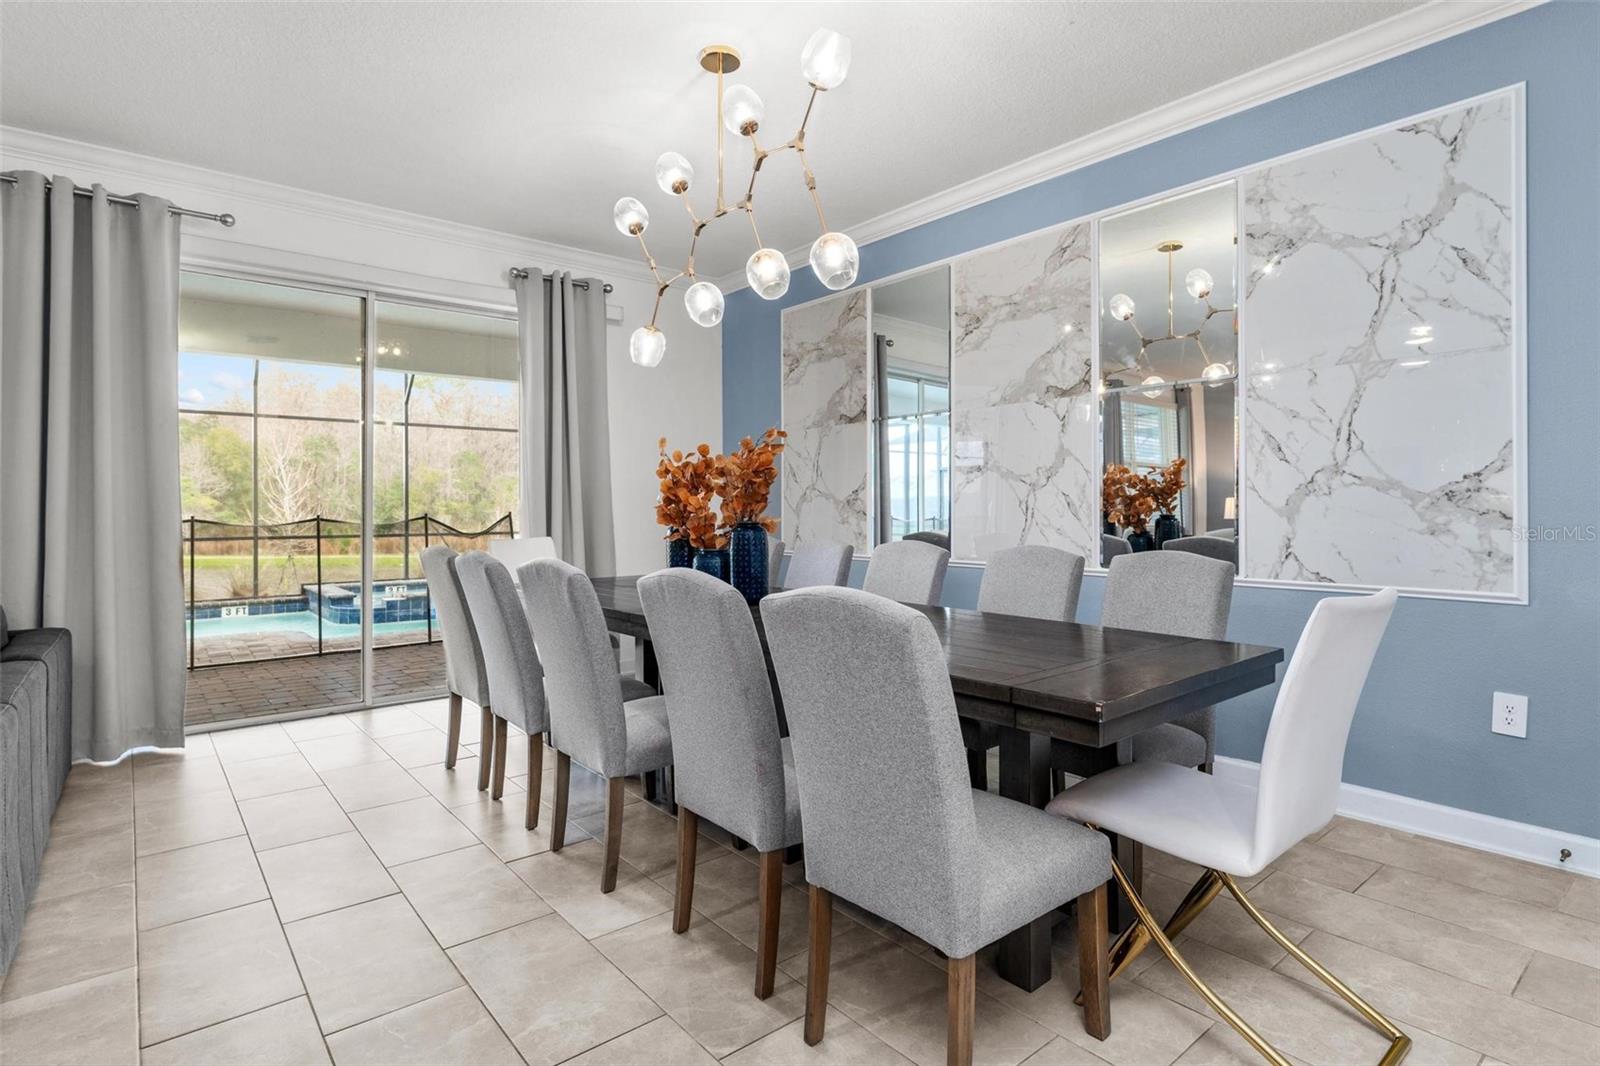
Property Description
Income Producing AirBnb StoreyLake2901. Over $111,000 ANNUAL gross rent income last year ***** 5 stars reviews vacation experience! MODERN home in GATED community by Disney Orlando, Florida. BEST one with water and woods view in the luxury row of Storey Lake, and corner lot with extra open parking spaces. Newer built 2022. Gorgeous 9 bedrooms, 5 full baths, POOL. 3,994 sqft+ brick paver cover patio, lanai screen enclosure. Owners suite on 1st level separate walk in shower & bathtub. Gated 24-hour community with resort style amenities & kayak. Multiple themed rooms Avengers, Star Wars, Frozen, Harry Potter, Pokeman make this property unforgettable the perfect place to make lasting family memories. Star Wars room has a pool table and air hockey table. Upstairs has Avengers loft space to enjoy movie night. Ask me for the Video Tour link. <p> 8 miles drive from Walt Disney World Orlando. Fully Furnished – Turnkey Luxury Home. 15 beds can sleep 25 guests. Modern high quality furnishings and décor by designer worth over $100k Modern styles throughout. Just need to bring your clothes and toothbrush. Behind the house is protected and owned by the Shingle Creek at Bronson CDD, and Osceola Countys Shingle Creek Regional Park. Next to the nature trails. Corner lot with extra open parking spaces. Decor wall colors can be changed, but land and gorgeous views cannot. This truly is the best lot and best community. <p> On the first floor main level, the primary owners suite and two guest suites are situated, ensuring accessibility. Owner’s ensuite full bathroom has a separate walk-in shower and soaking bathtub. Modern kitchen is fully stocked with appliances, cookware and utensils for convenience. Open floor plan seamlessly unfolds into the open family room and luxury dining room, which connects to the generously sized covered screened lanai. Glass sliding doors merging indoor and outdoor spaces. Pool with spa, an epitome of luxury living and an ideal setting for hosting indoor & outdoor gatherings. <p> Nestled within the sought after Storey Lake Community, 24-hour gated community, resort style living, and family friendly. Club fees $248/month include amenities access to 2 clubhouses (Bronson & Hideaway Club), resort style pool, hot tub, lazy river, water park slides, splash pad, cabana, fitness gym, putt-putt mini golf, playground, dock with canoe kayak rental, beach volleyball, basketball, ping pong, pool table, business center. Homeowner’s Association HOA fee $294/month included gated entrance with 24/7 attendant, professionally landscaped grounds, cable, internet, community events and community manager, trash pickup 7 days a week. HOA reserves include exterior paint, roof replacement, exterior pest control, street paving, ponds maintenance. Ask me for more details! <p>
Build Your Team
Quickly find investor-friendly professionals who can help you succeed in real estate investing at any stage of the investing journey.


Agents
Match with investor-friendly agents who can help you find, analyze, and close your next deal


Lenders
Get the best funding…find investor-friendly lenders who specialize in your deal strategy


Property Managers
Transition to passive investing. Find a trusted property management partnership that lasts.


Tax Pros & Accountants
Taxes and financial reporting made easy—find experts to create tax savings strategies, file taxes, and more
Location
Property Details
Parking
- Description: Open
- Garage Spaces: 0
- Spaces Total: 0
Bedroom Information
- # of Bedrooms: 9
Bathroom Information
- # of Baths (Full): 5
- # of Baths (Total): 0.0
Interior Features
- # of Stories: 2
Exterior Features
- Exterior Walls Materials: Combination
- Foundation: Slab
- Roof Type: Gable or Hip
- Roof Material: Shingle
- Pool: Yes
HOA
- Has HOA: Yes
- Association: HOA - ICON Management
- HOA Fee: $294/monthly
- Additional Association: STOREY LAKE
- Additional HOA Fee: $247/monthly
Land Information
- Land Use: Residential Income
- Land Use Subtype: Single Family Residential
Lot Information
- Parcel ID: 072529517800014120
- Lot Size: 6098 sqft
Property Information
- Property Type: Duplex
- Year Built: 2022
Tax Information
- Annual Tax: $12,912
Utilities
- Water & Sewer: Public
- Heating: Central
- Cooling: Central Air
Location
- County: Osceola
Listing Details
Investment Summary
- Monthly Cash Flow
- -$2,905
- Cap Rate
- 3.0%
- Cash-on-Cash Return
- -13.8%
- Debt Coverage Ratio
- 0.48
- Internal Rate of Return (5 years)
- -9.3%
Cash Flow
Net Operating Income (NOI) minus mortgage payments.
Calculation:
NOI - Mortgage Payments
Cap Rate (Market Value)
Capitalization Rate is a rate of return that compares the yearly Net Operating Income (NOI) to the market value.
Calculation:
NOI / Market Value
Cash-on-Cash Return (CoC)
Annual Cash Flow / Cash Invested
Calculation:
Annual cash flow divided by initial cash invested.
Debt Coverage Ratio (DCR)
Net Operating Income (NOI) divided by total debt payments.
Calculation:
NOI / Total Debt Payments
Internal Rate of Return (IRR)
A metric for assessing profitability over time. IRR is the discount rate at which the net present value (NPV) of all future cash flows (positive and negative) from an investment equals zero — including both periodic cash flow (such as rent) and a projected sale at the end of the holding period. It represents the expected annualized return, accounting for income, expenses, and the recovery of capital through a future sale.
Purchase Details
Purchase PriceThe price paid for the property. Purchase price:
| $1,099,900 |
|---|---|
Amount FinancedThe amount of the purchase financed through a loan. Amount financed:
| -$879,920 |
Down paymentThe initial payment made towards the purchase. Down payment:
| $219,980 |
Closing CostsFees and expenses associated with purchasing a property, typically ranging from 2% to 5% of the home’s purchase price, paid at the end of a home purchase to cover services like lending, title transfer, and taxes. Closing costs:
| $32,997 |
Rehab CostsCosts incurred to repair or improve the property, including: roof, flooring, exterior siding, kitchen, exterior paint, bathrooms, etc. Rehab costs:
| $0 |
Initial Cash InvestedThe total initial cash invested in the property. Calculation:Down payment + Buying costs + Rehab costs Initial cash invested:
| $252,977 |
Square Feet (SQFT)The total square footage of the property. Square feet:
| 3,994 |
Cost Per Square FootCost per square foot of the property. Calculation:Purchase Price / Square Feet Cost per square foot:
| $275 |
Monthly Rent Per Square FootMonthly rent divided by the number of square feet. This ratio helps investors compare rental income efficiency across properties, markets, and unit sizes Calculation:Monthly Rent / Square Feet Monthly rent per square foot:
| $1.58 |
Financing Details
Loan AmountThe total sum of money borrowed from a lender to finance a property purchase. Calculation:Purchase Price - Down Payment
Loan amount:
| $879,920 |
|---|---|
Loan to Value Ratio (LTV)Loan amount divided by the market value of the property. Calculation:Loan Amount / Market Value
Loan to value ratio:
| 80.0% |
Loan TypeThe type of loan (e.g., fixed, adjustable).
Loan type:
| Amortizing |
TermThe loan repayment period in years.
Term:
| 30 years |
Interest RateThe percentage a lender charges on the borrowed amount of a loan, determining the cost of borrowing money.
Interest rate:
| 6.625% |
Principal & Interest (PI)The principal is the portion of the loan payment that reduces the loan balance. The interest is the lender's charge for borrowing money. Calculation:(P * r * (1 + r) ** n) / ((1 + r) ** n - 1) Where:
P = Loan amount (principal)
Principal & interest:
| $5,634 |
Property TaxesAnnual taxes levied by local governments on real estate properties. These taxes fund public services like schools, roads, and emergency services.
Property tax:
| $1,076 |
InsuranceThe costs for insurance coverage to protect against financial losses due to risks like fire, natural disasters, theft, liability, or tenant-related damages. Calculation:Assumes 7% of gross rental income, unless insurance rates are specified.
Insurance:
| $441 |
Private Mortgage Insurance (PMI)A fee that borrowers pay when they take out a conventional loan with a loan-to-value (LTV) ratio above 80%.
Private mortgage insurance (PMI):
| $0 |
Monthly PaymentThe fixed amount a borrower pays each month to repay a loan. It typically includes principal and interest (P&I) and may also cover property taxes, insurance, HOA fees, and PMI if escrowed. Monthly payment:
| $7,151 |
Operating Income
| % Rent | Monthly | Yearly | |
|---|---|---|---|
Gross RentThe total rental income received from tenants before deducting any expenses. Includes base rent, late fees, pet fees, parking fees, and other recurring charges.
Gross rent:
| $6,300 | $75,600 | |
Vacancy LossExpected loss of rent due to vacancies.
Vacancy loss:
(6%)
| 6% | -$378 | -$4,536 |
Operating IncomeGross rental income minus vacancy loss. Calculation:Gross rent - Vacancy loss
Operating income:
| $5,922 | $71,064 |
Operating Expenses
| % Rent | Monthly | Yearly | |
|---|---|---|---|
Property TaxesAnnual taxes levied by local governments on real estate properties. These taxes fund public services like schools, roads, and emergency services. | 17% | -$1,076 | -$12,912 |
InsuranceThe costs for insurance coverage to protect against financial losses due to risks like fire, natural disasters, theft, liability, or tenant-related damages. Calculation:Assumes 7% of gross rental income, unless insurance rates are specified. | 7% | -$441 | -$5,292 |
Property ManagementThe costs associated with hiring a property manager to handle the day-to-day operations of a rental property. Includes management fees, leasing fes, eviction fees, etc. Calculation:Assumes 8% of gross rental income. | 8% | -$504 | -$6,048 |
Repairs & MaintenanceOngoing costs for routine upkeep and minor fixes needed to keep a property in good working condition. Calculation:Assumes 5% of gross rental income. Varies by property age and condition. | 5% | -$315 | -$3,780 |
Capital ExpensesLarge, infrequent costs for major improvements or replacements, like a new roof, HVAC system, or appliances. Calculation:Assumes 5% of gross rental income. Varies by property age. | 5% | -$315 | -$3,780 |
HOA FeesRegular dues paid to a Homeowners Association for community maintenance, amenities, and management. Similar fees include: Condo Association Fees, Co-op Maintenance Fees, etc. | 9% | -$542 | -$6,504 |
Operating ExpensesRecurring costs required to maintain and manage a rental property, including property taxes, insurance, maintenance, repairs, utilities (if paid by the owner), property management fees, and other day-to-day expenses. Calculation:Insurance + Property Taxes + Property Management + Repairs & Maintenance + Capital Expenditures + HOA Fees | 51% | -$3,193 | -$38,316 |
Cash Flow
| Monthly | Yearly | |
|---|---|---|
Net Operating Income (NOI)The income generated from a property after deducting all operating expenses but before deducting mortgage payments, taxes, and capital expenditures. Calculation:Gross Operating Income - Operating Expenses
Net operating income:
| $2,729 | $32,748 |
Mortgage PaymentThe fixed amount a borrower pays each month to repay a loan. It typically includes principal and interest (P&I) and may also cover property taxes, insurance, HOA fees, and PMI if escrowed. | -$5,634 | -$67,608 |
Cash FlowNet Operating Income (NOI) minus mortgage payments. Calculation:NOI - Mortgage Payments | $2,905 | $34,860 |