$425,000
Investment Summary
- Monthly Cash Flow
- -$700
- Cap Rate
- 4.3%
- Cash-on-Cash Return
- -8.6%
- Debt Coverage Ratio
- 0.69
- Internal Rate of Return (5 years)
- -4.3%
Cash Flow
Net Operating Income (NOI) minus mortgage payments.
Calculation:
NOI - Mortgage Payments
Cap Rate (Market Value)
Capitalization Rate is a rate of return that compares the yearly Net Operating Income (NOI) to the market value.
Calculation:
NOI / Market Value
Cash-on-Cash Return (CoC)
Annual Cash Flow / Cash Invested
Calculation:
Annual cash flow divided by initial cash invested.
Debt Coverage Ratio (DCR)
Net Operating Income (NOI) divided by total debt payments.
Calculation:
NOI / Total Debt Payments
Internal Rate of Return (IRR)
A metric for assessing profitability over time. IRR is the discount rate at which the net present value (NPV) of all future cash flows (positive and negative) from an investment equals zero — including both periodic cash flow (such as rent) and a projected sale at the end of the holding period. It represents the expected annualized return, accounting for income, expenses, and the recovery of capital through a future sale.
Property Description
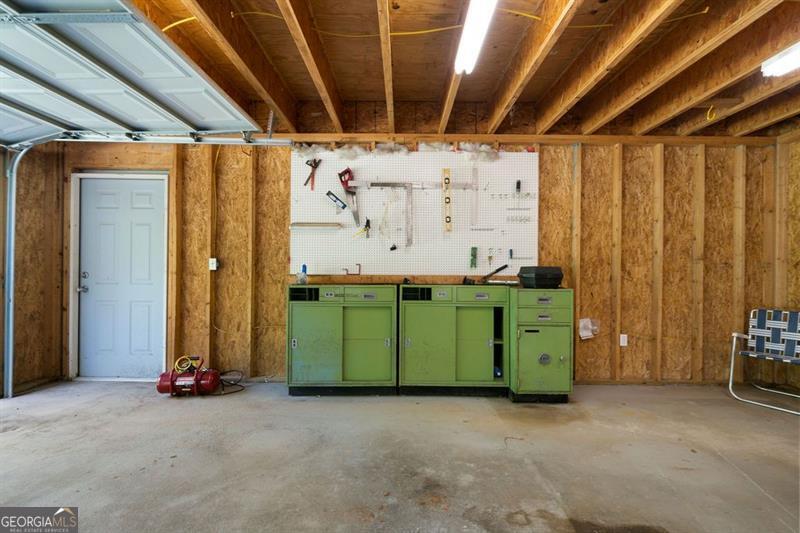
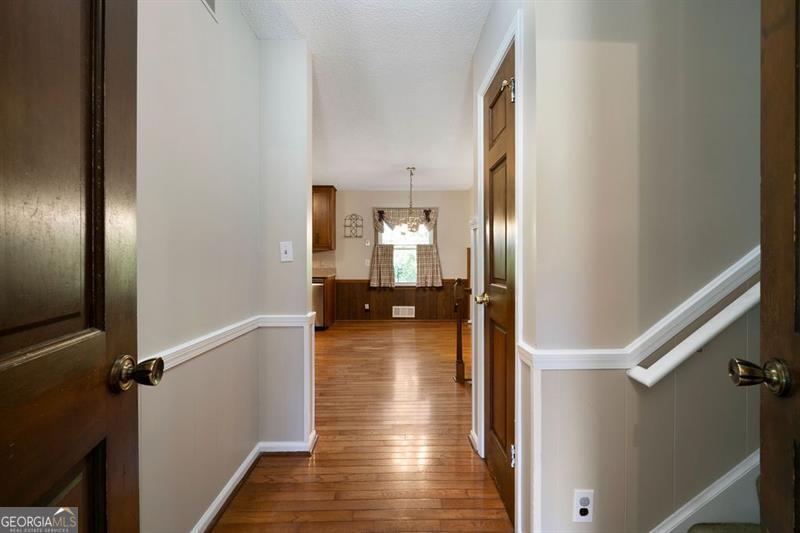
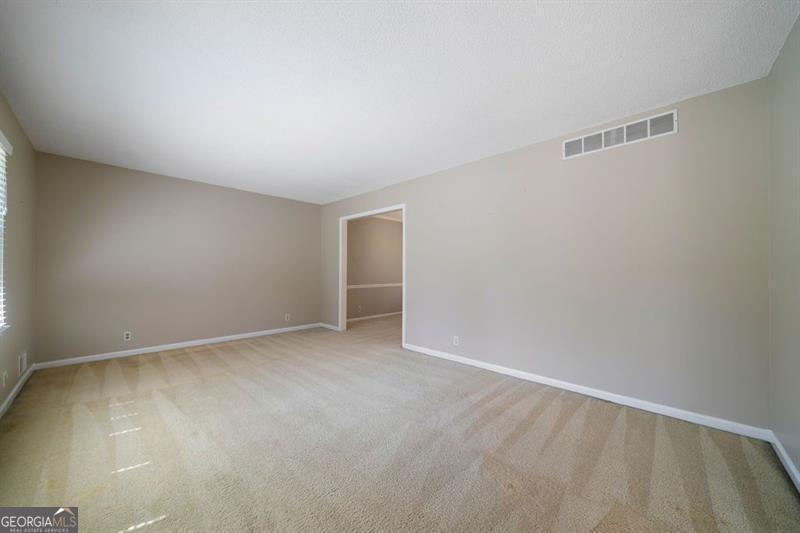
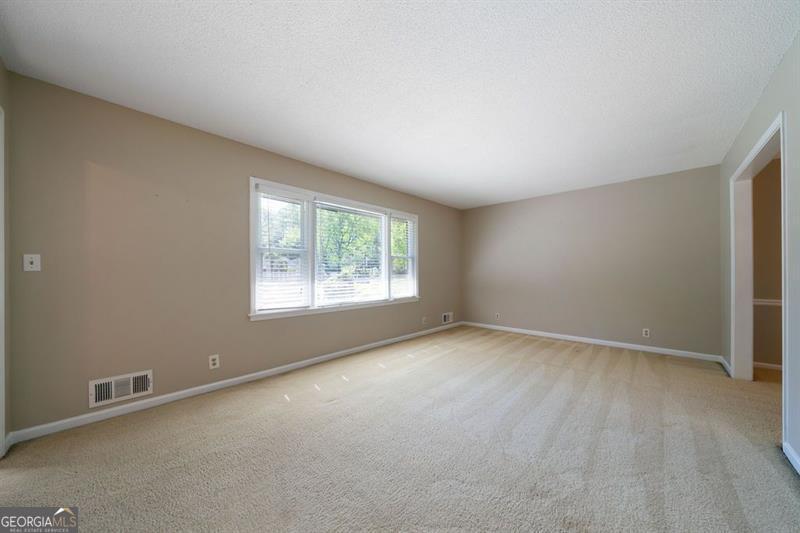
Time-Tested Charm Meets Modern Comfort in This 1973 Classic! Step into a groovy blast from the past-updated just enough to enjoy today's comforts while still honoring its original 1973 soul! Tucked into a beautifully landscaped lot bursting with flowering bushes and mature trees, this timeless two-story home is ready to write its next chapter with you. Inside, you'll find four generously sized upstairs bedrooms, including a primary suite that feels like a spa retreat-fully renovated with stylish, modern finishes that make it feel like you stepped into a design magazine and a second full bathroom! The main level is made for both memory-making and easy living, with a formal dining room for special occasions, a bright living room with large windows that bathe the space in natural light, and a cozy eat-in kitchen that overlooks one of the home's coolest vintage features: a sunken den straight out of a mid-century dream. Picture built-in bookshelves, a classic brick fireplace, and a nearby guest half-bath for convenience. Now, let's go back to this kitchen: Step into a kitchen that tells a story-with a perfect blend of timeless charm and thoughtful updates. The vintage wood cabinetry brings a sense of warmth and nostalgia, while the gleaming granite countertops and hand-inlaid ceramic tile backsplash add just the right touch of modern elegance. The hardwood floors shine with pride, reflecting years of care, and the rich, stained wood trim adds a cozy, grounded feel that today's homes often miss. This is more than a place to cook-it's a space that invites conversation, memory-making, and slow mornings with coffee and sunlight pouring through the windows. It's the kind of kitchen that feels like home the moment you walk in. Off the den, step into the sunny tiled sunroom with panoramic views of your lush backyard oasis. Slide open the door to discover a terra cotta patio-the perfect place for morning coffee or relaxing with a good book. But wait, there's more: The attached two-car garage sits just in front of the den, and the backyard boasts a second detached two-car garage, complete with a workshop and an upstairs loft-ideal for storage, hobbies, or that dream studio you've been wanting. This home offers the best of both worlds: nostalgic character and craftsmanship with a touch of modern updates, and outdoor beauty that just keeps blooming. What about the setting? Piedmont Hills is an iconic subdivision, located steps from the Bells Ferry Trail Head at Noonday Creek and a short drive to everything Barrett Pkwy has to offer. Come see this special gem before it's gone! PLEASE NOTE: This home is not updated to today's finishes except for the primary bathroom, so please expect vintage finishes and design. Home is being sold as-is. Home appraised in Oct 2024 for $450K as it sits.
Build Your Team
Quickly find investor-friendly professionals who can help you succeed in real estate investing at any stage of the investing journey.


Agents
Match with investor-friendly agents who can help you find, analyze, and close your next deal


Lenders
Get the best funding…find investor-friendly lenders who specialize in your deal strategy


Property Managers
Transition to passive investing. Find a trusted property management partnership that lasts.


Tax Pros & Accountants
Taxes and financial reporting made easy—find experts to create tax savings strategies, file taxes, and more
Location
Property Details
Parking
- Description: Mixed
- Details: Attached, Garage Door Opener, Garage, Detached
- Garage Spaces: 2
- Spaces Total: 2
Bedroom Information
- # of Bedrooms: 4
Bathroom Information
- # of Baths (Full): 2
- # of Baths (Partial): 1
- # of Baths (Total): 0.0
Interior Features
- # of Rooms: 8
- Basement: Yes
- Basement Description: Crawl Space
- Fireplace: Yes
Exterior Features
- Exterior Walls Materials: Brick
- Roof Material: Composition
Land Information
- Land Use: Residential
- Land Use Subtype: Single Family Residential
Lot Information
- Parcel ID: 16051100130
- Lot Size: 0 sqft
Property Information
- Property Type: Single Family Residence
- Style: Traditional
- Year Built: 1973
Tax Information
- Annual Tax: $735
Utilities
- Water & Sewer: Public
- Heating: Central, Natural Gas
- Cooling: Ceiling Fan(s), Central Air, Attic Fan
Location
- County: Cobb
Investment Summary
- Monthly Cash Flow
- -$700
- Cap Rate
- 4.3%
- Cash-on-Cash Return
- -8.6%
- Debt Coverage Ratio
- 0.69
- Internal Rate of Return (5 years)
- -4.3%
Cash Flow
Net Operating Income (NOI) minus mortgage payments.
Calculation:
NOI - Mortgage Payments
Cap Rate (Market Value)
Capitalization Rate is a rate of return that compares the yearly Net Operating Income (NOI) to the market value.
Calculation:
NOI / Market Value
Cash-on-Cash Return (CoC)
Annual Cash Flow / Cash Invested
Calculation:
Annual cash flow divided by initial cash invested.
Debt Coverage Ratio (DCR)
Net Operating Income (NOI) divided by total debt payments.
Calculation:
NOI / Total Debt Payments
Internal Rate of Return (IRR)
A metric for assessing profitability over time. IRR is the discount rate at which the net present value (NPV) of all future cash flows (positive and negative) from an investment equals zero — including both periodic cash flow (such as rent) and a projected sale at the end of the holding period. It represents the expected annualized return, accounting for income, expenses, and the recovery of capital through a future sale.
Purchase Details
Purchase PriceThe price paid for the property. Purchase price:
| $425,000 |
|---|---|
Amount FinancedThe amount of the purchase financed through a loan. Amount financed:
| -$340,000 |
Down paymentThe initial payment made towards the purchase. Down payment:
| $85,000 |
Closing CostsFees and expenses associated with purchasing a property, typically ranging from 2% to 5% of the home’s purchase price, paid at the end of a home purchase to cover services like lending, title transfer, and taxes. Closing costs:
| $12,750 |
Rehab CostsCosts incurred to repair or improve the property, including: roof, flooring, exterior siding, kitchen, exterior paint, bathrooms, etc. Rehab costs:
| $0 |
Initial Cash InvestedThe total initial cash invested in the property. Calculation:Down payment + Buying costs + Rehab costs Initial cash invested:
| $97,750 |
Square Feet (SQFT)The total square footage of the property. Square feet:
| 1,925 |
Cost Per Square FootCost per square foot of the property. Calculation:Purchase Price / Square Feet Cost per square foot:
| $221 |
Monthly Rent Per Square FootMonthly rent divided by the number of square feet. This ratio helps investors compare rental income efficiency across properties, markets, and unit sizes Calculation:Monthly Rent / Square Feet Monthly rent per square foot:
| $1.19 |
Financing Details
Loan AmountThe total sum of money borrowed from a lender to finance a property purchase. Calculation:Purchase Price - Down Payment
Loan amount:
| $340,000 |
|---|---|
Loan to Value Ratio (LTV)Loan amount divided by the market value of the property. Calculation:Loan Amount / Market Value
Loan to value ratio:
| 80.0% |
Loan TypeThe type of loan (e.g., fixed, adjustable).
Loan type:
| Amortizing |
TermThe loan repayment period in years.
Term:
| 30 years |
Interest RateThe percentage a lender charges on the borrowed amount of a loan, determining the cost of borrowing money.
Interest rate:
| 6.840% |
Principal & Interest (PI)The principal is the portion of the loan payment that reduces the loan balance. The interest is the lender's charge for borrowing money. Calculation:(P * r * (1 + r) ** n) / ((1 + r) ** n - 1) Where:
P = Loan amount (principal)
Principal & interest:
| $2,226 |
Property TaxesAnnual taxes levied by local governments on real estate properties. These taxes fund public services like schools, roads, and emergency services.
Property tax:
| $61 |
InsuranceThe costs for insurance coverage to protect against financial losses due to risks like fire, natural disasters, theft, liability, or tenant-related damages. Calculation:Assumes 7% of gross rental income, unless insurance rates are specified.
Insurance:
| $161 |
Private Mortgage Insurance (PMI)A fee that borrowers pay when they take out a conventional loan with a loan-to-value (LTV) ratio above 80%.
Private mortgage insurance (PMI):
| $0 |
Monthly PaymentThe fixed amount a borrower pays each month to repay a loan. It typically includes principal and interest (P&I) and may also cover property taxes, insurance, HOA fees, and PMI if escrowed. Monthly payment:
| $2,448 |
Operating Income
| % Rent | Monthly | Yearly | |
|---|---|---|---|
Gross RentThe total rental income received from tenants before deducting any expenses. Includes base rent, late fees, pet fees, parking fees, and other recurring charges.
Gross rent:
| $2,300 | $27,600 | |
Vacancy LossExpected loss of rent due to vacancies.
Vacancy loss:
(6%)
| 6% | -$138 | -$1,656 |
Operating IncomeGross rental income minus vacancy loss. Calculation:Gross rent - Vacancy loss
Operating income:
| $2,162 | $25,944 |
Operating Expenses
| % Rent | Monthly | Yearly | |
|---|---|---|---|
Property TaxesAnnual taxes levied by local governments on real estate properties. These taxes fund public services like schools, roads, and emergency services. | 3% | -$61 | -$735 |
InsuranceThe costs for insurance coverage to protect against financial losses due to risks like fire, natural disasters, theft, liability, or tenant-related damages. Calculation:Assumes 7% of gross rental income, unless insurance rates are specified. | 7% | -$161 | -$1,932 |
Property ManagementThe costs associated with hiring a property manager to handle the day-to-day operations of a rental property. Includes management fees, leasing fes, eviction fees, etc. Calculation:Assumes 8% of gross rental income. | 8% | -$184 | -$2,208 |
Repairs & MaintenanceOngoing costs for routine upkeep and minor fixes needed to keep a property in good working condition. Calculation:Assumes 5% of gross rental income. Varies by property age and condition. | 5% | -$115 | -$1,380 |
Capital ExpensesLarge, infrequent costs for major improvements or replacements, like a new roof, HVAC system, or appliances. Calculation:Assumes 5% of gross rental income. Varies by property age. | 5% | -$115 | -$1,380 |
HOA FeesRegular dues paid to a Homeowners Association for community maintenance, amenities, and management. Similar fees include: Condo Association Fees, Co-op Maintenance Fees, etc. | n/a | n/a | n/a |
Operating ExpensesRecurring costs required to maintain and manage a rental property, including property taxes, insurance, maintenance, repairs, utilities (if paid by the owner), property management fees, and other day-to-day expenses. Calculation:Insurance + Property Taxes + Property Management + Repairs & Maintenance + Capital Expenditures + HOA Fees | 28% | -$636 | -$7,635 |
Cash Flow
| Monthly | Yearly | |
|---|---|---|
Net Operating Income (NOI)The income generated from a property after deducting all operating expenses but before deducting mortgage payments, taxes, and capital expenditures. Calculation:Gross Operating Income - Operating Expenses
Net operating income:
| $1,526 | $18,312 |
Mortgage PaymentThe fixed amount a borrower pays each month to repay a loan. It typically includes principal and interest (P&I) and may also cover property taxes, insurance, HOA fees, and PMI if escrowed. | -$2,226 | -$26,712 |
Cash FlowNet Operating Income (NOI) minus mortgage payments. Calculation:NOI - Mortgage Payments | $700 | $8,400 |