$999,999
Investment Summary
- Monthly Cash Flow
- -$2,884
- Cap Rate
- 2.7%
- Cash-on-Cash Return
- -15.0%
- Debt Coverage Ratio
- 0.44
- Internal Rate of Return (5 years)
- -10.6%
Cash Flow
Net Operating Income (NOI) minus mortgage payments.
Calculation:
NOI - Mortgage Payments
Cap Rate (Market Value)
Capitalization Rate is a rate of return that compares the yearly Net Operating Income (NOI) to the market value.
Calculation:
NOI / Market Value
Cash-on-Cash Return (CoC)
Annual Cash Flow / Cash Invested
Calculation:
Annual cash flow divided by initial cash invested.
Debt Coverage Ratio (DCR)
Net Operating Income (NOI) divided by total debt payments.
Calculation:
NOI / Total Debt Payments
Internal Rate of Return (IRR)
A metric for assessing profitability over time. IRR is the discount rate at which the net present value (NPV) of all future cash flows (positive and negative) from an investment equals zero — including both periodic cash flow (such as rent) and a projected sale at the end of the holding period. It represents the expected annualized return, accounting for income, expenses, and the recovery of capital through a future sale.
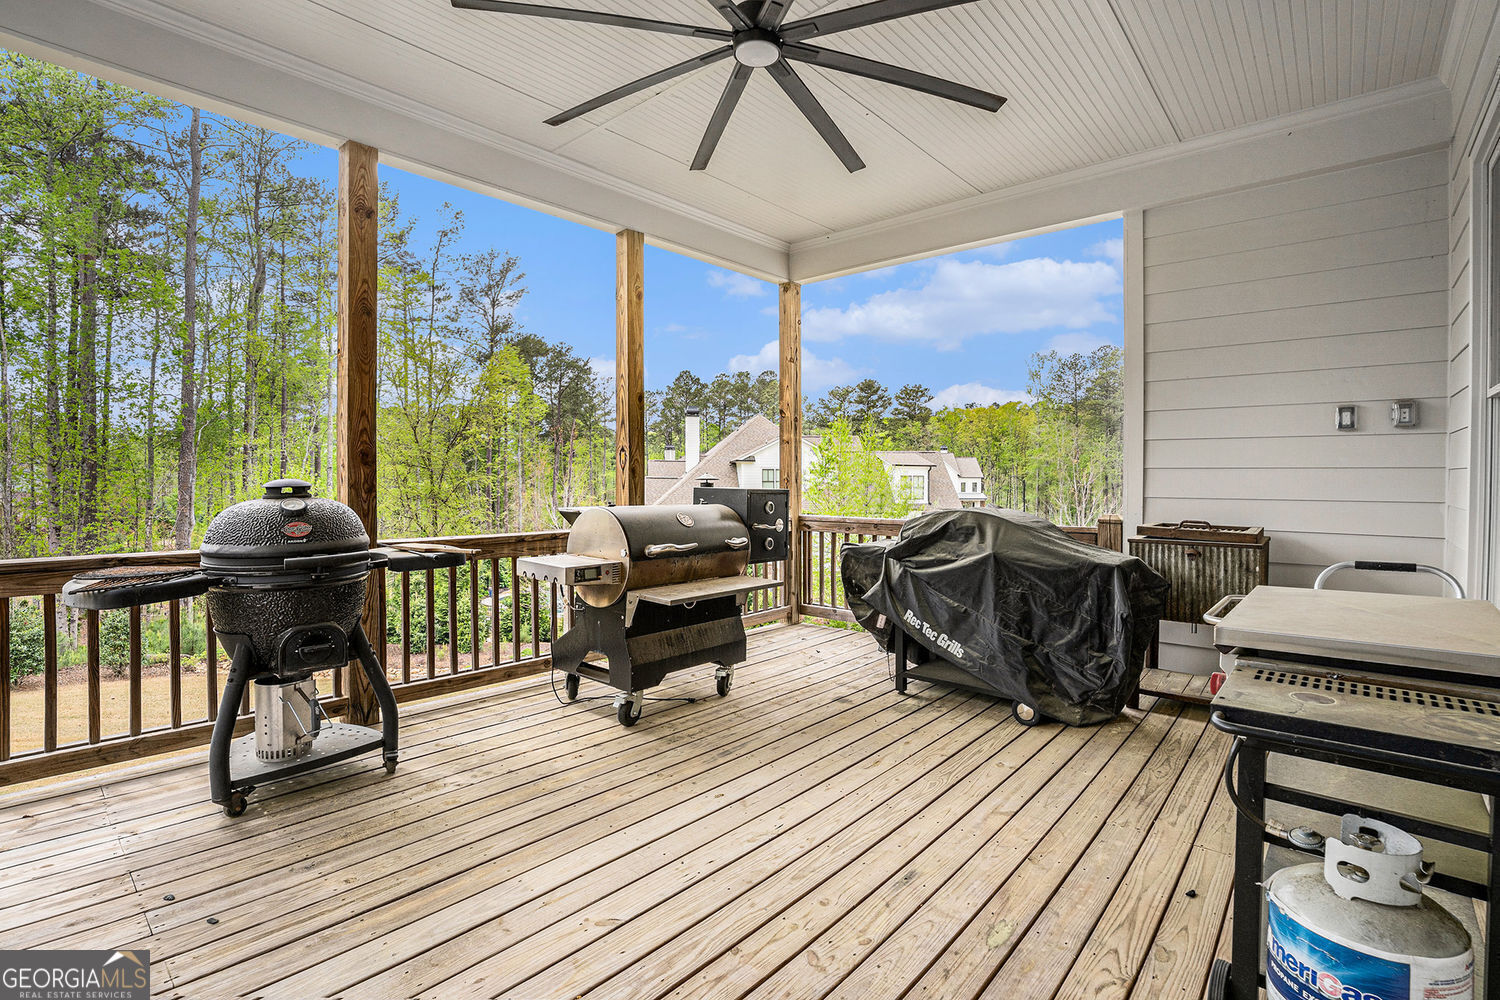
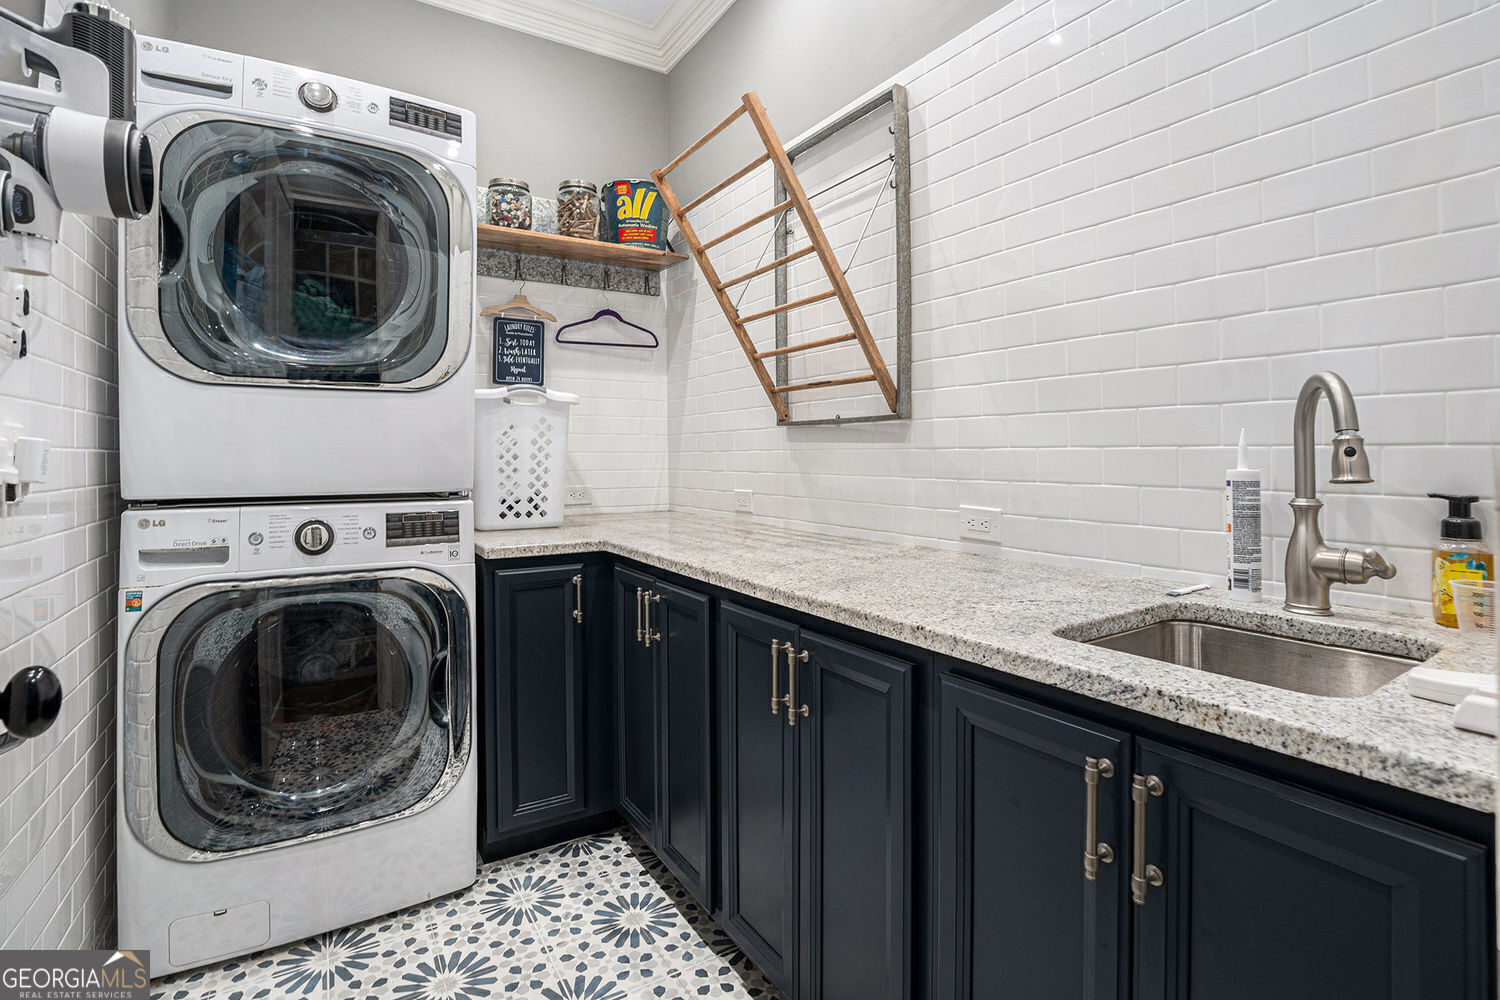
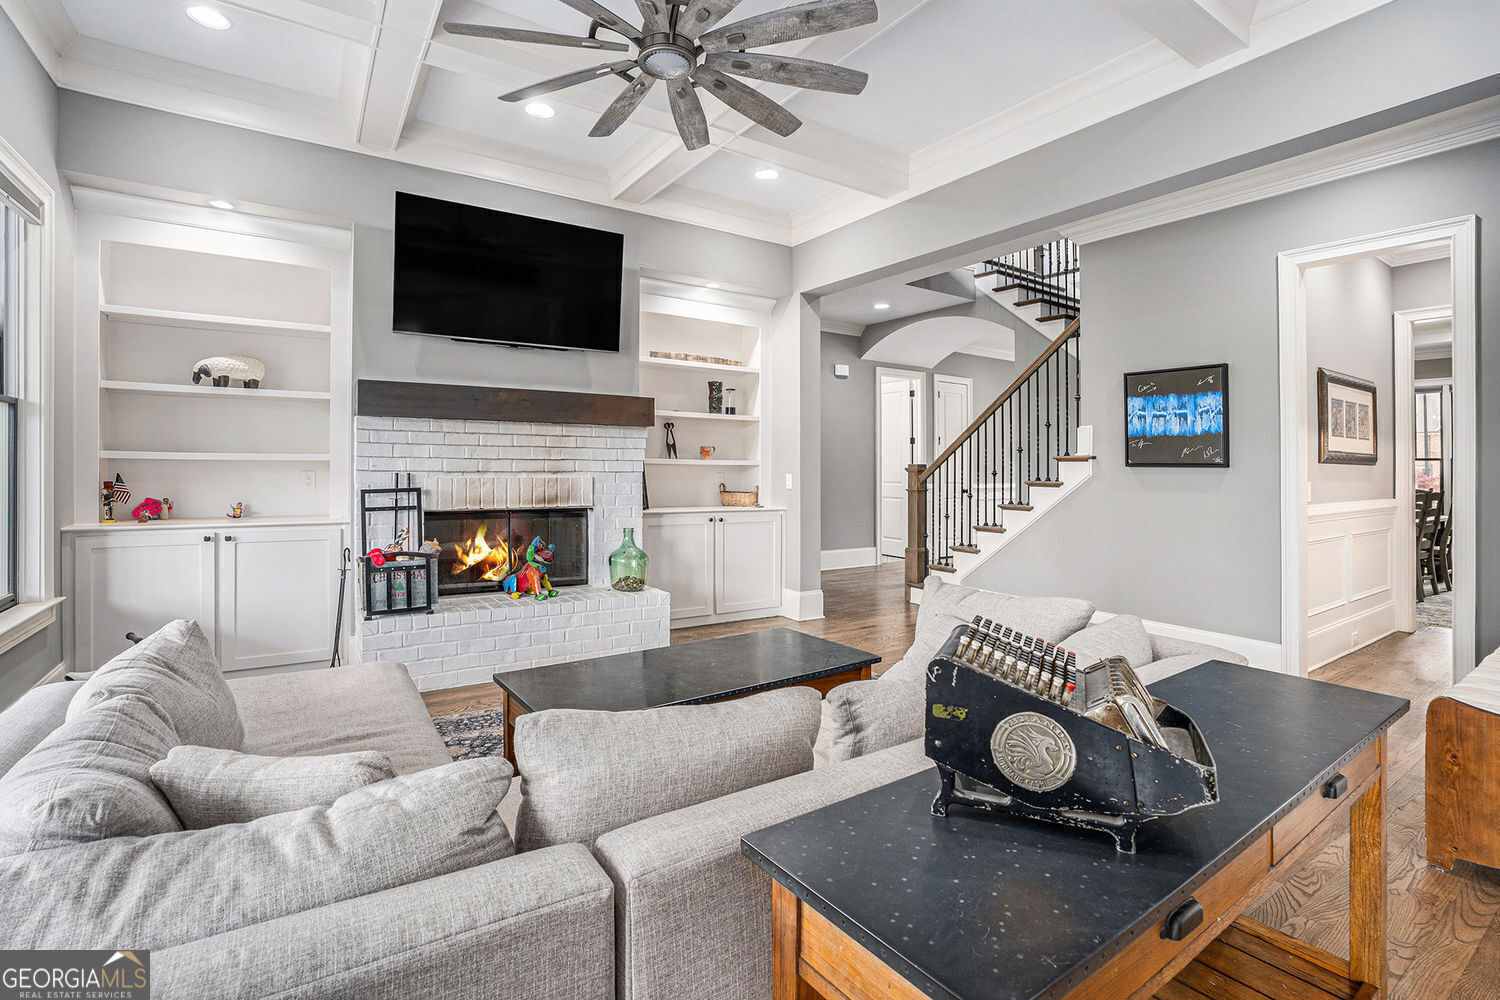
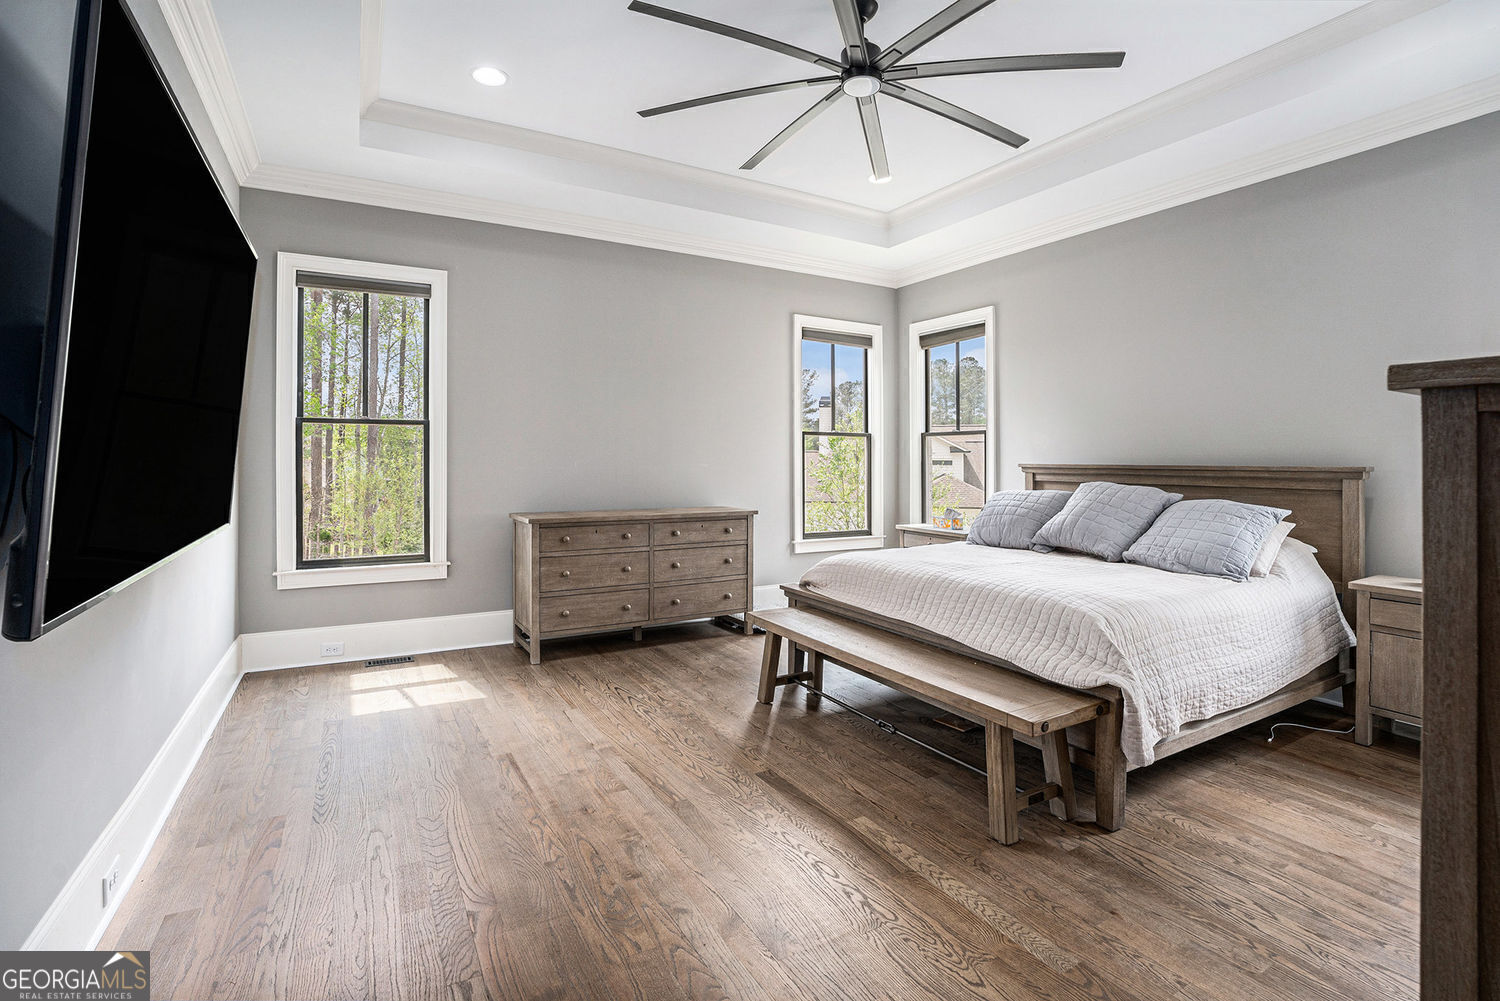
Property Description
Absolutely stunning custom estate in beautiful Acworth! We present this 5 bed, 5.5 bath, 2 story home including a walkout finished basement with executive second kitchen! As you enter through the double front doors from the grand flagstone covered porch, you'll find yourself in the great hall. As you journey through the home from here you have access to a front sitting room, formal dining room, half bath, and the master en-suite. Connecting the formal dining room to the open concept kitchen/family room area is a butler's pantry with sink, storage, and space for a wine fridge. The gourmet kitchen includes a built-in 5 burner gas stove with pot filling faucet, double wall ovens, walk in pantry, all wrapped around a central eat-at island. From one side of the kitchen is the spacious laundry room, access to the 3 car garage and mudroom for coat and shoe storage. The opposite side has a breakfast nook and access to the covered deck to enjoy your relaxing morning coffee or tea. The Kitchen then flows into the family room with it's high coffered ceilings, and 42" wood burning fireplace flanked by built-in bookshelves and cabinetries. The master suite is the only bedroom on the main floor so you can enjoy a peaceful soak in the freestanding tub or a steam in the oversized tile shower with built-in bench. You can get ready for your day in the walk-in closet with plenty of custom storage for your clothing, shoes, and accessories. As you ascend the central staircase you'll find four well appointed bedrooms, two with private full baths and two with a joining full bath. There is a landing area perfect as a sitting/reading or holiday display area. Also included upstairs is a living/office space with custom cabinetry, shelving, desk, and space for a mini fridge with bar. When you descend to the beautifully finished basement you'll be delighted with the executive second kitchen! Ready for entertaining, cooking, or crafting to your heart's content. The adjoining covered patio area has a natural gas outlet so your grilling adventures will never be interrupted! Just off the kitchen is a theater/media room perfect for movie night or watching the big game. The basement continues with a large living area with windows to the backyard and yet another built in bar/coffee station. A full bath and over 600 sq/ft of workshop, full data wiring for the entire home, and storage space completes the lower level. Every inch of this home is thoughtfully and meticulously clad in the finest finishings. From the beautiful wood, tile, and carpeted flooring, every counter space covered in marble, quartz, or granite, the vaulted, trey, and coffered ceilings, and the floor to ceiling custom mouldings, it's waiting to be seen to properly experience everything this dream home has to offer!
Build Your Team
Quickly find investor-friendly professionals who can help you succeed in real estate investing at any stage of the investing journey.


Agents
Match with investor-friendly agents who can help you find, analyze, and close your next deal


Lenders
Get the best funding…find investor-friendly lenders who specialize in your deal strategy


Property Managers
Transition to passive investing. Find a trusted property management partnership that lasts.


Tax Pros & Accountants
Taxes and financial reporting made easy—find experts to create tax savings strategies, file taxes, and more
Location
Property Details
Parking
- Description: Garage, Garage Door Opener, Garage Faces Side, Kitchen Level, Level Driveway
- Details: Attached, Garage Door Opener, Garage, Off Street, Storage
- Garage Spaces: 6
- Spaces Total: 6
Bedroom Information
- # of Bedrooms: 5
Bathroom Information
- # of Baths (Full): 5
- # of Baths (Total): 5.5
Interior Features
- # of Rooms: 10
- # of Stories: 2
- Basement: Yes
- Basement Description: Daylight, Finished, Full, Exterior Entry, Interior Entry
- Fireplace: Yes
Exterior Features
- Exterior Walls Materials: Brick
- Foundation: Slab
- Roof Material: Composition
HOA
- Has HOA: Yes
- HOA Fee: $650/annually
Land Information
- Land Use: Residential
- Land Use Subtype: Single Family Residential
Lot Information
- Parcel ID: 20011800670
- Lot Size: 0 sqft
Property Information
- Property Type: Single Family Residence
- Style: Contemporary
- Year Built: 2018
Tax Information
- Annual Tax: $10,578
Utilities
- Water & Sewer: Public
- Heating: Central
- Cooling: Central Air
Location
- County: Cobb
Listing Details
Investment Summary
- Monthly Cash Flow
- -$2,884
- Cap Rate
- 2.7%
- Cash-on-Cash Return
- -15.0%
- Debt Coverage Ratio
- 0.44
- Internal Rate of Return (5 years)
- -10.6%
Cash Flow
Net Operating Income (NOI) minus mortgage payments.
Calculation:
NOI - Mortgage Payments
Cap Rate (Market Value)
Capitalization Rate is a rate of return that compares the yearly Net Operating Income (NOI) to the market value.
Calculation:
NOI / Market Value
Cash-on-Cash Return (CoC)
Annual Cash Flow / Cash Invested
Calculation:
Annual cash flow divided by initial cash invested.
Debt Coverage Ratio (DCR)
Net Operating Income (NOI) divided by total debt payments.
Calculation:
NOI / Total Debt Payments
Internal Rate of Return (IRR)
A metric for assessing profitability over time. IRR is the discount rate at which the net present value (NPV) of all future cash flows (positive and negative) from an investment equals zero — including both periodic cash flow (such as rent) and a projected sale at the end of the holding period. It represents the expected annualized return, accounting for income, expenses, and the recovery of capital through a future sale.
Purchase Details
Purchase PriceThe price paid for the property. Purchase price:
| $999,999 |
|---|---|
Amount FinancedThe amount of the purchase financed through a loan. Amount financed:
| -$799,999 |
Down paymentThe initial payment made towards the purchase. Down payment:
| $200,000 |
Closing CostsFees and expenses associated with purchasing a property, typically ranging from 2% to 5% of the home’s purchase price, paid at the end of a home purchase to cover services like lending, title transfer, and taxes. Closing costs:
| $30,000 |
Rehab CostsCosts incurred to repair or improve the property, including: roof, flooring, exterior siding, kitchen, exterior paint, bathrooms, etc. Rehab costs:
| $0 |
Initial Cash InvestedThe total initial cash invested in the property. Calculation:Down payment + Buying costs + Rehab costs Initial cash invested:
| $230,000 |
Square Feet (SQFT)The total square footage of the property. Square feet:
| 5,536 |
Cost Per Square FootCost per square foot of the property. Calculation:Purchase Price / Square Feet Cost per square foot:
| $181 |
Monthly Rent Per Square FootMonthly rent divided by the number of square feet. This ratio helps investors compare rental income efficiency across properties, markets, and unit sizes Calculation:Monthly Rent / Square Feet Monthly rent per square foot:
| $0.83 |
Financing Details
Loan AmountThe total sum of money borrowed from a lender to finance a property purchase. Calculation:Purchase Price - Down Payment
Loan amount:
| $799,999 |
|---|---|
Loan to Value Ratio (LTV)Loan amount divided by the market value of the property. Calculation:Loan Amount / Market Value
Loan to value ratio:
| 80.0% |
Loan TypeThe type of loan (e.g., fixed, adjustable).
Loan type:
| Amortizing |
TermThe loan repayment period in years.
Term:
| 30 years |
Interest RateThe percentage a lender charges on the borrowed amount of a loan, determining the cost of borrowing money.
Interest rate:
| 6.625% |
Principal & Interest (PI)The principal is the portion of the loan payment that reduces the loan balance. The interest is the lender's charge for borrowing money. Calculation:(P * r * (1 + r) ** n) / ((1 + r) ** n - 1) Where:
P = Loan amount (principal)
Principal & interest:
| $5,122 |
Property TaxesAnnual taxes levied by local governments on real estate properties. These taxes fund public services like schools, roads, and emergency services.
Property tax:
| $882 |
InsuranceThe costs for insurance coverage to protect against financial losses due to risks like fire, natural disasters, theft, liability, or tenant-related damages. Calculation:Assumes 7% of gross rental income, unless insurance rates are specified.
Insurance:
| $322 |
Private Mortgage Insurance (PMI)A fee that borrowers pay when they take out a conventional loan with a loan-to-value (LTV) ratio above 80%.
Private mortgage insurance (PMI):
| $0 |
Monthly PaymentThe fixed amount a borrower pays each month to repay a loan. It typically includes principal and interest (P&I) and may also cover property taxes, insurance, HOA fees, and PMI if escrowed. Monthly payment:
| $6,326 |
Operating Income
| % Rent | Monthly | Yearly | |
|---|---|---|---|
Gross RentThe total rental income received from tenants before deducting any expenses. Includes base rent, late fees, pet fees, parking fees, and other recurring charges.
Gross rent:
| $4,600 | $55,200 | |
Vacancy LossExpected loss of rent due to vacancies.
Vacancy loss:
(6%)
| 6% | -$276 | -$3,312 |
Operating IncomeGross rental income minus vacancy loss. Calculation:Gross rent - Vacancy loss
Operating income:
| $4,324 | $51,888 |
Operating Expenses
| % Rent | Monthly | Yearly | |
|---|---|---|---|
Property TaxesAnnual taxes levied by local governments on real estate properties. These taxes fund public services like schools, roads, and emergency services. | 19% | -$882 | -$10,578 |
InsuranceThe costs for insurance coverage to protect against financial losses due to risks like fire, natural disasters, theft, liability, or tenant-related damages. Calculation:Assumes 7% of gross rental income, unless insurance rates are specified. | 7% | -$322 | -$3,864 |
Property ManagementThe costs associated with hiring a property manager to handle the day-to-day operations of a rental property. Includes management fees, leasing fes, eviction fees, etc. Calculation:Assumes 8% of gross rental income. | 8% | -$368 | -$4,416 |
Repairs & MaintenanceOngoing costs for routine upkeep and minor fixes needed to keep a property in good working condition. Calculation:Assumes 5% of gross rental income. Varies by property age and condition. | 5% | -$230 | -$2,760 |
Capital ExpensesLarge, infrequent costs for major improvements or replacements, like a new roof, HVAC system, or appliances. Calculation:Assumes 5% of gross rental income. Varies by property age. | 5% | -$230 | -$2,760 |
HOA FeesRegular dues paid to a Homeowners Association for community maintenance, amenities, and management. Similar fees include: Condo Association Fees, Co-op Maintenance Fees, etc. | 1% | -$54 | -$648 |
Operating ExpensesRecurring costs required to maintain and manage a rental property, including property taxes, insurance, maintenance, repairs, utilities (if paid by the owner), property management fees, and other day-to-day expenses. Calculation:Insurance + Property Taxes + Property Management + Repairs & Maintenance + Capital Expenditures + HOA Fees | 45% | -$2,086 | -$25,026 |
Cash Flow
| Monthly | Yearly | |
|---|---|---|
Net Operating Income (NOI)The income generated from a property after deducting all operating expenses but before deducting mortgage payments, taxes, and capital expenditures. Calculation:Gross Operating Income - Operating Expenses
Net operating income:
| $2,238 | $26,856 |
Mortgage PaymentThe fixed amount a borrower pays each month to repay a loan. It typically includes principal and interest (P&I) and may also cover property taxes, insurance, HOA fees, and PMI if escrowed. | -$5,122 | -$61,464 |
Cash FlowNet Operating Income (NOI) minus mortgage payments. Calculation:NOI - Mortgage Payments | -$2,884 | -$34,608 |