
$750,000
Investment Summary
- Monthly Cash Flow
- -$1,285
- Cap Rate
- 3.6%
- Cash-on-Cash Return
- -8.9%
- Debt Coverage Ratio
- 0.64
- Internal Rate of Return (5 years)
- -4.7%
Cash Flow
Net Operating Income (NOI) minus mortgage payments.
Calculation:
NOI - Mortgage Payments
Cap Rate (Market Value)
Capitalization Rate is a rate of return that compares the yearly Net Operating Income (NOI) to the market value.
Calculation:
NOI / Market Value
Cash-on-Cash Return (CoC)
Annual Cash Flow / Cash Invested
Calculation:
Annual cash flow divided by initial cash invested.
Debt Coverage Ratio (DCR)
Net Operating Income (NOI) divided by total debt payments.
Calculation:
NOI / Total Debt Payments
Internal Rate of Return (IRR)
A metric for assessing profitability over time. IRR is the discount rate at which the net present value (NPV) of all future cash flows (positive and negative) from an investment equals zero — including both periodic cash flow (such as rent) and a projected sale at the end of the holding period. It represents the expected annualized return, accounting for income, expenses, and the recovery of capital through a future sale.
Property Description
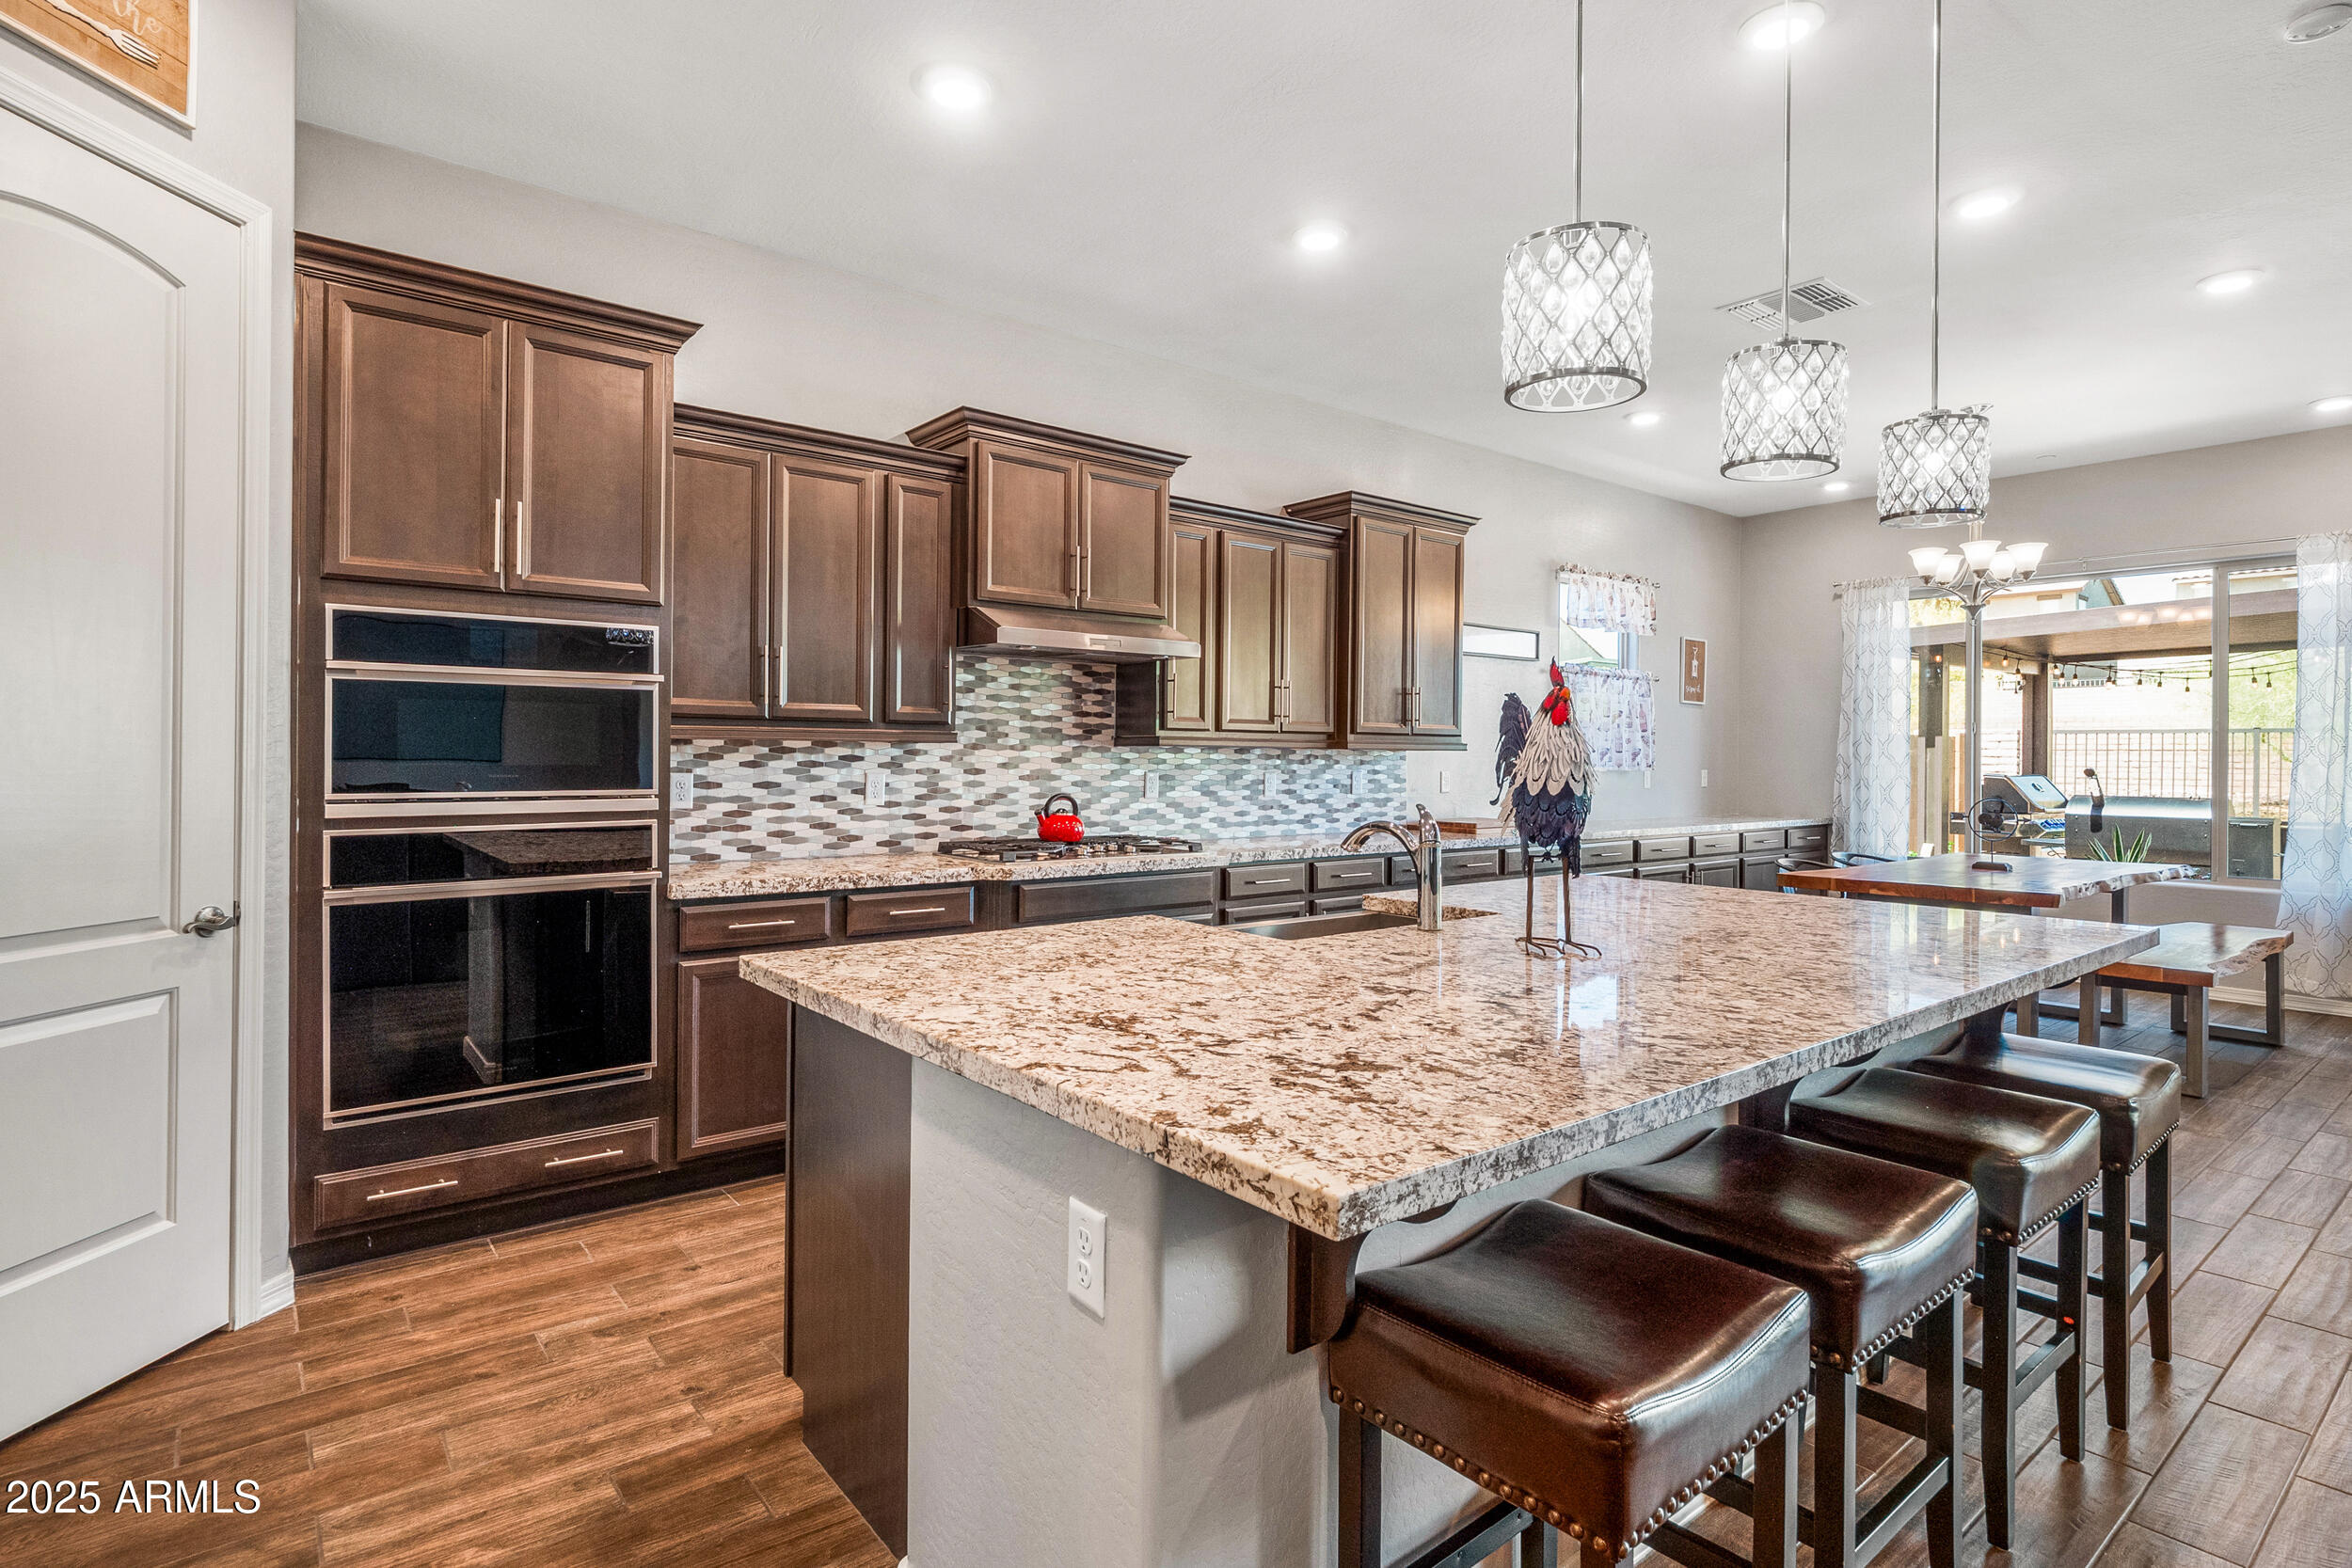
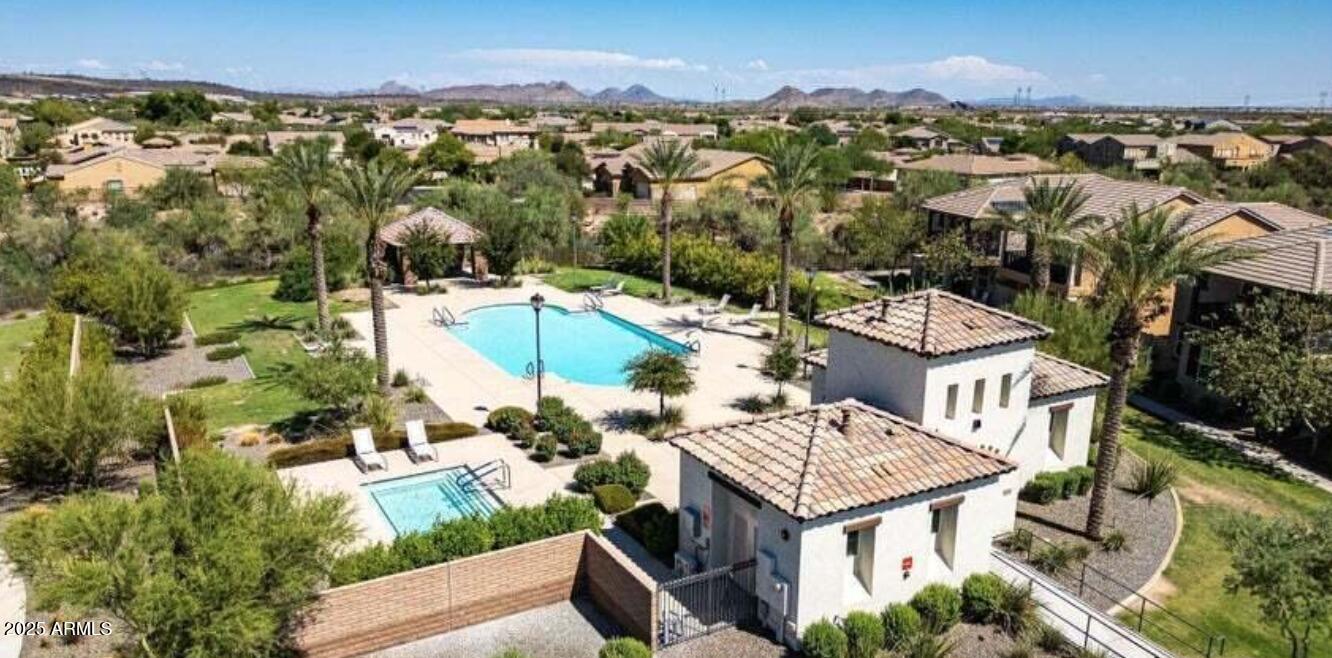
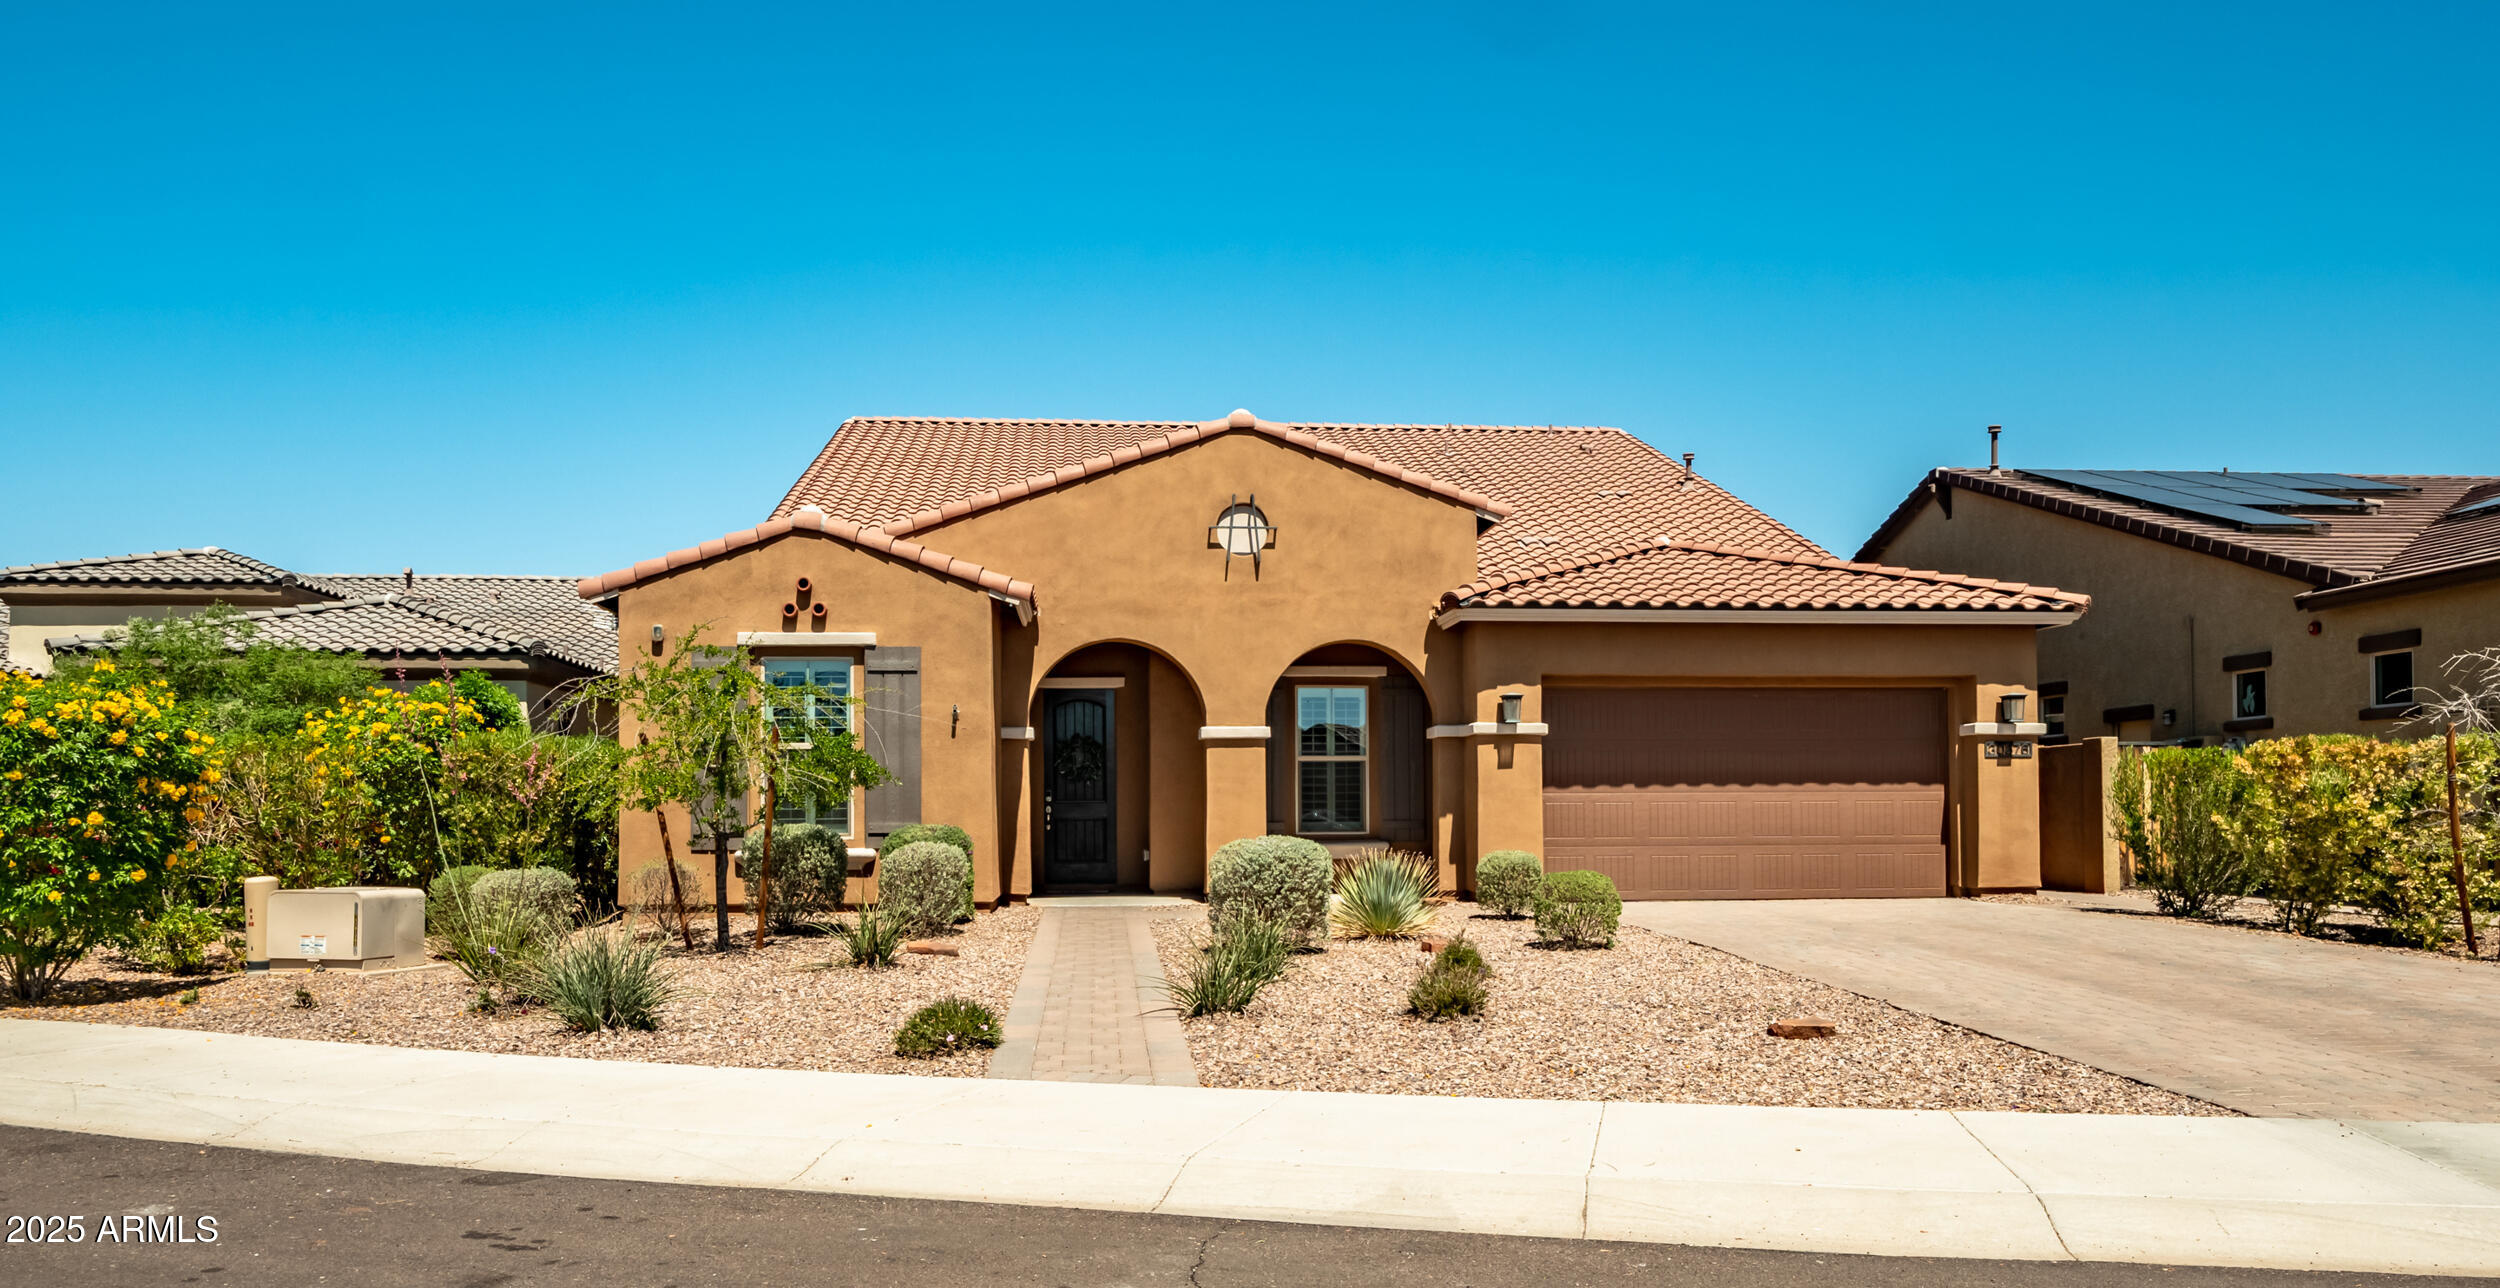
2.25% INTEREST RATE AVAILABLE!! Imagine waking up each morning in your dream home, nestled in the vibrant Vistancia community. This stunning 4,200 sq ft residence, located just minutes from the 303 freeway, invites you to embrace a lifestyle of luxury and ease in an exclusive enclave of only 36 unique homesites. Picture yourself sipping coffee on your covered paver patio, the morning sun casting a warm glow over your beautifully landscaped backyard. The tranquil desert landscape stretches before you, framed by a charming gazebo perfect for evening barbecues, a cozy fire pit for storytelling under the stars, and a soothing hot tub where you unwind after a fulfilling day. Start your weekend at the 15,000 sq ft Mountain Vista Club, just a short stroll away. Dive into one of 3 sparkling pools or cheer on your kids as they race down the waterslides at the aquatic park. Join friends for a lively pickleball match on the courts or challenge a neighbor to a tennis game on one of the 4 lighted courts. The indoor basketball gym buzzes with energy, while the movement studio offers a calming space for yoga or dance classes. The game lawn, alive with year-round community events, becomes the backdrop for new friendships and cherished memories. Midweek, you explore the Foothills Center, a 6 acre haven where you swim laps in the 6 lane pool or enjoy a picnic under the ramadas with your family. The kids laugh and play on the playground, while you take a refreshing jog along the 3.5-mile trail, surrounded by Vistancia's natural beauty. This community isn't just a place to live; it's a place to thrive, with activities that bring neighbors together and create a true sense of belonging. Inside your home, life feels equally extraordinary. The gourmet kitchen, with its gas cooktop, built-in wall oven, and ample cabinetry, becomes the heart of your gatherings, where friends and family linger over home-cooked meals and laughter. Your downstairs master suite is a luxurious retreat, complete with a spacious walk-in shower, dual vanities, and a large walk-in closet connected to the laundry room for effortless convenience. A separate guest suite welcomes visitors, while a dedicated study offers a quiet space for work or creativity. Upstairs, a vast bonus room with a private balcony is your go-to spot for movie nights or quiet reflection, flanked by 2 additional bedrooms and a shared bath, perfect for family or guests. With 2 HVAC units and 4 zones, comfort is assured year-round. Your life in Vistancia is one of balance: vibrant community connections, endless recreational opportunities, and a home that feels like a sanctuary. From spontaneous gatherings at the recreation centers to tranquil evenings in your backyard, this is where your story unfolds, filled with moments that make every day unforgettable.
Build Your Team
Quickly find investor-friendly professionals who can help you succeed in real estate investing at any stage of the investing journey.


Agents
Match with investor-friendly agents who can help you find, analyze, and close your next deal


Lenders
Get the best funding…find investor-friendly lenders who specialize in your deal strategy


Property Managers
Transition to passive investing. Find a trusted property management partnership that lasts.


Tax Pros & Accountants
Taxes and financial reporting made easy—find experts to create tax savings strategies, file taxes, and more
Location
Property Details
Parking
- Description: Covered, Garage
- Details: Direct Access
- Garage Spaces: 3
- Spaces Total: 2
Bedroom Information
- # of Bedrooms: 5
Bathroom Information
- # of Baths (Total): 4.0
Interior Features
- # of Stories: 2
Exterior Features
- Exterior Walls Materials: Stucco
- Roof Material: Tile
HOA
- Has HOA: Yes
- Association: Vistancia Village
- HOA Fee: $352/quarterly
Land Information
- Land Use: Residential
- Land Use Subtype: Single Family Residential
Lot Information
- Parcel ID: 51008903
- Lot Size: 8451 sqft
Property Information
- Property Type: Single Family Residence
- Style: Santa Barbara/Tuscan, Territorial/Santa Fe
- Year Built: 2020
Tax Information
- Annual Tax: $3,724
Utilities
- Water & Sewer: Public
- Heating: Natural Gas
- Cooling: Central Air, Ceiling Fan(s)
Location
- County: Maricopa
Listing Details
Investment Summary
- Monthly Cash Flow
- -$1,285
- Cap Rate
- 3.6%
- Cash-on-Cash Return
- -8.9%
- Debt Coverage Ratio
- 0.64
- Internal Rate of Return (5 years)
- -4.7%
Cash Flow
Net Operating Income (NOI) minus mortgage payments.
Calculation:
NOI - Mortgage Payments
Cap Rate (Market Value)
Capitalization Rate is a rate of return that compares the yearly Net Operating Income (NOI) to the market value.
Calculation:
NOI / Market Value
Cash-on-Cash Return (CoC)
Annual Cash Flow / Cash Invested
Calculation:
Annual cash flow divided by initial cash invested.
Debt Coverage Ratio (DCR)
Net Operating Income (NOI) divided by total debt payments.
Calculation:
NOI / Total Debt Payments
Internal Rate of Return (IRR)
A metric for assessing profitability over time. IRR is the discount rate at which the net present value (NPV) of all future cash flows (positive and negative) from an investment equals zero — including both periodic cash flow (such as rent) and a projected sale at the end of the holding period. It represents the expected annualized return, accounting for income, expenses, and the recovery of capital through a future sale.
Purchase Details
Purchase PriceThe price paid for the property. Purchase price:
| $750,000 |
|---|---|
Amount FinancedThe amount of the purchase financed through a loan. Amount financed:
| -$600,000 |
Down paymentThe initial payment made towards the purchase. Down payment:
| $150,000 |
Closing CostsFees and expenses associated with purchasing a property, typically ranging from 2% to 5% of the home’s purchase price, paid at the end of a home purchase to cover services like lending, title transfer, and taxes. Closing costs:
| $22,500 |
Rehab CostsCosts incurred to repair or improve the property, including: roof, flooring, exterior siding, kitchen, exterior paint, bathrooms, etc. Rehab costs:
| $0 |
Initial Cash InvestedThe total initial cash invested in the property. Calculation:Down payment + Buying costs + Rehab costs Initial cash invested:
| $172,500 |
Square Feet (SQFT)The total square footage of the property. Square feet:
| 4,209 |
Cost Per Square FootCost per square foot of the property. Calculation:Purchase Price / Square Feet Cost per square foot:
| $178 |
Monthly Rent Per Square FootMonthly rent divided by the number of square feet. This ratio helps investors compare rental income efficiency across properties, markets, and unit sizes Calculation:Monthly Rent / Square Feet Monthly rent per square foot:
| $0.93 |
Financing Details
Loan AmountThe total sum of money borrowed from a lender to finance a property purchase. Calculation:Purchase Price - Down Payment
Loan amount:
| $600,000 |
|---|---|
Loan to Value Ratio (LTV)Loan amount divided by the market value of the property. Calculation:Loan Amount / Market Value
Loan to value ratio:
| 80.0% |
Loan TypeThe type of loan (e.g., fixed, adjustable).
Loan type:
| Amortizing |
TermThe loan repayment period in years.
Term:
| 30 years |
Interest RateThe percentage a lender charges on the borrowed amount of a loan, determining the cost of borrowing money.
Interest rate:
| 5.875% |
Principal & Interest (PI)The principal is the portion of the loan payment that reduces the loan balance. The interest is the lender's charge for borrowing money. Calculation:(P * r * (1 + r) ** n) / ((1 + r) ** n - 1) Where:
P = Loan amount (principal)
Principal & interest:
| $3,549 |
Property TaxesAnnual taxes levied by local governments on real estate properties. These taxes fund public services like schools, roads, and emergency services.
Property tax:
| $310 |
InsuranceThe costs for insurance coverage to protect against financial losses due to risks like fire, natural disasters, theft, liability, or tenant-related damages. Calculation:Assumes 7% of gross rental income, unless insurance rates are specified.
Insurance:
| $273 |
Private Mortgage Insurance (PMI)A fee that borrowers pay when they take out a conventional loan with a loan-to-value (LTV) ratio above 80%.
Private mortgage insurance (PMI):
| $0 |
Monthly PaymentThe fixed amount a borrower pays each month to repay a loan. It typically includes principal and interest (P&I) and may also cover property taxes, insurance, HOA fees, and PMI if escrowed. Monthly payment:
| $4,132 |
Operating Income
| % Rent | Monthly | Yearly | |
|---|---|---|---|
Gross RentThe total rental income received from tenants before deducting any expenses. Includes base rent, late fees, pet fees, parking fees, and other recurring charges.
Gross rent:
| $3,900 | $46,800 | |
Vacancy LossExpected loss of rent due to vacancies.
Vacancy loss:
(6%)
| 6% | -$234 | -$2,808 |
Operating IncomeGross rental income minus vacancy loss. Calculation:Gross rent - Vacancy loss
Operating income:
| $3,666 | $43,992 |
Operating Expenses
| % Rent | Monthly | Yearly | |
|---|---|---|---|
Property TaxesAnnual taxes levied by local governments on real estate properties. These taxes fund public services like schools, roads, and emergency services. | 8% | -$310 | -$3,724 |
InsuranceThe costs for insurance coverage to protect against financial losses due to risks like fire, natural disasters, theft, liability, or tenant-related damages. Calculation:Assumes 7% of gross rental income, unless insurance rates are specified. | 7% | -$273 | -$3,276 |
Property ManagementThe costs associated with hiring a property manager to handle the day-to-day operations of a rental property. Includes management fees, leasing fes, eviction fees, etc. Calculation:Assumes 8% of gross rental income. | 8% | -$312 | -$3,744 |
Repairs & MaintenanceOngoing costs for routine upkeep and minor fixes needed to keep a property in good working condition. Calculation:Assumes 5% of gross rental income. Varies by property age and condition. | 5% | -$195 | -$2,340 |
Capital ExpensesLarge, infrequent costs for major improvements or replacements, like a new roof, HVAC system, or appliances. Calculation:Assumes 5% of gross rental income. Varies by property age. | 5% | -$195 | -$2,340 |
HOA FeesRegular dues paid to a Homeowners Association for community maintenance, amenities, and management. Similar fees include: Condo Association Fees, Co-op Maintenance Fees, etc. | 3% | -$117 | -$1,404 |
Operating ExpensesRecurring costs required to maintain and manage a rental property, including property taxes, insurance, maintenance, repairs, utilities (if paid by the owner), property management fees, and other day-to-day expenses. Calculation:Insurance + Property Taxes + Property Management + Repairs & Maintenance + Capital Expenditures + HOA Fees | 36% | -$1,402 | -$16,828 |
Cash Flow
| Monthly | Yearly | |
|---|---|---|
Net Operating Income (NOI)The income generated from a property after deducting all operating expenses but before deducting mortgage payments, taxes, and capital expenditures. Calculation:Gross Operating Income - Operating Expenses
Net operating income:
| $2,264 | $27,168 |
Mortgage PaymentThe fixed amount a borrower pays each month to repay a loan. It typically includes principal and interest (P&I) and may also cover property taxes, insurance, HOA fees, and PMI if escrowed. | -$3,549 | -$42,588 |
Cash FlowNet Operating Income (NOI) minus mortgage payments. Calculation:NOI - Mortgage Payments | -$1,285 | -$15,420 |