
$1,490,000
Investment Summary
- Monthly Cash Flow
- -$6,490
- Cap Rate
- 0.9%
- Cash-on-Cash Return
- -22.7%
- Debt Coverage Ratio
- 0.15
- Internal Rate of Return (5 years)
- -17.9%
Cash Flow
Net Operating Income (NOI) minus mortgage payments.
Calculation:
NOI - Mortgage Payments
Cap Rate (Market Value)
Capitalization Rate is a rate of return that compares the yearly Net Operating Income (NOI) to the market value.
Calculation:
NOI / Market Value
Cash-on-Cash Return (CoC)
Annual Cash Flow / Cash Invested
Calculation:
Annual cash flow divided by initial cash invested.
Debt Coverage Ratio (DCR)
Net Operating Income (NOI) divided by total debt payments.
Calculation:
NOI / Total Debt Payments
Internal Rate of Return (IRR)
A metric for assessing profitability over time. IRR is the discount rate at which the net present value (NPV) of all future cash flows (positive and negative) from an investment equals zero — including both periodic cash flow (such as rent) and a projected sale at the end of the holding period. It represents the expected annualized return, accounting for income, expenses, and the recovery of capital through a future sale.
Property Description
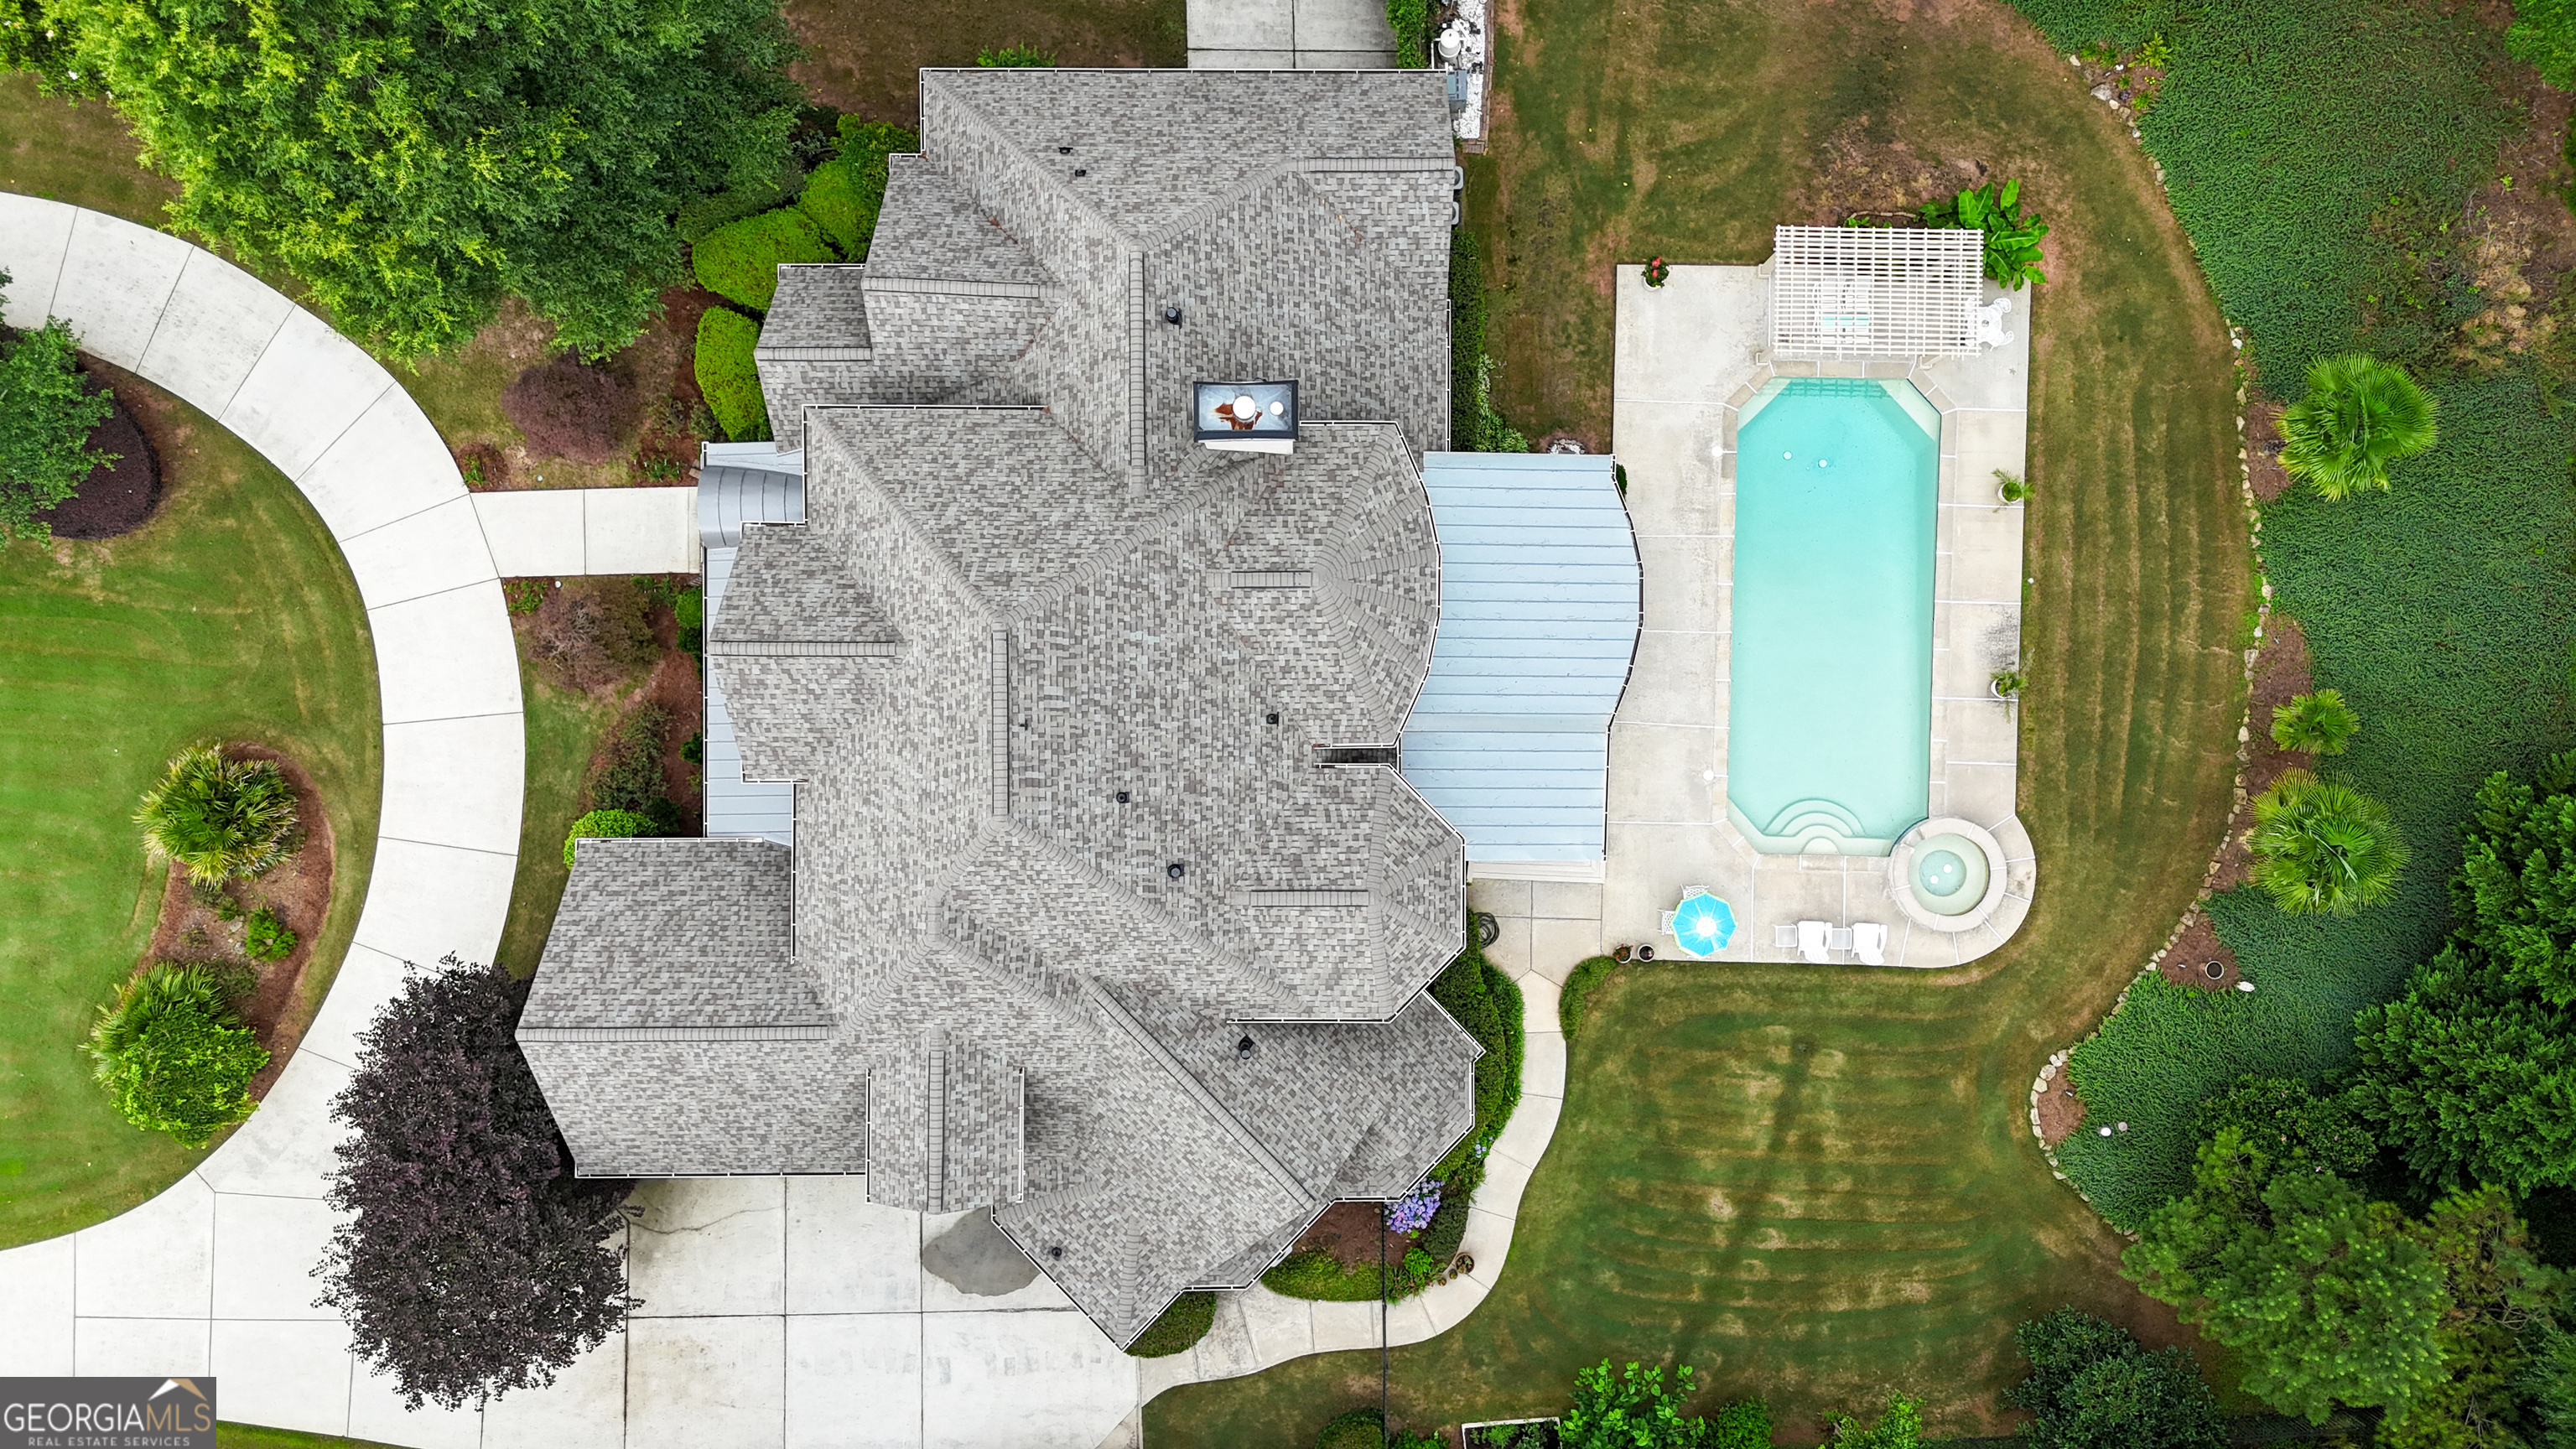
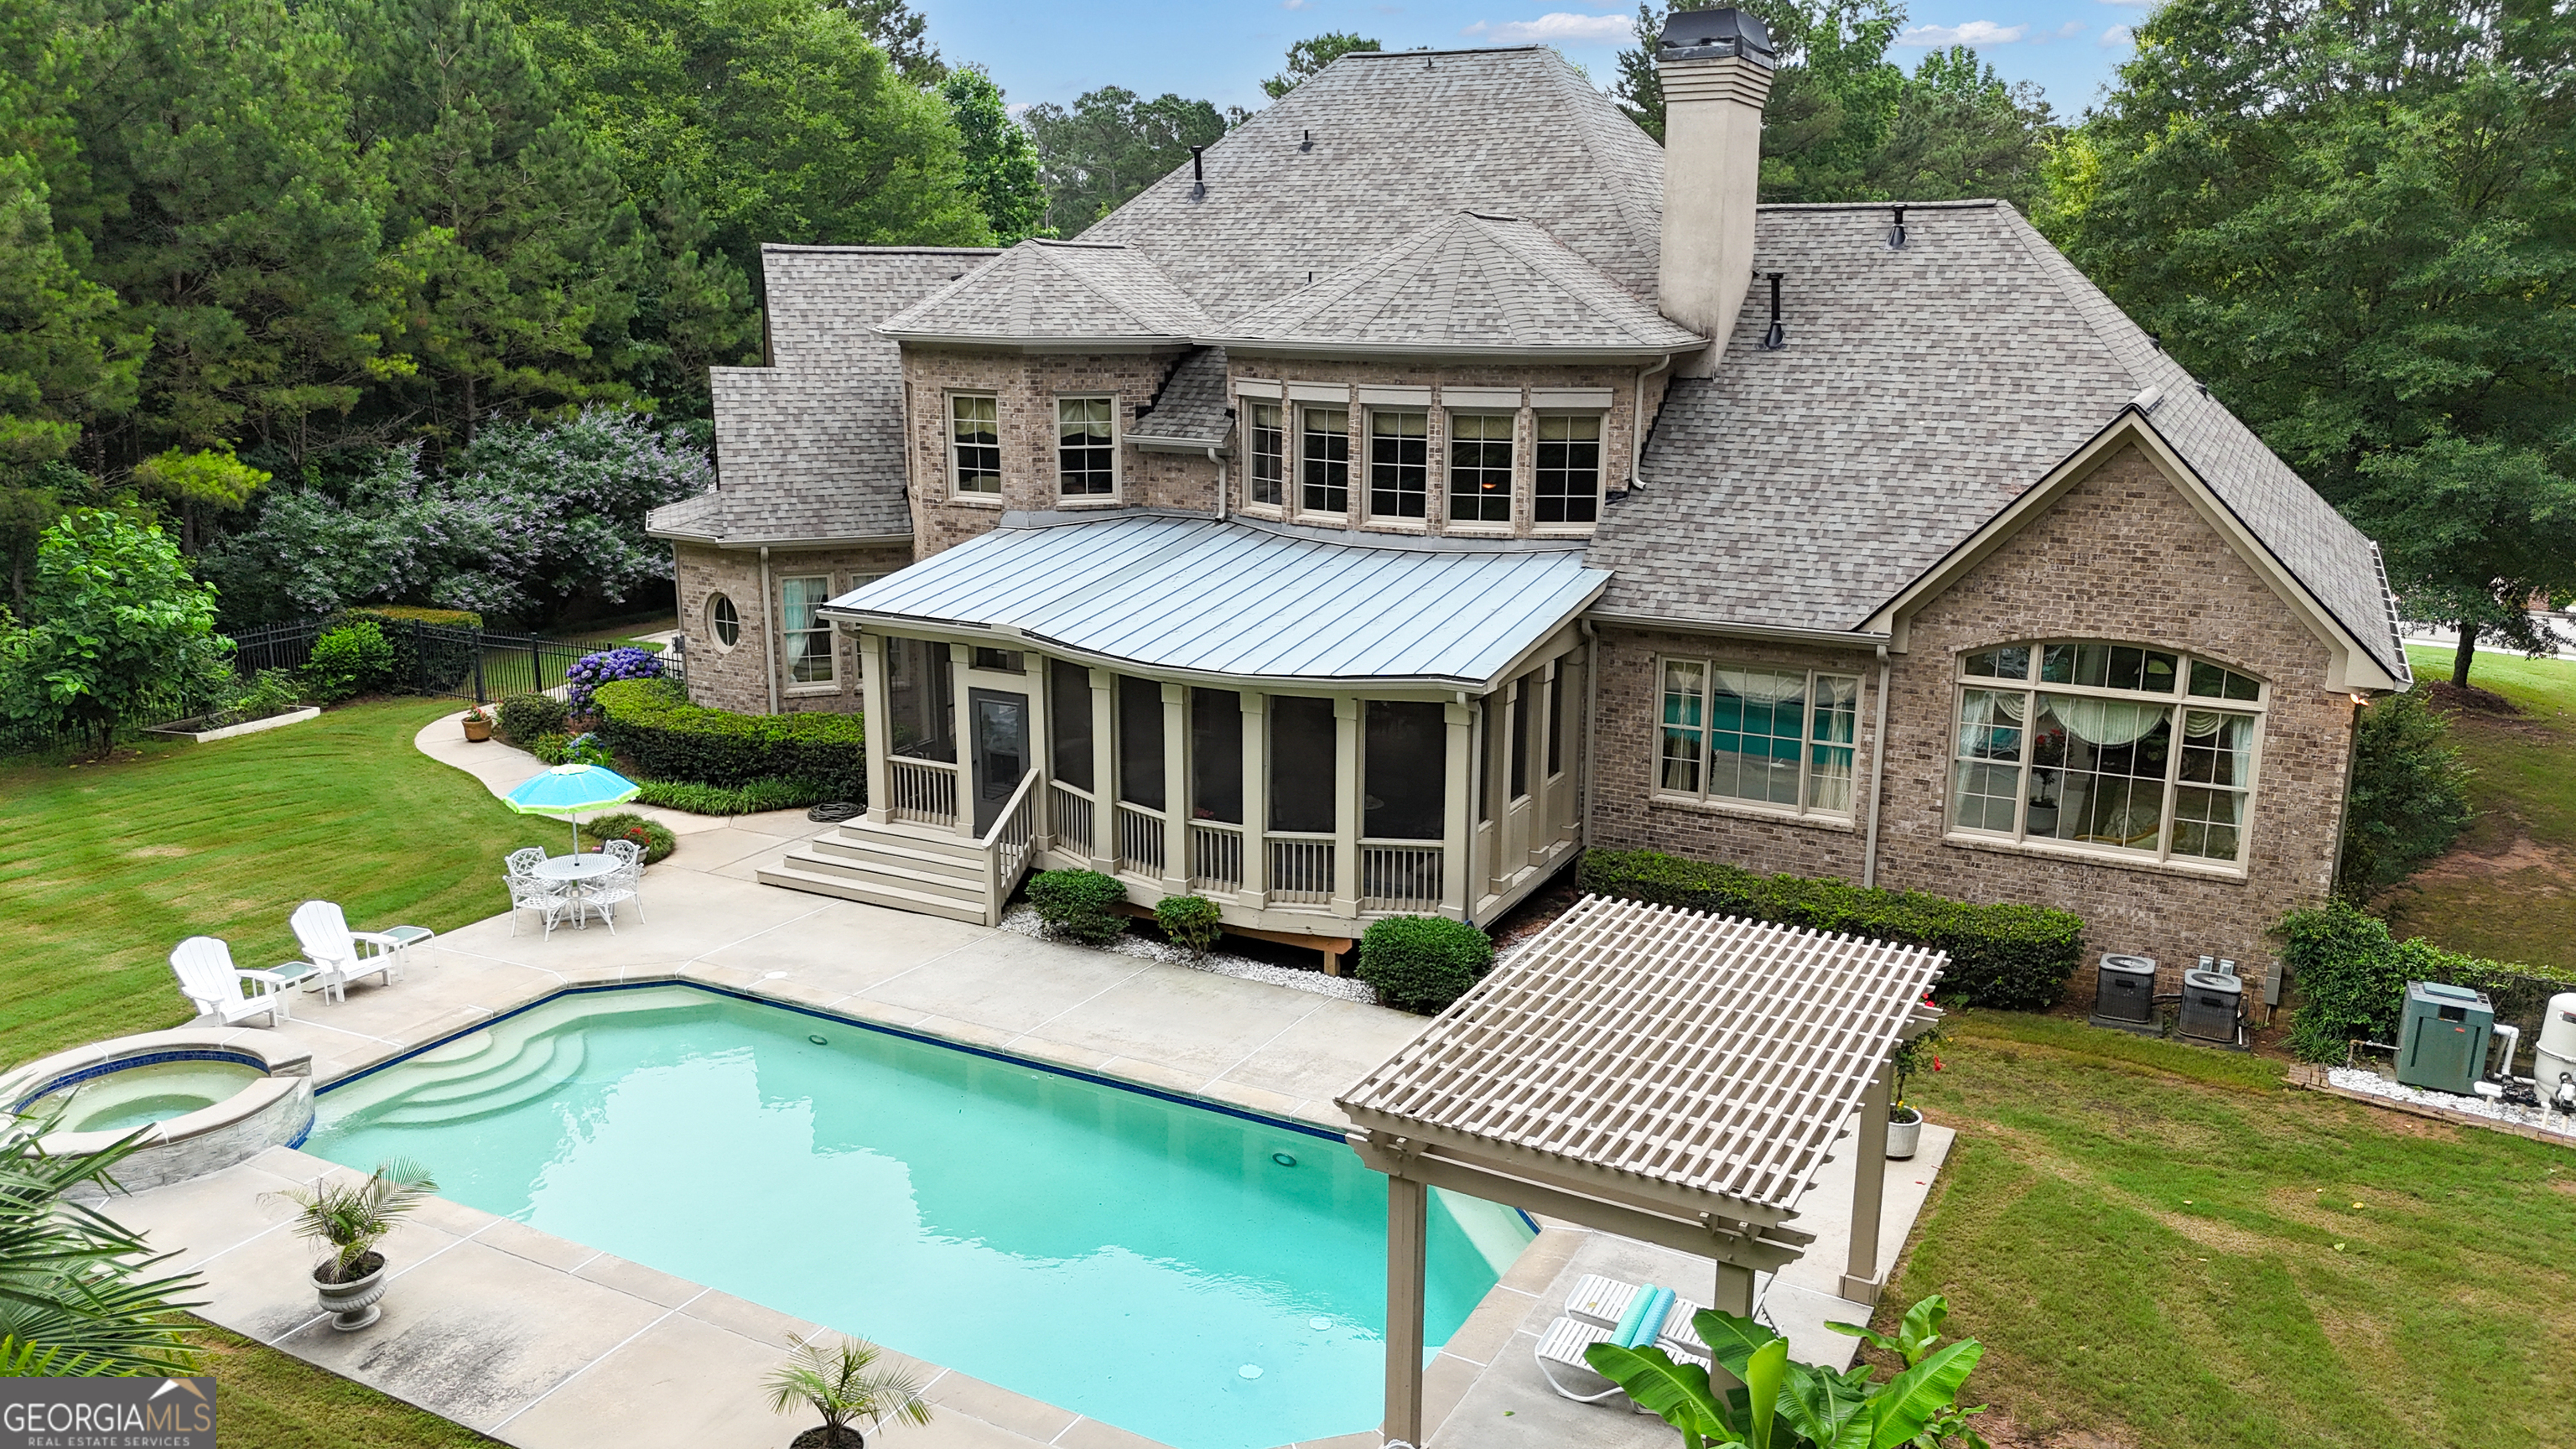
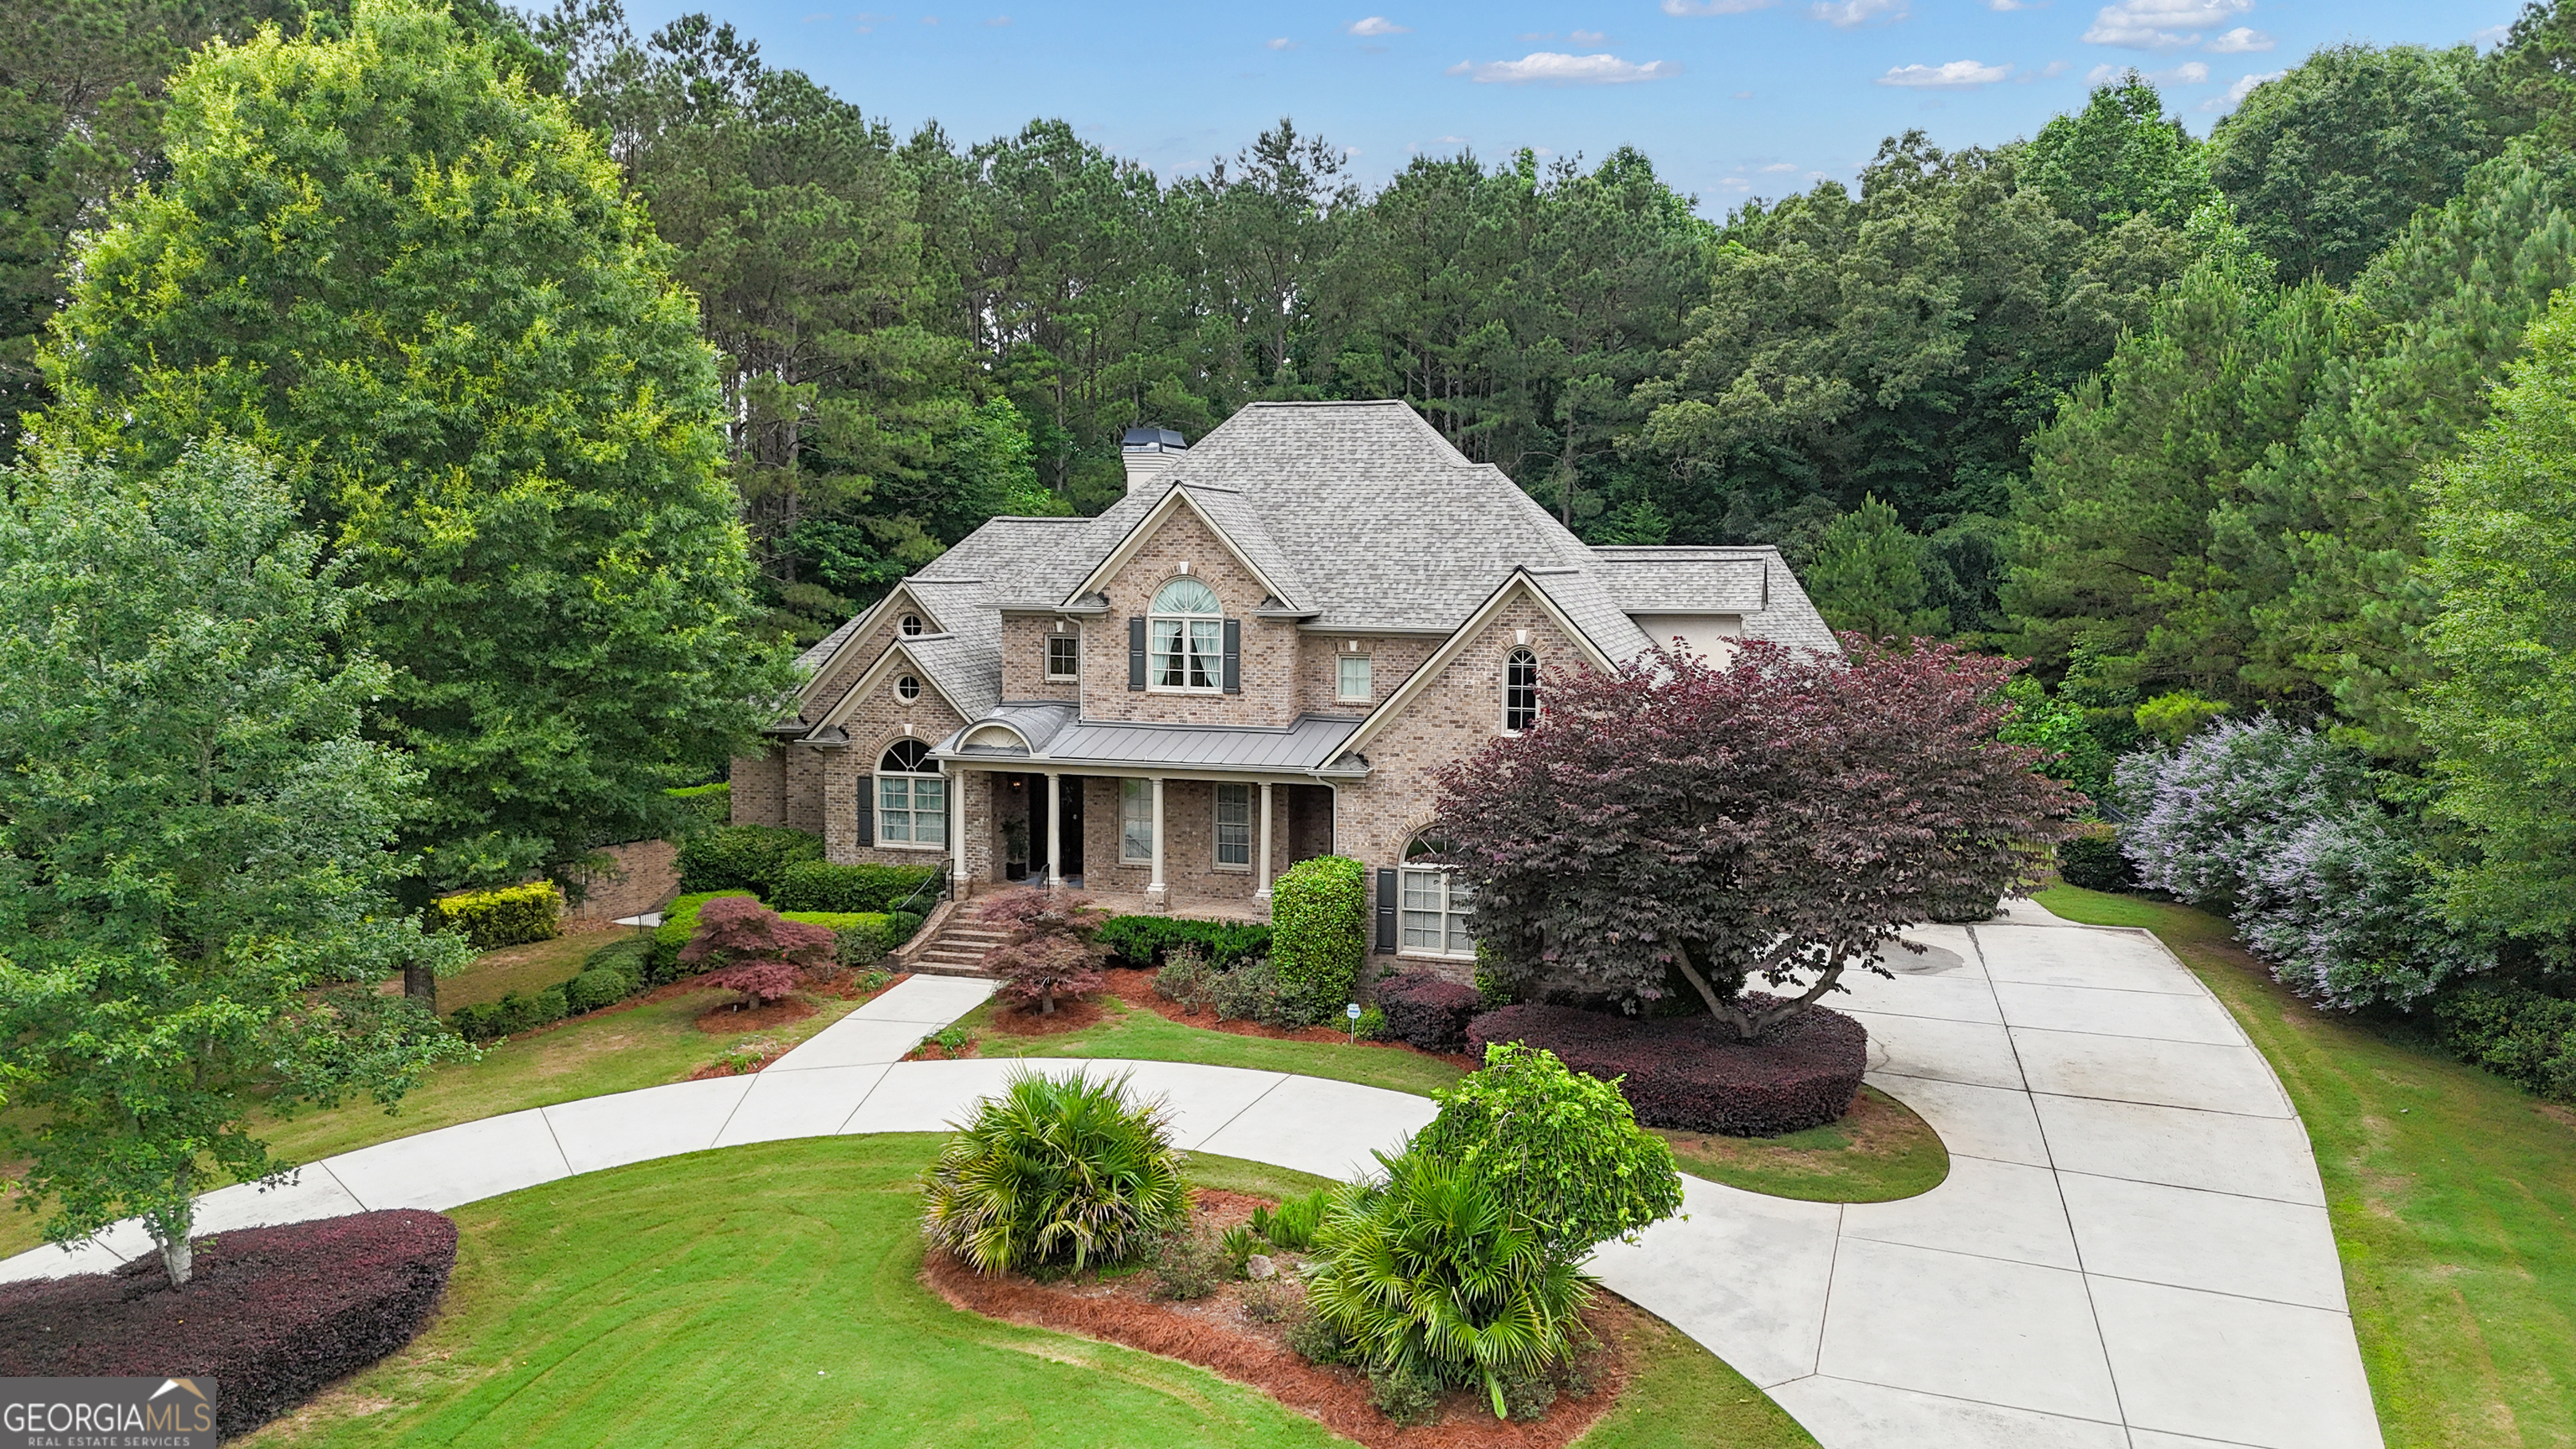
LUXURY AT IT'S FINEST in the Prestigious, gated River Oaks Community! Don't miss your opportunity to own an award-winning Street of Dreams custom designed, Move-In-Ready home with two Primary Bedrooms on the Main, a brand new roof, salt water pool, three car garage and a 3,500 sq ft finished basement! This four sided brick home with stunning architectural street appeal is perfectly situated on 2.36 acres, providing privacy and plenty of room to entertain! Being offered at $146,694 below a recent appraisal, so you will have immediate equity! From the circular driveway, step on to an inviting front porch perfect for afternoon ice tea and watching the day go by. Enter through two impressive iron scroll front doors and be WOWED by the soaring ceilings and WALL OF WINDOWS overlooking your back yard entertainment retreat! With hardwood floors throughout the main floor, a formal living room, wet bar, plus a separate dining room that seats 12, you will immediately be impressed! Walk into the expansive great room and be delighted by the abundance of natural light, the stately fireplace, and beautiful view from the floor to ceiling windows. An enormous screened in porch is waiting for you to enjoy! Step into a gourmet kitchen any home owner would be proud to own, complete with huge island that seats 4, custom cabinetry with granite counters, stainless high-end appliances and an adorable eat-in breakfast nook, overlooking the perfectly landscaped back yard! A wonderfully cozy den with vaulted ceilings accented by rustic beams and a stone gas fireplace is going to be your favorite hang out spot in the home! Also, on the Main you will find the stunning primary on suite with a wall of windows overlooking your pool, a separate sitting room, a beautiful bathroom with his and hers vanities, vaulted ceilings, and relaxing soaking tub! A second primary on suite makes for the perfect guest suite, in-law or room mate plan. Upstairs, you will find three oversized bedrooms, each with their own bathroom, an open loft with hallway that leads to the perfect space for an office, art studio, or you can use your imagination! The walk out terrace level is over 3,500 sq ft, and features a fireplace, mini bar, and a game room, perfect for pool, ping pong, playing cards, and having fun! A media room, wine room, office, and huge gym, as well as a full bath and tons of storage, make this a one of a kind home! OUTSIDE is a dream come true, with a huge oversized salt water pool, hot tub/spa with waterfall, professionally landscaped palm trees, gorgeous flowers, ornamental bushes, and an architectural fence. Woods behind you create a very private outdoor retreat! ALL THIS in the perfect Fayette County location boasting award-winning schools, minutes from I-85, Town of Trilith, shopping, and dining! Call right away to see this home today!
Build Your Team
Quickly find investor-friendly professionals who can help you succeed in real estate investing at any stage of the investing journey.


Agents
Match with investor-friendly agents who can help you find, analyze, and close your next deal


Lenders
Get the best funding…find investor-friendly lenders who specialize in your deal strategy


Property Managers
Transition to passive investing. Find a trusted property management partnership that lasts.


Tax Pros & Accountants
Taxes and financial reporting made easy—find experts to create tax savings strategies, file taxes, and more
Location
Property Details
Parking
- Description: Carport
- Details: Attached, Basement, Garage, Garage Door Opener, Kitchen Level, Storage
- Garage Spaces: 3
- Spaces Total: 3
Bedroom Information
- # of Bedrooms: 5
Bathroom Information
- # of Baths (Full): 6
- # of Baths (Total): 0.0
Interior Features
- # of Stories: 3
- Basement: Yes
- Basement Description: Daylight, Exterior Entry, Finished, Full, Interior Entry
- Fireplace: Yes
Exterior Features
- Exterior Walls Materials: Brick
- Foundation: Slab
- Roof Material: Composition
- Pool: Yes
HOA
- Has HOA: Yes
- HOA Fee: $1,250/annually
Land Information
- Land Use: Residential
- Land Use Subtype: Single Family Residential
Lot Information
- Parcel ID: 072401008
- Lot Size: 0 sqft
Property Information
- Property Type: Single Family Residence
- Style: Brick 4 Side, French Provincial, Traditional
- Year Built: 2005
Tax Information
- Annual Tax: $11,533
Utilities
- Water & Sewer: Public
- Heating: Wood Stove, Central, Forced Air, Natural Gas
- Cooling: Ceiling Fan(s), Central Air, Dual, Electric, Zoned
Location
- County: Fayette
Listing Details
Investment Summary
- Monthly Cash Flow
- -$6,490
- Cap Rate
- 0.9%
- Cash-on-Cash Return
- -22.7%
- Debt Coverage Ratio
- 0.15
- Internal Rate of Return (5 years)
- -17.9%
Cash Flow
Net Operating Income (NOI) minus mortgage payments.
Calculation:
NOI - Mortgage Payments
Cap Rate (Market Value)
Capitalization Rate is a rate of return that compares the yearly Net Operating Income (NOI) to the market value.
Calculation:
NOI / Market Value
Cash-on-Cash Return (CoC)
Annual Cash Flow / Cash Invested
Calculation:
Annual cash flow divided by initial cash invested.
Debt Coverage Ratio (DCR)
Net Operating Income (NOI) divided by total debt payments.
Calculation:
NOI / Total Debt Payments
Internal Rate of Return (IRR)
A metric for assessing profitability over time. IRR is the discount rate at which the net present value (NPV) of all future cash flows (positive and negative) from an investment equals zero — including both periodic cash flow (such as rent) and a projected sale at the end of the holding period. It represents the expected annualized return, accounting for income, expenses, and the recovery of capital through a future sale.
Purchase Details
Purchase PriceThe price paid for the property. Purchase price:
| $1,490,000 |
|---|---|
Amount FinancedThe amount of the purchase financed through a loan. Amount financed:
| -$1,192,000 |
Down paymentThe initial payment made towards the purchase. Down payment:
| $298,000 |
Closing CostsFees and expenses associated with purchasing a property, typically ranging from 2% to 5% of the home’s purchase price, paid at the end of a home purchase to cover services like lending, title transfer, and taxes. Closing costs:
| $44,700 |
Rehab CostsCosts incurred to repair or improve the property, including: roof, flooring, exterior siding, kitchen, exterior paint, bathrooms, etc. Rehab costs:
| $0 |
Initial Cash InvestedThe total initial cash invested in the property. Calculation:Down payment + Buying costs + Rehab costs Initial cash invested:
| $342,700 |
Square Feet (SQFT)The total square footage of the property. Square feet:
| 8,632 |
Cost Per Square FootCost per square foot of the property. Calculation:Purchase Price / Square Feet Cost per square foot:
| $173 |
Monthly Rent Per Square FootMonthly rent divided by the number of square feet. This ratio helps investors compare rental income efficiency across properties, markets, and unit sizes Calculation:Monthly Rent / Square Feet Monthly rent per square foot:
| $0.37 |
Financing Details
Loan AmountThe total sum of money borrowed from a lender to finance a property purchase. Calculation:Purchase Price - Down Payment
Loan amount:
| $1,192,000 |
|---|---|
Loan to Value Ratio (LTV)Loan amount divided by the market value of the property. Calculation:Loan Amount / Market Value
Loan to value ratio:
| 80.0% |
Loan TypeThe type of loan (e.g., fixed, adjustable).
Loan type:
| Amortizing |
TermThe loan repayment period in years.
Term:
| 30 years |
Interest RateThe percentage a lender charges on the borrowed amount of a loan, determining the cost of borrowing money.
Interest rate:
| 6.625% |
Principal & Interest (PI)The principal is the portion of the loan payment that reduces the loan balance. The interest is the lender's charge for borrowing money. Calculation:(P * r * (1 + r) ** n) / ((1 + r) ** n - 1) Where:
P = Loan amount (principal)
Principal & interest:
| $7,633 |
Property TaxesAnnual taxes levied by local governments on real estate properties. These taxes fund public services like schools, roads, and emergency services.
Property tax:
| $961 |
InsuranceThe costs for insurance coverage to protect against financial losses due to risks like fire, natural disasters, theft, liability, or tenant-related damages. Calculation:Assumes 7% of gross rental income, unless insurance rates are specified.
Insurance:
| $224 |
Private Mortgage Insurance (PMI)A fee that borrowers pay when they take out a conventional loan with a loan-to-value (LTV) ratio above 80%.
Private mortgage insurance (PMI):
| $0 |
Monthly PaymentThe fixed amount a borrower pays each month to repay a loan. It typically includes principal and interest (P&I) and may also cover property taxes, insurance, HOA fees, and PMI if escrowed. Monthly payment:
| $8,818 |
Operating Income
| % Rent | Monthly | Yearly | |
|---|---|---|---|
Gross RentThe total rental income received from tenants before deducting any expenses. Includes base rent, late fees, pet fees, parking fees, and other recurring charges.
Gross rent:
| $3,200 | $38,400 | |
Vacancy LossExpected loss of rent due to vacancies.
Vacancy loss:
(6%)
| 6% | -$192 | -$2,304 |
Operating IncomeGross rental income minus vacancy loss. Calculation:Gross rent - Vacancy loss
Operating income:
| $3,008 | $36,096 |
Operating Expenses
| % Rent | Monthly | Yearly | |
|---|---|---|---|
Property TaxesAnnual taxes levied by local governments on real estate properties. These taxes fund public services like schools, roads, and emergency services. | 30% | -$961 | -$11,534 |
InsuranceThe costs for insurance coverage to protect against financial losses due to risks like fire, natural disasters, theft, liability, or tenant-related damages. Calculation:Assumes 7% of gross rental income, unless insurance rates are specified. | 7% | -$224 | -$2,688 |
Property ManagementThe costs associated with hiring a property manager to handle the day-to-day operations of a rental property. Includes management fees, leasing fes, eviction fees, etc. Calculation:Assumes 8% of gross rental income. | 8% | -$256 | -$3,072 |
Repairs & MaintenanceOngoing costs for routine upkeep and minor fixes needed to keep a property in good working condition. Calculation:Assumes 5% of gross rental income. Varies by property age and condition. | 5% | -$160 | -$1,920 |
Capital ExpensesLarge, infrequent costs for major improvements or replacements, like a new roof, HVAC system, or appliances. Calculation:Assumes 5% of gross rental income. Varies by property age. | 5% | -$160 | -$1,920 |
HOA FeesRegular dues paid to a Homeowners Association for community maintenance, amenities, and management. Similar fees include: Condo Association Fees, Co-op Maintenance Fees, etc. | 3% | -$104 | -$1,248 |
Operating ExpensesRecurring costs required to maintain and manage a rental property, including property taxes, insurance, maintenance, repairs, utilities (if paid by the owner), property management fees, and other day-to-day expenses. Calculation:Insurance + Property Taxes + Property Management + Repairs & Maintenance + Capital Expenditures + HOA Fees | 58% | -$1,865 | -$22,382 |
Cash Flow
| Monthly | Yearly | |
|---|---|---|
Net Operating Income (NOI)The income generated from a property after deducting all operating expenses but before deducting mortgage payments, taxes, and capital expenditures. Calculation:Gross Operating Income - Operating Expenses
Net operating income:
| $1,143 | $13,716 |
Mortgage PaymentThe fixed amount a borrower pays each month to repay a loan. It typically includes principal and interest (P&I) and may also cover property taxes, insurance, HOA fees, and PMI if escrowed. | -$7,633 | -$91,596 |
Cash FlowNet Operating Income (NOI) minus mortgage payments. Calculation:NOI - Mortgage Payments | $6,490 | $77,880 |