$599,000
Investment Summary
- Monthly Cash Flow
- -$2,006
- Cap Rate
- 2.2%
- Cash-on-Cash Return
- -17.5%
- Debt Coverage Ratio
- 0.36
- Internal Rate of Return (5 years)
- -12.9%
Cash Flow
Net Operating Income (NOI) minus mortgage payments.
Calculation:
NOI - Mortgage Payments
Cap Rate (Market Value)
Capitalization Rate is a rate of return that compares the yearly Net Operating Income (NOI) to the market value.
Calculation:
NOI / Market Value
Cash-on-Cash Return (CoC)
Annual Cash Flow / Cash Invested
Calculation:
Annual cash flow divided by initial cash invested.
Debt Coverage Ratio (DCR)
Net Operating Income (NOI) divided by total debt payments.
Calculation:
NOI / Total Debt Payments
Internal Rate of Return (IRR)
A metric for assessing profitability over time. IRR is the discount rate at which the net present value (NPV) of all future cash flows (positive and negative) from an investment equals zero — including both periodic cash flow (such as rent) and a projected sale at the end of the holding period. It represents the expected annualized return, accounting for income, expenses, and the recovery of capital through a future sale.
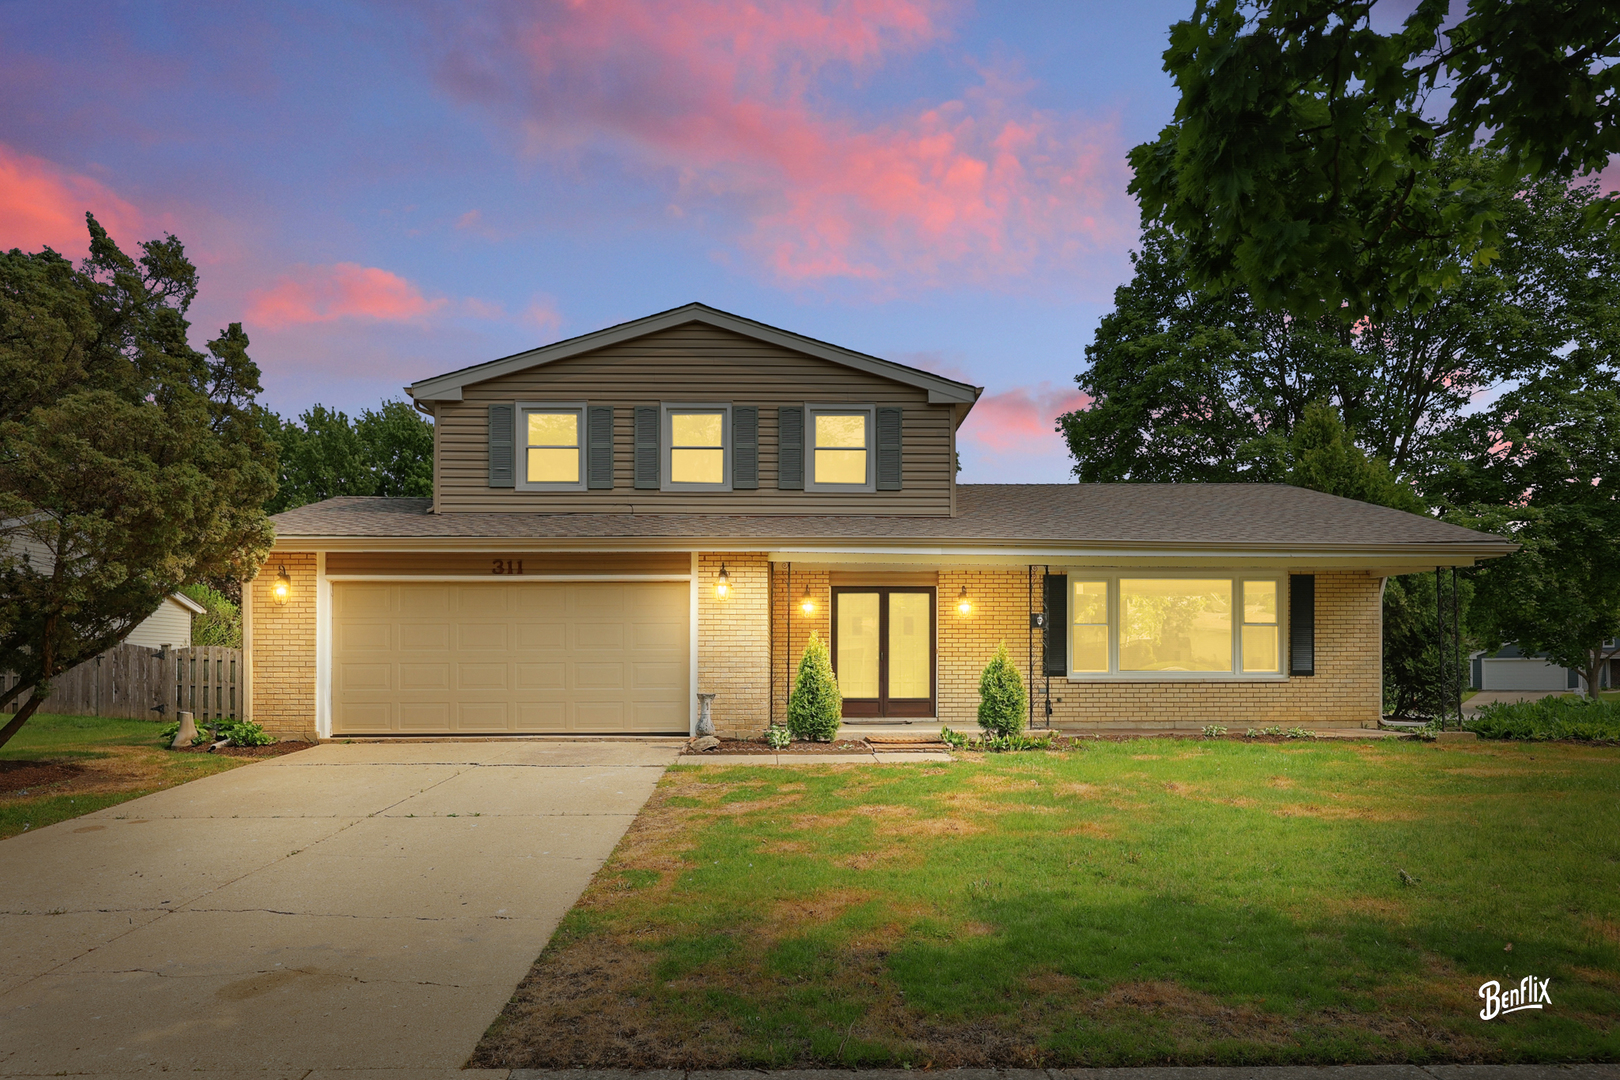
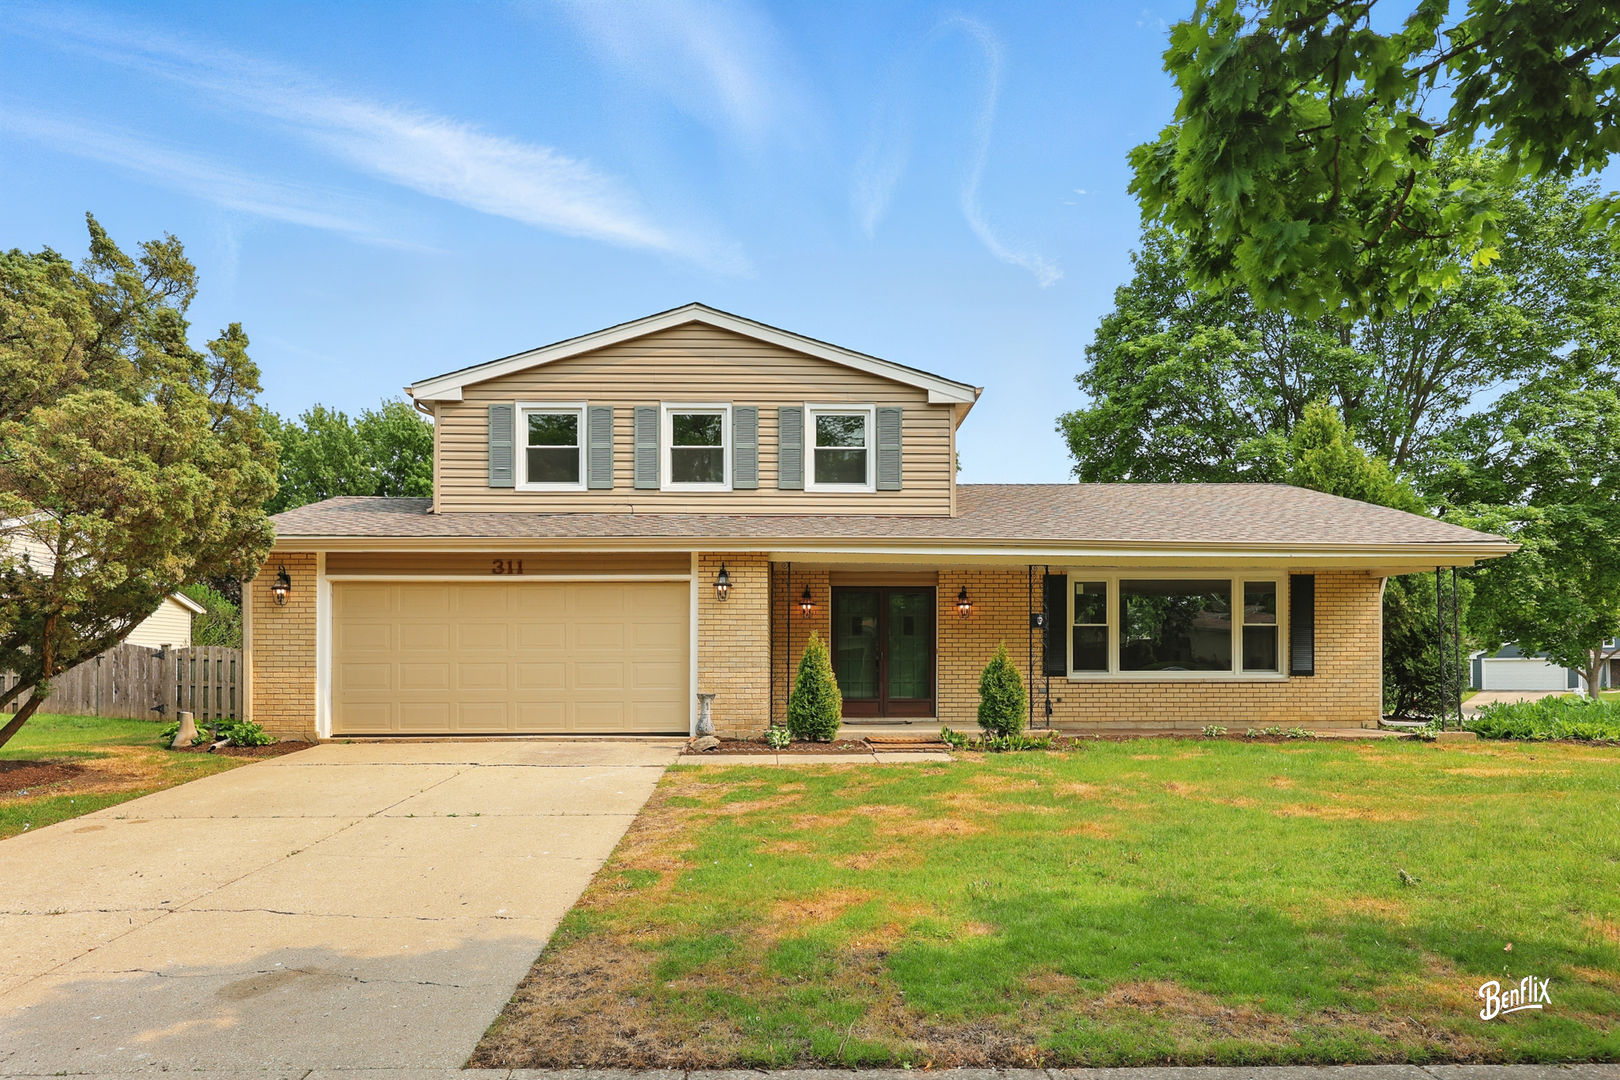
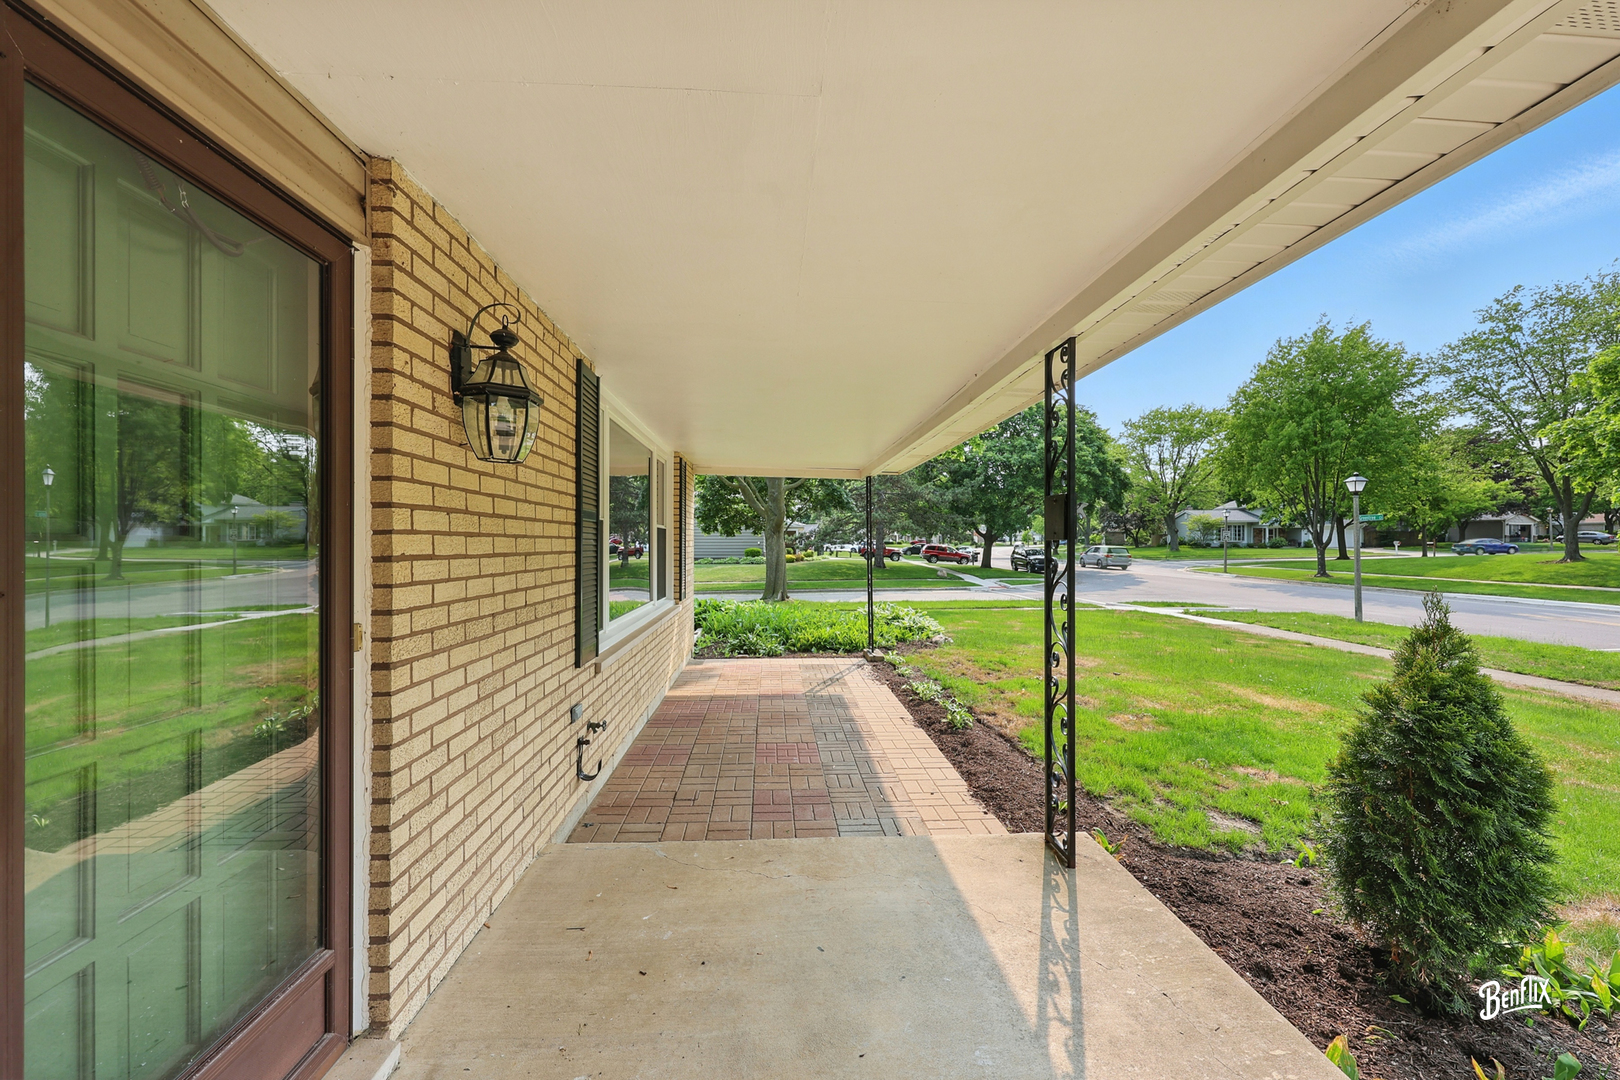
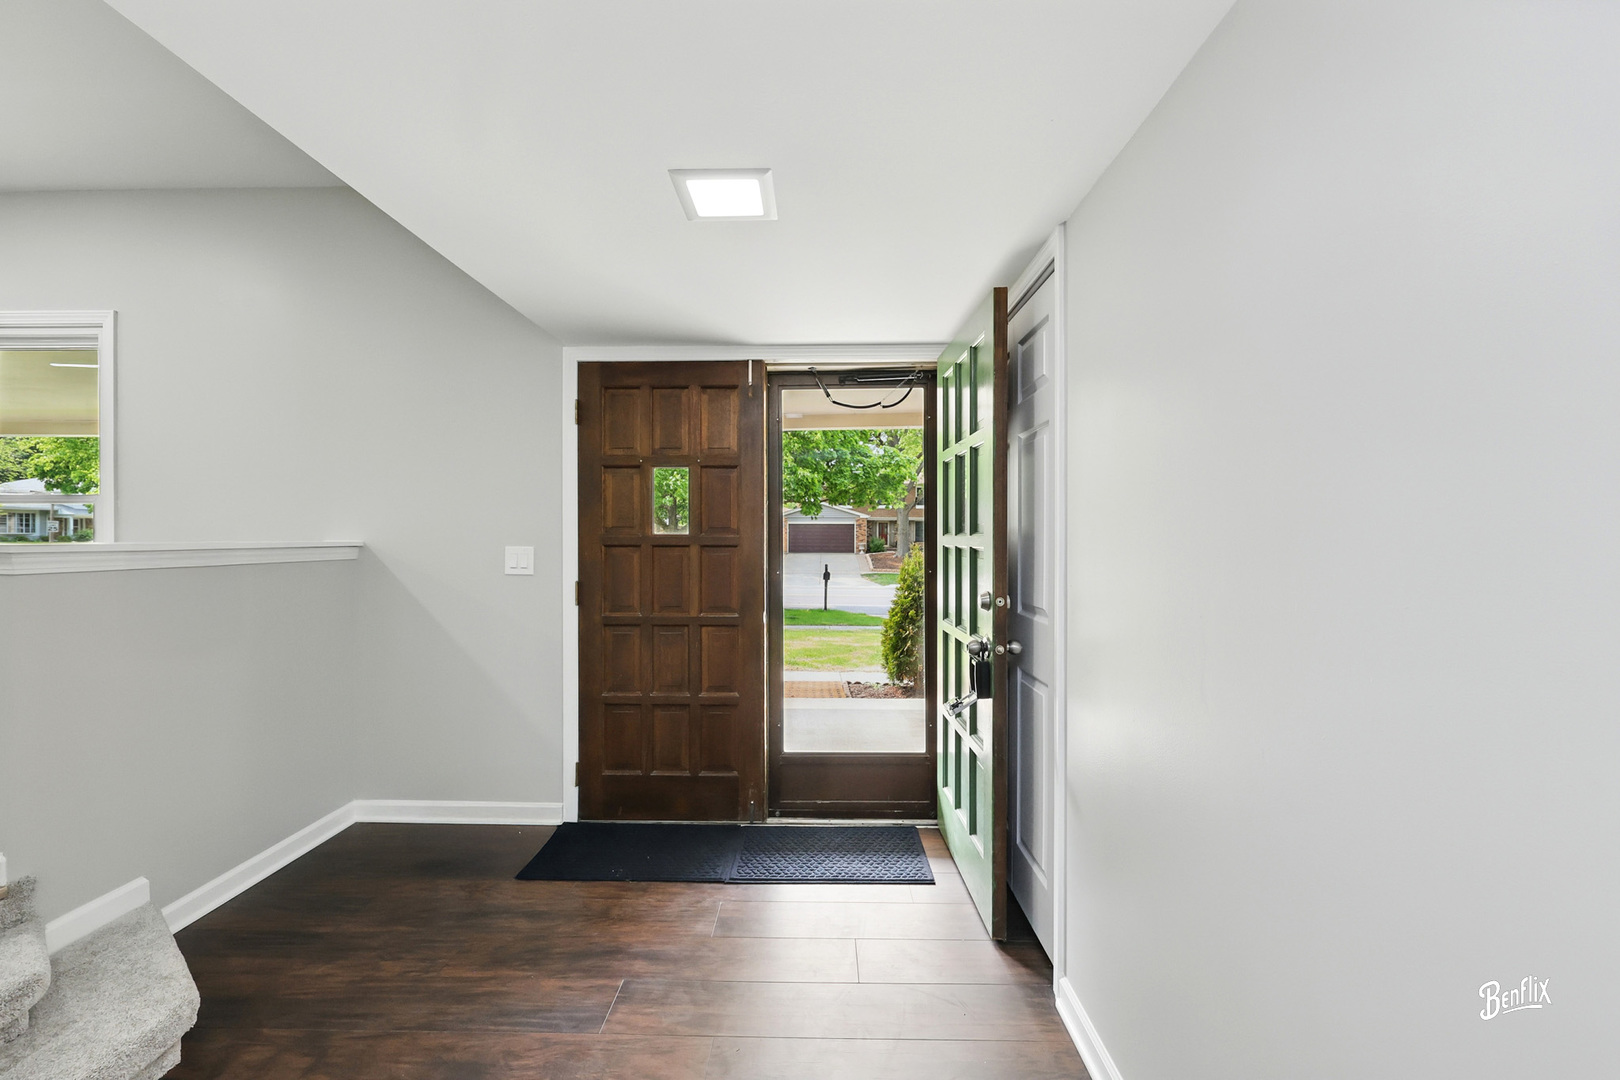
Property Description
Welcome to 311 Greentree Pkwy - Pride of ownership shines through in this beautifully remodeled gem on a huge corner lot with 2300 sqft of living space! You cannot ask for a better location with great schools, shopping, access etc. This property is zoned for either award winning schools - you can choose between Vernon Hills or Libertyville High School. This stunning 3-bedroom, 2.1-bathroom home offers a perfect blend of modern amenities and classic charm. Deliberate Attention to Detail Abound; This Meticulously Maintained Remodel became fully Realized with the Most Discerning of Buyers in Mind! The upgrades include brand new furnance, brand new AC, brand new windows throughout, brand new flooring, brand new recessed lightings, brand new carpet, brand new custom kitchen cabinets, brand new countertops, stunning brand-new backsplash, finished basement, brand new upgraded bathrooms, brand new upgraded kitchen. Step into the Spacious Living Room with Brand New Luxury Vinyl Plank Flooring, Light Fixtures including the recessed lightings, Outlets, Switches, brand new windows, brand new 6 panel doors throughout & Fresh Paint Throughout! Hosts Dinner Parties in the Adjacent Dining Room. Prepare a Chef's Feast in the Brand-New Kitchen with New White Custom Cabinets, New Stainless-Steel Appliances, New Quartz Countertops & Stunning ceramic Tile Backsplash! Kitchen overlooks the giant family room with cozy fire place and the family room has brand new flooring, brand new recessed lightings, switches & outlets. Step into your privately fenced backyard which has an amazing garden with concrete patio and greenspace with beautiful flower plants & trees. This beautiful backyard is just ready for your summer parties. Plenty of Extra Storage in the Attached Two Car Garage and upgraded powder completes the main level. Upstairs you will find 3 good sized bedrooms with brand new carpet & stylishly upgraded brand new bathrooms. Master bedroom is a private oasis with his/her closets, updated ensuite bathroom with shower and stunning tiles. Another 2 good sized bedrooms for guest/kids/office and has another full updated bathroom access right next to it. The guest bathroom is fully upgraded with large vanity sink, tub and stunning tiles. Basement was just finished with brand new carpet and it's ready to host your cocktail parties or family gathering. Additional storage space, laundry & mechanical room in basement with epoxy flooring for your comfort & easy maintenance. Situated in a friendly Greentree neighborhood of Libertyville, this house is just a stone's throw away from shopping hubs, delightful parks, happening Libertyville downtown. Conveniently Close to Metra, Shopping, Dining, and Commuting to the Interstate! Nothing to do but, move right in and enjoy this beautiful home for the upcoming season and forever. Don't miss out on this incredible opportunity to own a piece of Libertyville paradise!
Build Your Team
Quickly find investor-friendly professionals who can help you succeed in real estate investing at any stage of the investing journey.


Agents
Match with investor-friendly agents who can help you find, analyze, and close your next deal


Lenders
Get the best funding…find investor-friendly lenders who specialize in your deal strategy


Property Managers
Transition to passive investing. Find a trusted property management partnership that lasts.


Tax Pros & Accountants
Taxes and financial reporting made easy—find experts to create tax savings strategies, file taxes, and more
Location
Property Details
Parking
- Description: Garage
- Details: Garage Door Opener, On Site, Attached, Garage
- Garage Spaces: 2
- Spaces Total: 2
Bedroom Information
- # of Bedrooms: 3
Bathroom Information
- # of Baths (Full): 2
- # of Baths (Partial): 1
- # of Baths (Total): 3.0
Interior Features
- # of Rooms: 7
- # of Stories: 3
- Basement: Yes
- Basement Description: Sump Pump, Finished, Partial
- Fireplace: Yes
Exterior Features
- Foundation: Concrete Perimeter
- Roof Material: Asphalt
Land Information
- Land Use: Residential
- Land Use Subtype: Single Family Residential
Lot Information
- Parcel ID: 1128108018
- Lot Size: 0 sqft
Property Information
- Property Type: Single Family Residence
- Year Built: 1974
Tax Information
- Annual Tax: $12,210
Utilities
- Water & Sewer: Public
- Heating: Natural Gas, Forced Air
- Cooling: Central Air
Location
- County: Lake
Listing Details
Investment Summary
- Monthly Cash Flow
- -$2,006
- Cap Rate
- 2.2%
- Cash-on-Cash Return
- -17.5%
- Debt Coverage Ratio
- 0.36
- Internal Rate of Return (5 years)
- -12.9%
Cash Flow
Net Operating Income (NOI) minus mortgage payments.
Calculation:
NOI - Mortgage Payments
Cap Rate (Market Value)
Capitalization Rate is a rate of return that compares the yearly Net Operating Income (NOI) to the market value.
Calculation:
NOI / Market Value
Cash-on-Cash Return (CoC)
Annual Cash Flow / Cash Invested
Calculation:
Annual cash flow divided by initial cash invested.
Debt Coverage Ratio (DCR)
Net Operating Income (NOI) divided by total debt payments.
Calculation:
NOI / Total Debt Payments
Internal Rate of Return (IRR)
A metric for assessing profitability over time. IRR is the discount rate at which the net present value (NPV) of all future cash flows (positive and negative) from an investment equals zero — including both periodic cash flow (such as rent) and a projected sale at the end of the holding period. It represents the expected annualized return, accounting for income, expenses, and the recovery of capital through a future sale.
Purchase Details
Purchase PriceThe price paid for the property. Purchase price:
| $599,000 |
|---|---|
Amount FinancedThe amount of the purchase financed through a loan. Amount financed:
| -$479,200 |
Down paymentThe initial payment made towards the purchase. Down payment:
| $119,800 |
Closing CostsFees and expenses associated with purchasing a property, typically ranging from 2% to 5% of the home’s purchase price, paid at the end of a home purchase to cover services like lending, title transfer, and taxes. Closing costs:
| $17,970 |
Rehab CostsCosts incurred to repair or improve the property, including: roof, flooring, exterior siding, kitchen, exterior paint, bathrooms, etc. Rehab costs:
| $0 |
Initial Cash InvestedThe total initial cash invested in the property. Calculation:Down payment + Buying costs + Rehab costs Initial cash invested:
| $137,770 |
Square Feet (SQFT)The total square footage of the property. Square feet:
| 2,348 |
Cost Per Square FootCost per square foot of the property. Calculation:Purchase Price / Square Feet Cost per square foot:
| $255 |
Monthly Rent Per Square FootMonthly rent divided by the number of square feet. This ratio helps investors compare rental income efficiency across properties, markets, and unit sizes Calculation:Monthly Rent / Square Feet Monthly rent per square foot:
| $1.32 |
Financing Details
Loan AmountThe total sum of money borrowed from a lender to finance a property purchase. Calculation:Purchase Price - Down Payment
Loan amount:
| $479,200 |
|---|---|
Loan to Value Ratio (LTV)Loan amount divided by the market value of the property. Calculation:Loan Amount / Market Value
Loan to value ratio:
| 80.0% |
Loan TypeThe type of loan (e.g., fixed, adjustable).
Loan type:
| Amortizing |
TermThe loan repayment period in years.
Term:
| 30 years |
Interest RateThe percentage a lender charges on the borrowed amount of a loan, determining the cost of borrowing money.
Interest rate:
| 6.810% |
Principal & Interest (PI)The principal is the portion of the loan payment that reduces the loan balance. The interest is the lender's charge for borrowing money. Calculation:(P * r * (1 + r) ** n) / ((1 + r) ** n - 1) Where:
P = Loan amount (principal)
Principal & interest:
| $3,127 |
Property TaxesAnnual taxes levied by local governments on real estate properties. These taxes fund public services like schools, roads, and emergency services.
Property tax:
| $1,018 |
InsuranceThe costs for insurance coverage to protect against financial losses due to risks like fire, natural disasters, theft, liability, or tenant-related damages. Calculation:Assumes 7% of gross rental income, unless insurance rates are specified.
Insurance:
| $217 |
Private Mortgage Insurance (PMI)A fee that borrowers pay when they take out a conventional loan with a loan-to-value (LTV) ratio above 80%.
Private mortgage insurance (PMI):
| $0 |
Monthly PaymentThe fixed amount a borrower pays each month to repay a loan. It typically includes principal and interest (P&I) and may also cover property taxes, insurance, HOA fees, and PMI if escrowed. Monthly payment:
| $4,362 |
Operating Income
| % Rent | Monthly | Yearly | |
|---|---|---|---|
Gross RentThe total rental income received from tenants before deducting any expenses. Includes base rent, late fees, pet fees, parking fees, and other recurring charges.
Gross rent:
| $3,100 | $37,200 | |
Vacancy LossExpected loss of rent due to vacancies.
Vacancy loss:
(6%)
| 6% | -$186 | -$2,232 |
Operating IncomeGross rental income minus vacancy loss. Calculation:Gross rent - Vacancy loss
Operating income:
| $2,914 | $34,968 |
Operating Expenses
| % Rent | Monthly | Yearly | |
|---|---|---|---|
Property TaxesAnnual taxes levied by local governments on real estate properties. These taxes fund public services like schools, roads, and emergency services. | 33% | -$1,018 | -$12,210 |
InsuranceThe costs for insurance coverage to protect against financial losses due to risks like fire, natural disasters, theft, liability, or tenant-related damages. Calculation:Assumes 7% of gross rental income, unless insurance rates are specified. | 7% | -$217 | -$2,604 |
Property ManagementThe costs associated with hiring a property manager to handle the day-to-day operations of a rental property. Includes management fees, leasing fes, eviction fees, etc. Calculation:Assumes 8% of gross rental income. | 8% | -$248 | -$2,976 |
Repairs & MaintenanceOngoing costs for routine upkeep and minor fixes needed to keep a property in good working condition. Calculation:Assumes 5% of gross rental income. Varies by property age and condition. | 5% | -$155 | -$1,860 |
Capital ExpensesLarge, infrequent costs for major improvements or replacements, like a new roof, HVAC system, or appliances. Calculation:Assumes 5% of gross rental income. Varies by property age. | 5% | -$155 | -$1,860 |
HOA FeesRegular dues paid to a Homeowners Association for community maintenance, amenities, and management. Similar fees include: Condo Association Fees, Co-op Maintenance Fees, etc. | n/a | n/a | n/a |
Operating ExpensesRecurring costs required to maintain and manage a rental property, including property taxes, insurance, maintenance, repairs, utilities (if paid by the owner), property management fees, and other day-to-day expenses. Calculation:Insurance + Property Taxes + Property Management + Repairs & Maintenance + Capital Expenditures + HOA Fees | 58% | -$1,793 | -$21,510 |
Cash Flow
| Monthly | Yearly | |
|---|---|---|
Net Operating Income (NOI)The income generated from a property after deducting all operating expenses but before deducting mortgage payments, taxes, and capital expenditures. Calculation:Gross Operating Income - Operating Expenses
Net operating income:
| $1,121 | $13,452 |
Mortgage PaymentThe fixed amount a borrower pays each month to repay a loan. It typically includes principal and interest (P&I) and may also cover property taxes, insurance, HOA fees, and PMI if escrowed. | -$3,127 | -$37,524 |
Cash FlowNet Operating Income (NOI) minus mortgage payments. Calculation:NOI - Mortgage Payments | $2,006 | $24,072 |