

$1,395,000
Investment Summary
- Monthly Cash Flow
- -$4,652
- Cap Rate
- 2.3%
- Cash-on-Cash Return
- -17.4%
- Debt Coverage Ratio
- 0.36
- Internal Rate of Return (5 years)
- -12.8%
Cash Flow
Net Operating Income (NOI) minus mortgage payments.
Calculation:
NOI - Mortgage Payments
Cap Rate (Market Value)
Capitalization Rate is a rate of return that compares the yearly Net Operating Income (NOI) to the market value.
Calculation:
NOI / Market Value
Cash-on-Cash Return (CoC)
Annual Cash Flow / Cash Invested
Calculation:
Annual cash flow divided by initial cash invested.
Debt Coverage Ratio (DCR)
Net Operating Income (NOI) divided by total debt payments.
Calculation:
NOI / Total Debt Payments
Internal Rate of Return (IRR)
A metric for assessing profitability over time. IRR is the discount rate at which the net present value (NPV) of all future cash flows (positive and negative) from an investment equals zero — including both periodic cash flow (such as rent) and a projected sale at the end of the holding period. It represents the expected annualized return, accounting for income, expenses, and the recovery of capital through a future sale.
Property Description
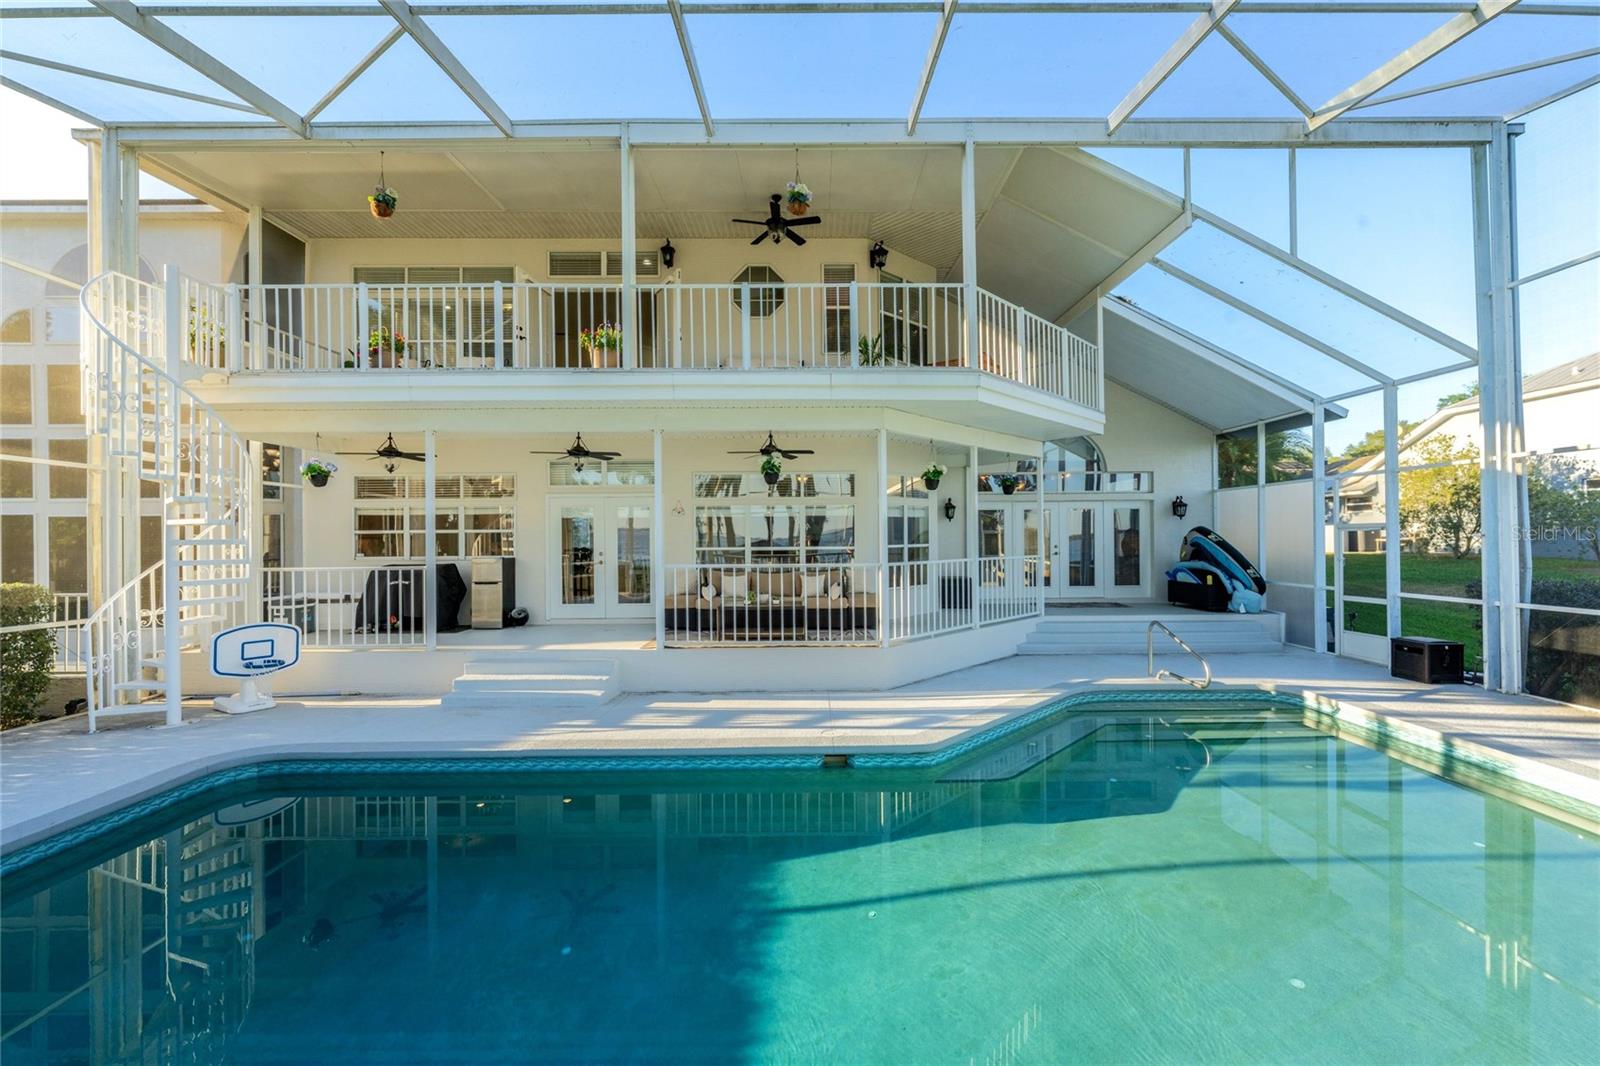
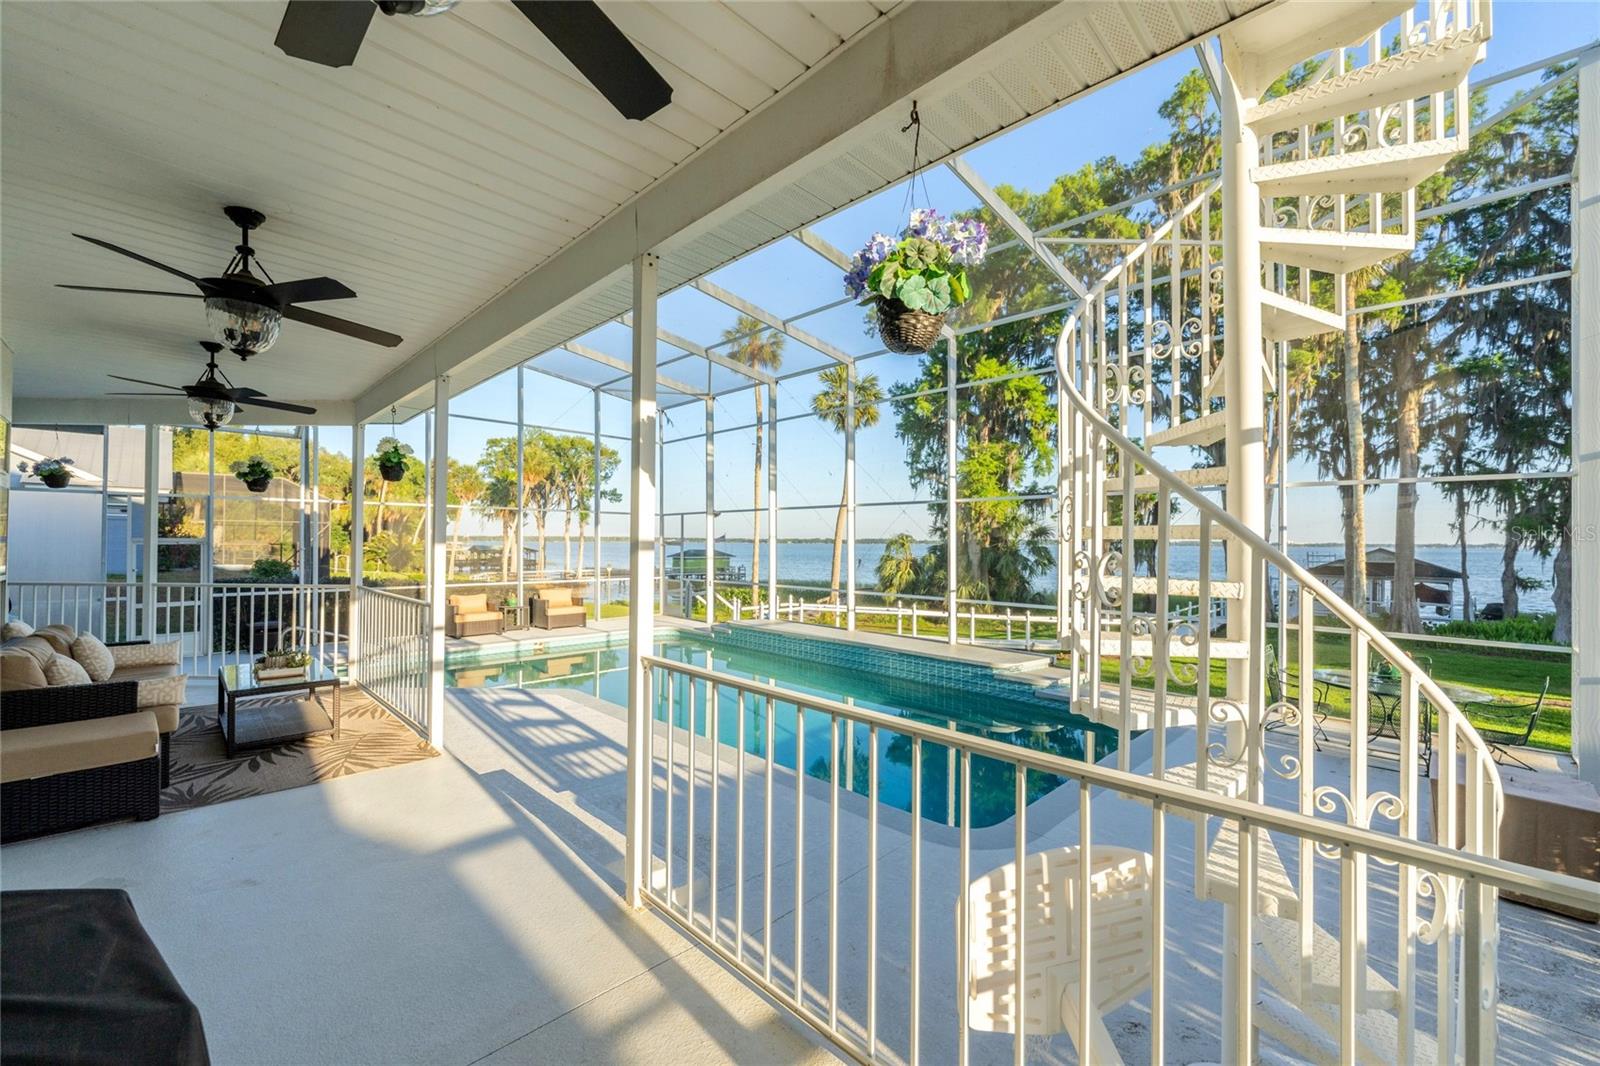
Glorious sunrises, spectacular sunsets and southern exposure grace this architectural designers' delight featuring direct frontage on Lake Eustis with private boathouse, double lifts, screen enclosed porch, sitting area and an awesome roof top sun deck offering miles of wide-open views of the waterfront and the downtown Eustis skyline. Immediately, you will notice that this impeccable property shows pride of ownership and has been meticulously maintained on the outside as well as the inside. Eye catching curb appeal with a fountained island circular driveway, mature landscaping and dramatic architecturally designed glass windows, a fitting first impression for a home that exudes grandeur throughout. The beveled glass double door entry opens to a spectacular grand entrance featuring two story ceilings and an exotic floor to ceiling glass window overlooking the waterfront. Large picture windows and soaring ceilings flood the interiors with natural lighting while delivering beautiful views from nearly every room. This magnificent residence features 5-bedrooms, 3.5 baths, separate office, formal dining room and family room overlooking the lake. The centerpiece of the home features the kitchen which flows into a wide central gathering space with circular breakfast bar, granite counter tops, stainless steel appliances and breathtaking views of Lake Eustis. The second level master suite is a wonderful and private sanctuary featuring a double door entry, enormous walk-in closet, whirlpool garden tub, granite counter tops and French doors that open to a private balcony overlooking the sparkling inground pool, a personal, tropical paradise. Wake up to beautiful sunrises and at sunset, watch the skyline come to life while you sit on your balcony and watch the colorful skies and twinkling lights across the lake. The views will absolutely dazzle you! Breezy porches and bright open spaces characterize the outdoor living which is a primary focus and designed for large- scale entertaining. It features a spectacular two-story screen enclosed heated salt pool and the large, covered lanai that spans the exterior back of the home. This is a home of great volumes inside and out. It masterfully blends chic, and sophisticated elegance with the utmost comfort and connection to the waterfront and the great outdoors. Cast off from your own private dock and travel to nearby towns along the seven lakes on the Harris Chain of Lakes. This home had a major kitchen and bath remodel in 2011. Other highlights of this home include a newer roof on the main house and the boathouse (2023), freshly painted interior and exterior, new LG double convection oven, newer screening for the boathouse, new straps for the boat lift, newer motor for the jet ski lift, newer invisible fence lines in the front and back yard. Please click on view virtual tour to see more photos and a video of this home. https://vimeo.com/1076149789 You will be happy here.
Build Your Team
Quickly find investor-friendly professionals who can help you succeed in real estate investing at any stage of the investing journey.


Agents
Match with investor-friendly agents who can help you find, analyze, and close your next deal


Lenders
Get the best funding…find investor-friendly lenders who specialize in your deal strategy


Property Managers
Transition to passive investing. Find a trusted property management partnership that lasts.


Tax Pros & Accountants
Taxes and financial reporting made easy—find experts to create tax savings strategies, file taxes, and more
Location
Property Details
Parking
- Description: Circular Driveway, Garage Door Opener
- Details: Circular Driveway, Driveway, Garage Door Opener, Garage Faces Side, Attached
- Garage Spaces: 3
- Spaces Total: 0
Bedroom Information
- # of Bedrooms: 5
Bathroom Information
- # of Baths (Full): 3
- # of Baths (Partial): 1
- # of Baths (Total): 4.0
Interior Features
- # of Rooms: 12
- # of Stories: 2
Exterior Features
- Exterior Walls Materials: Brick Veneer
- Foundation: Slab
- Roof Material: Shingle
- Pool: Yes
HOA
- Has HOA: Yes
- Association: Martha Ledford
- HOA Fee: $550/annually
Land Information
- Land Use: Residential
- Land Use Subtype: Single Family Residential
Lot Information
- Parcel ID: 331826060000000200
- Lot Size: 30402 sqft
Property Information
- Property Type: Single Family Residence
- Style: Custom, Traditional
- Year Built: 1995
Tax Information
- Annual Tax: $13,411
Utilities
- Water & Sewer: Public
- Heating: Central, Zoned
- Cooling: Central Air, Zoned
Location
- County: Lake
Listing Details
Investment Summary
- Monthly Cash Flow
- -$4,652
- Cap Rate
- 2.3%
- Cash-on-Cash Return
- -17.4%
- Debt Coverage Ratio
- 0.36
- Internal Rate of Return (5 years)
- -12.8%
Cash Flow
Net Operating Income (NOI) minus mortgage payments.
Calculation:
NOI - Mortgage Payments
Cap Rate (Market Value)
Capitalization Rate is a rate of return that compares the yearly Net Operating Income (NOI) to the market value.
Calculation:
NOI / Market Value
Cash-on-Cash Return (CoC)
Annual Cash Flow / Cash Invested
Calculation:
Annual cash flow divided by initial cash invested.
Debt Coverage Ratio (DCR)
Net Operating Income (NOI) divided by total debt payments.
Calculation:
NOI / Total Debt Payments
Internal Rate of Return (IRR)
A metric for assessing profitability over time. IRR is the discount rate at which the net present value (NPV) of all future cash flows (positive and negative) from an investment equals zero — including both periodic cash flow (such as rent) and a projected sale at the end of the holding period. It represents the expected annualized return, accounting for income, expenses, and the recovery of capital through a future sale.
Purchase Details
Purchase PriceThe price paid for the property. Purchase price:
| $1,395,000 |
|---|---|
Amount FinancedThe amount of the purchase financed through a loan. Amount financed:
| -$1,116,000 |
Down paymentThe initial payment made towards the purchase. Down payment:
| $279,000 |
Closing CostsFees and expenses associated with purchasing a property, typically ranging from 2% to 5% of the home’s purchase price, paid at the end of a home purchase to cover services like lending, title transfer, and taxes. Closing costs:
| $41,850 |
Rehab CostsCosts incurred to repair or improve the property, including: roof, flooring, exterior siding, kitchen, exterior paint, bathrooms, etc. Rehab costs:
| $0 |
Initial Cash InvestedThe total initial cash invested in the property. Calculation:Down payment + Buying costs + Rehab costs Initial cash invested:
| $320,850 |
Square Feet (SQFT)The total square footage of the property. Square feet:
| 4,472 |
Cost Per Square FootCost per square foot of the property. Calculation:Purchase Price / Square Feet Cost per square foot:
| $312 |
Monthly Rent Per Square FootMonthly rent divided by the number of square feet. This ratio helps investors compare rental income efficiency across properties, markets, and unit sizes Calculation:Monthly Rent / Square Feet Monthly rent per square foot:
| $1.23 |
Financing Details
Loan AmountThe total sum of money borrowed from a lender to finance a property purchase. Calculation:Purchase Price - Down Payment
Loan amount:
| $1,116,000 |
|---|---|
Loan to Value Ratio (LTV)Loan amount divided by the market value of the property. Calculation:Loan Amount / Market Value
Loan to value ratio:
| 80.0% |
Loan TypeThe type of loan (e.g., fixed, adjustable).
Loan type:
| Amortizing |
TermThe loan repayment period in years.
Term:
| 30 years |
Interest RateThe percentage a lender charges on the borrowed amount of a loan, determining the cost of borrowing money.
Interest rate:
| 6.810% |
Principal & Interest (PI)The principal is the portion of the loan payment that reduces the loan balance. The interest is the lender's charge for borrowing money. Calculation:(P * r * (1 + r) ** n) / ((1 + r) ** n - 1) Where:
P = Loan amount (principal)
Principal & interest:
| $7,283 |
Property TaxesAnnual taxes levied by local governments on real estate properties. These taxes fund public services like schools, roads, and emergency services. Calculation:Assumes 12% of gross rental income, unless public tax records are available.
Property tax:
| $1,118 |
InsuranceThe costs for insurance coverage to protect against financial losses due to risks like fire, natural disasters, theft, liability, or tenant-related damages. Calculation:Assumes 7% of gross rental income, unless insurance rates are specified.
Insurance:
| $385 |
Private Mortgage Insurance (PMI)A fee that borrowers pay when they take out a conventional loan with a loan-to-value (LTV) ratio above 80%.
Private mortgage insurance (PMI):
| $0 |
Monthly PaymentThe fixed amount a borrower pays each month to repay a loan. It typically includes principal and interest (P&I) and may also cover property taxes, insurance, HOA fees, and PMI if escrowed. Monthly payment:
| $8,786 |
Operating Income
| % Rent | Monthly | Yearly | |
|---|---|---|---|
Gross RentThe total rental income received from tenants before deducting any expenses. Includes base rent, late fees, pet fees, parking fees, and other recurring charges.
Gross rent:
| $5,500 | $66,000 | |
Vacancy LossExpected loss of rent due to vacancies.
Vacancy loss:
(6%)
| 6% | -$330 | -$3,960 |
Operating IncomeGross rental income minus vacancy loss. Calculation:Gross rent - Vacancy loss
Operating income:
| $5,170 | $62,040 |
Operating Expenses
| % Rent | Monthly | Yearly | |
|---|---|---|---|
Property TaxesAnnual taxes levied by local governments on real estate properties. These taxes fund public services like schools, roads, and emergency services. Calculation:Assumes 12% of gross rental income, unless public tax records are available. | 20% | -$1,118 | -$13,412 |
InsuranceThe costs for insurance coverage to protect against financial losses due to risks like fire, natural disasters, theft, liability, or tenant-related damages. Calculation:Assumes 7% of gross rental income, unless insurance rates are specified. | 7% | -$385 | -$4,620 |
Property ManagementThe costs associated with hiring a property manager to handle the day-to-day operations of a rental property. Includes management fees, leasing fes, eviction fees, etc. Calculation:Assumes 8% of gross rental income. | 8% | -$440 | -$5,280 |
Repairs & MaintenanceOngoing costs for routine upkeep and minor fixes needed to keep a property in good working condition. Calculation:Assumes 5% of gross rental income. Varies by property age and condition. | 5% | -$275 | -$3,300 |
Capital ExpensesLarge, infrequent costs for major improvements or replacements, like a new roof, HVAC system, or appliances. Calculation:Assumes 5% of gross rental income. Varies by property age. | 5% | -$275 | -$3,300 |
HOA FeesRegular dues paid to a Homeowners Association for community maintenance, amenities, and management. Similar fees include: Condo Association Fees, Co-op Maintenance Fees, etc. Calculation:Assumes 0% gross rental income, unless specified.. | 1% | -$46 | -$552 |
Operating ExpensesRecurring costs required to maintain and manage a rental property, including property taxes, insurance, maintenance, repairs, utilities (if paid by the owner), property management fees, and other day-to-day expenses. Calculation:Insurance + Property Taxes + Property Management + Repairs & Maintenance + Capital Expenditures + HOA Fees | 46% | -$2,539 | -$30,464 |
Cash Flow
| Monthly | Yearly | |
|---|---|---|
Net Operating Income (NOI)The income generated from a property after deducting all operating expenses but before deducting mortgage payments, taxes, and capital expenditures. Calculation:Gross Operating Income - Operating Expenses
Net operating income:
| $2,631 | $31,572 |
Mortgage PaymentThe fixed amount a borrower pays each month to repay a loan. It typically includes principal and interest (P&I) and may also cover property taxes, insurance, HOA fees, and PMI if escrowed. | -$7,283 | -$87,396 |
Cash FlowNet Operating Income (NOI) minus mortgage payments. Calculation:NOI - Mortgage Payments | $4,652 | $55,824 |