$539,000
Investment Summary
- Monthly Cash Flow
- -$1,407
- Cap Rate
- 3.0%
- Cash-on-Cash Return
- -13.6%
- Debt Coverage Ratio
- 0.49
- Internal Rate of Return (5 years)
- -9.2%
Cash Flow
Net Operating Income (NOI) minus mortgage payments.
Calculation:
NOI - Mortgage Payments
Cap Rate (Market Value)
Capitalization Rate is a rate of return that compares the yearly Net Operating Income (NOI) to the market value.
Calculation:
NOI / Market Value
Cash-on-Cash Return (CoC)
Annual Cash Flow / Cash Invested
Calculation:
Annual cash flow divided by initial cash invested.
Debt Coverage Ratio (DCR)
Net Operating Income (NOI) divided by total debt payments.
Calculation:
NOI / Total Debt Payments
Internal Rate of Return (IRR)
A metric for assessing profitability over time. IRR is the discount rate at which the net present value (NPV) of all future cash flows (positive and negative) from an investment equals zero — including both periodic cash flow (such as rent) and a projected sale at the end of the holding period. It represents the expected annualized return, accounting for income, expenses, and the recovery of capital through a future sale.
Property Description
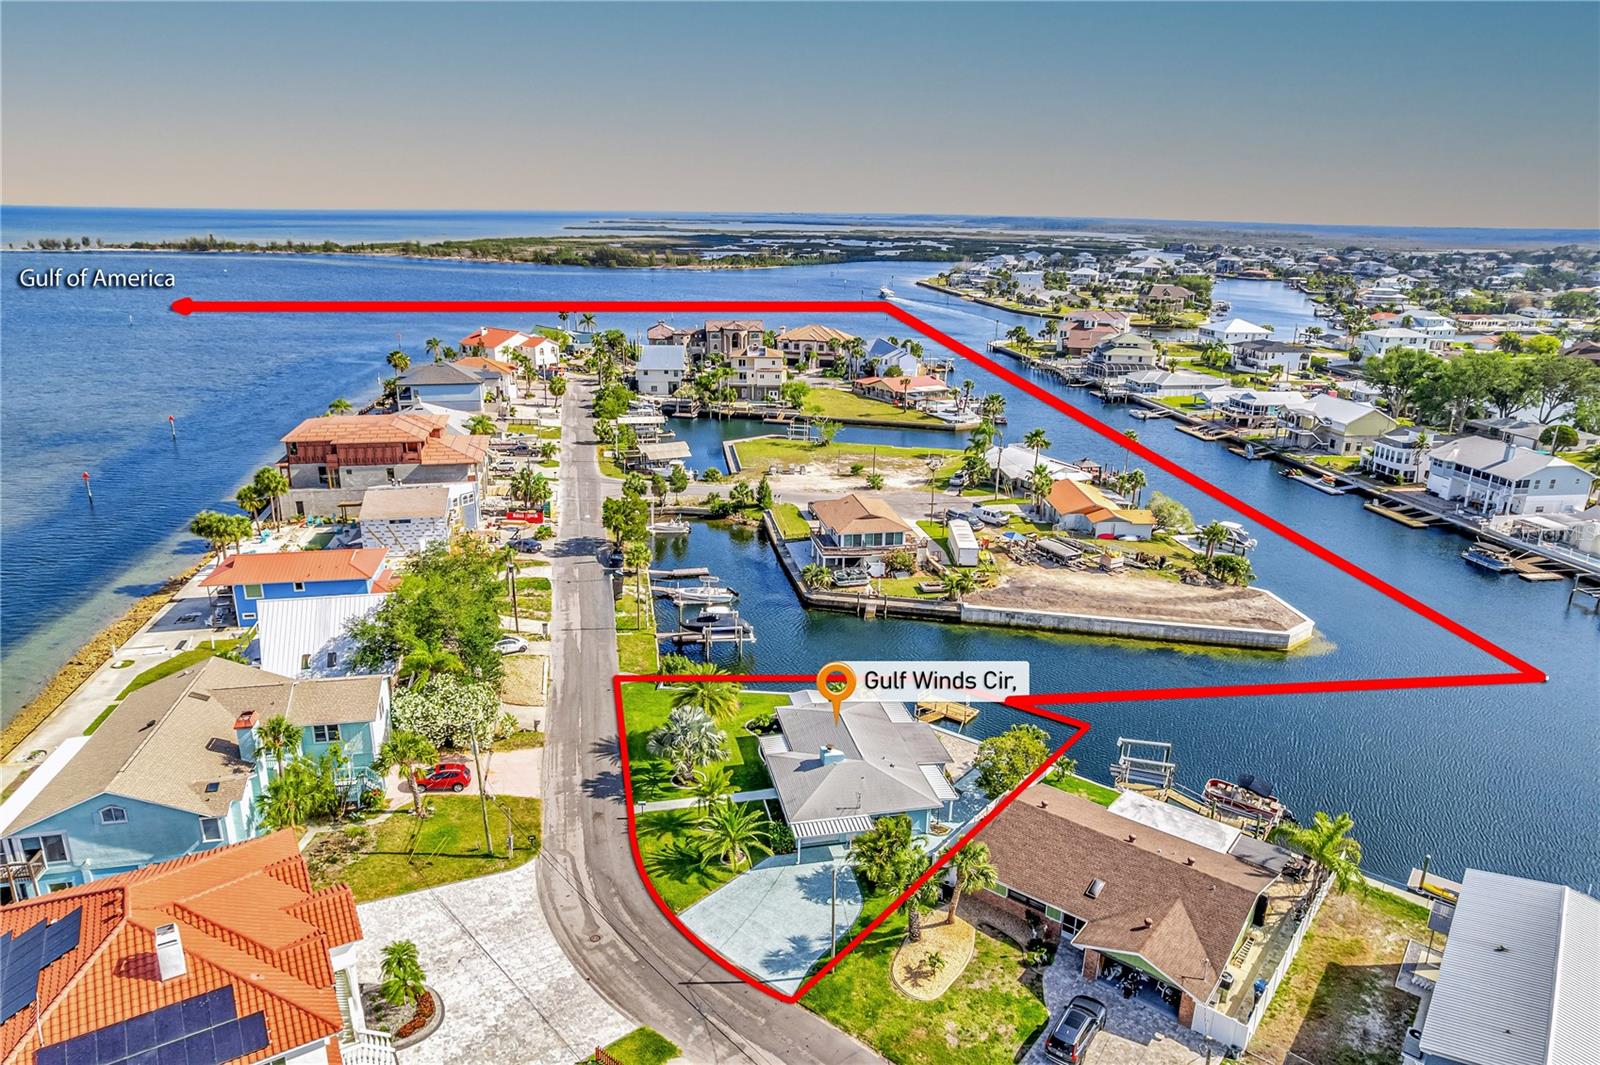
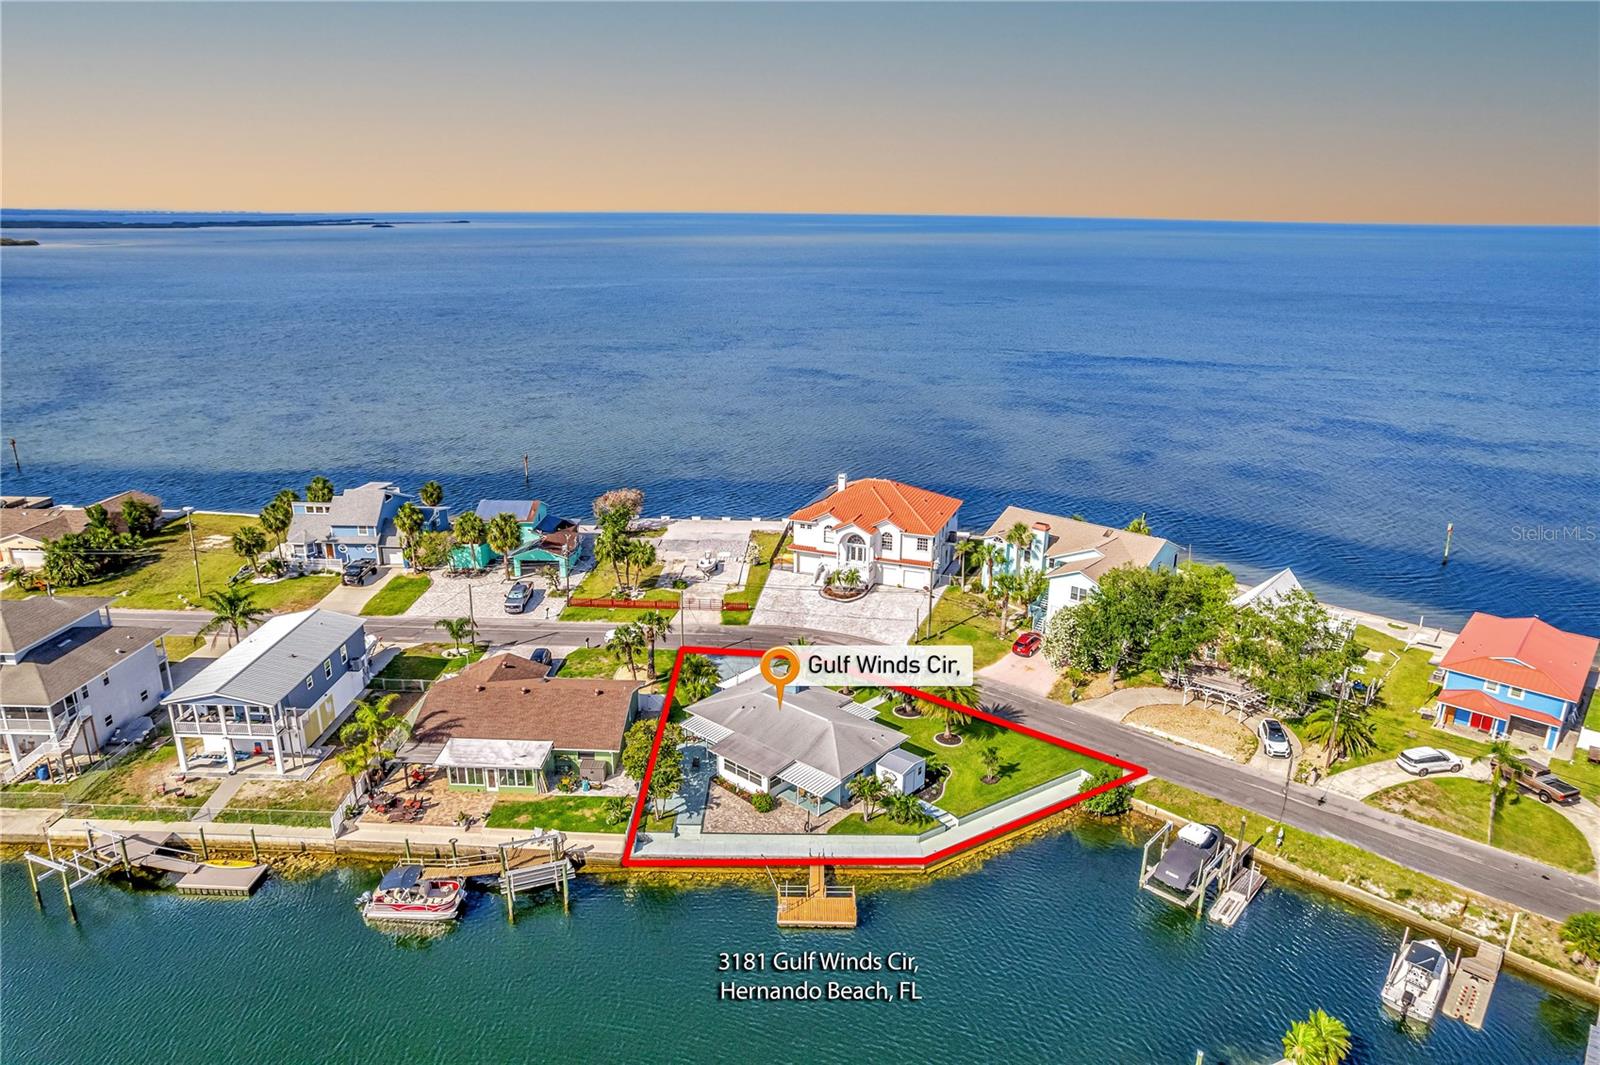
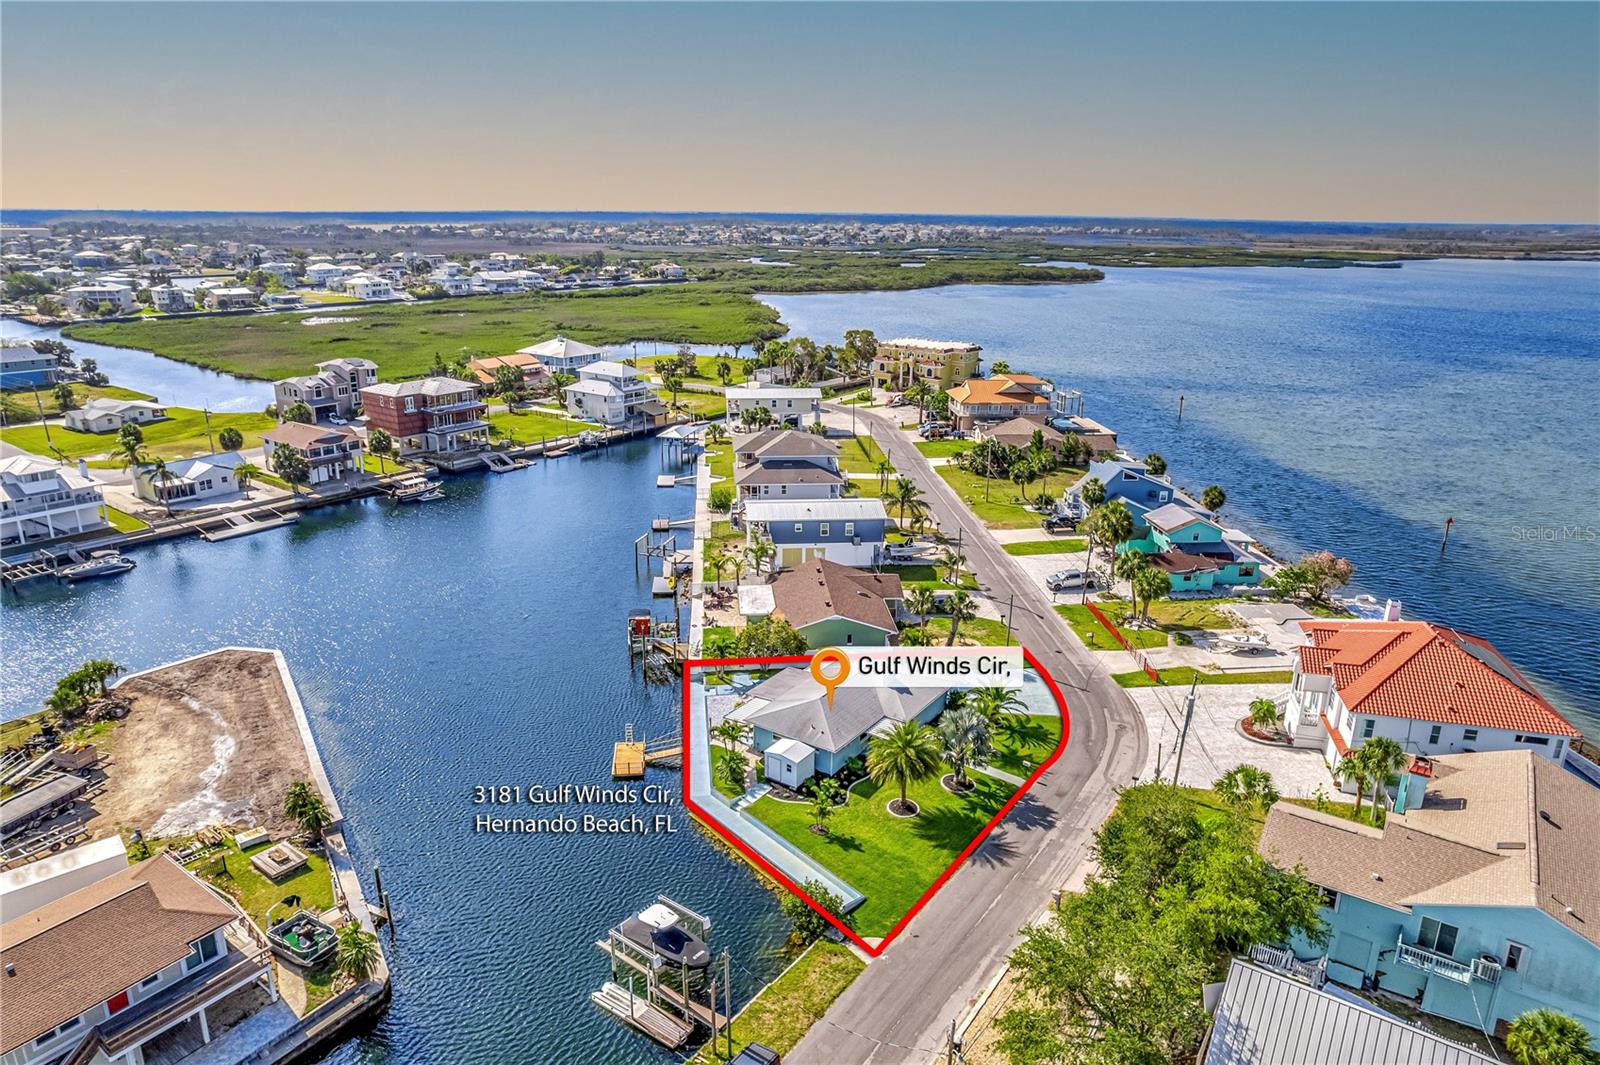
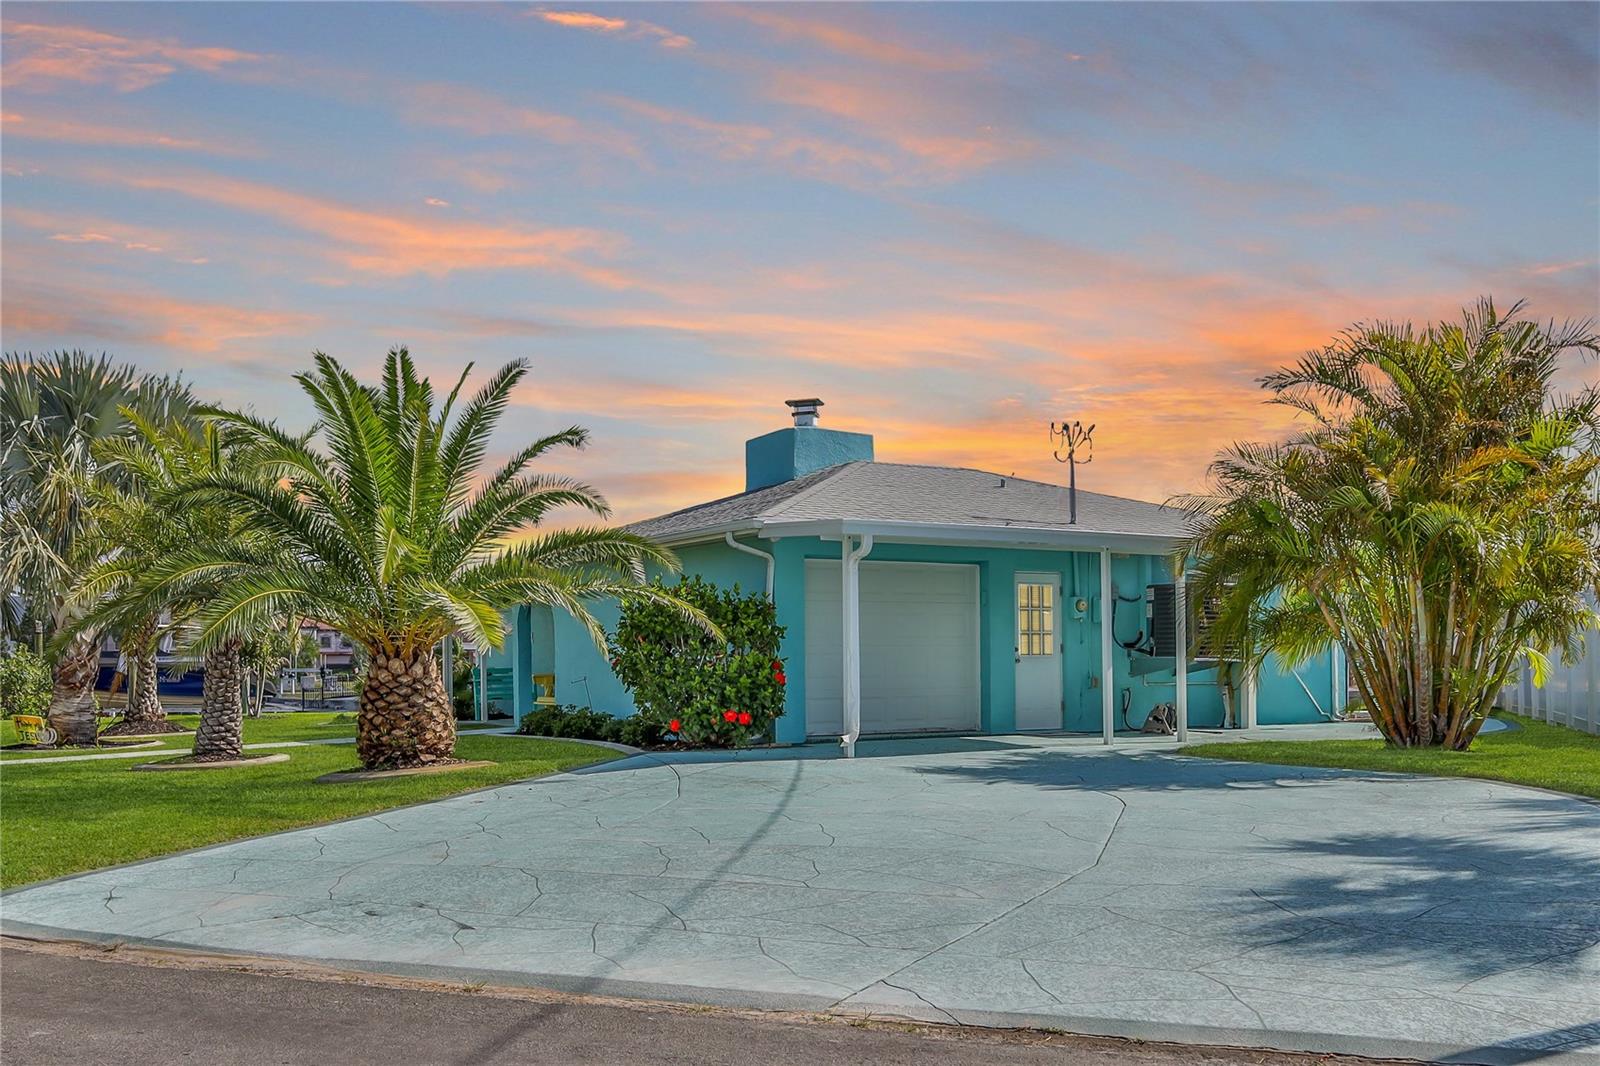
Location, Location & Premium Waterfront Location! Welcome to your slice of Florida paradise. This beautifully remodeled waterfront home offers direct deep-water Gulf access, no HOA, and no rental restrictions—perfect as a full-time residence, seasonal getaway, or income-producing vacation rental. Located on serene Dolphin Bay, just off the main channel, the property features 128 feet of waterfront with low boat traffic—ideal for larger vessels, jet skis, and kayaks. A new seawall (2019) with a knee wall platform and floating dock ensures convenient water access. From your expansive covered patio, enjoy tranquil views and even the occasional visit from playful dolphins. Step inside to an air-conditioned, glass-enclosed lanai adding 120 square feet of year-round enjoyment. Two covered patios lead to a pavered backyard extending to the seawall—an entertainer’s dream. Enjoy four insulated awning extensions providing shade throughout the year, a carport extension for your golf cart or water toys, and a freshly resurfaced driveway with space for three vehicles. Inside, the split floor plan offers comfort and functionality with ceramic tile flooring, abundant natural light, and a cozy faux-stone wood-burning fireplace. The kitchen boasts new LG stainless appliances, Quartz countertops, a tile backsplash, and updated lower cabinets. Both bathrooms have modern vanities. The one-car garage includes a 2019 epoxy-painted floor, insulated garage door, A/C venting, and washer/dryer hookups, while still functioning fully for car storage. Additional updates include a 2024 A/C system, 2023 exterior stucco and paint, a front porch seating area, a storage shed, and freshly updated landscaping featuring palm trees, Curb-A-Lawn edging, new sod, and full irrigation. Though the home experienced water intrusion during Hurricane Helene, it has been fully restored with all permits finalized. A prepaid and assumable FEMA flood insurance policy is valid through October 2027 for added peace of mind. Unbeatable Location & Community Directly across from the Gulf of Mexico, enjoy breathtaking sunrises and sunsets, with nearby attractions like Weeki Wachee Springs, Buccaneer Bay Waterpark, and endless kayaking and fishing spots. Hernando Beach offers a relaxed, golf cart-friendly lifestyle with local marinas, restaurants, shops, parks, and access to the 14-Lake Preserve. Outdoor enthusiasts will appreciate inshore/offshore fishing, scalloping, spearfishing, and access to nature preserves perfect for hiking and water sports. Known as “Tarpon Country,” this region is a fisherman’s dream. While tucked away in a peaceful coastal community, you’re just minutes from SR 50 and US 19, with quick access to shopping, hospitals, and the Suncoast Parkway for an easy commute. Embrace the Central Florida lifestyle with proximity to Tampa attractions, theme parks, professional sports, cruise ports, museums, and world-class beaches like Clearwater. This move-in-ready waterfront retreat truly offers it all—comfort, location, flexibility, and lifestyle. Schedule your private showing today!
Build Your Team
Quickly find investor-friendly professionals who can help you succeed in real estate investing at any stage of the investing journey.


Agents
Match with investor-friendly agents who can help you find, analyze, and close your next deal


Lenders
Get the best funding…find investor-friendly lenders who specialize in your deal strategy


Property Managers
Transition to passive investing. Find a trusted property management partnership that lasts.


Tax Pros & Accountants
Taxes and financial reporting made easy—find experts to create tax savings strategies, file taxes, and more
Location
Property Details
Parking
- Description: Garage Door Opener, In Garage
- Details: Garage Door Opener, Attached
- Garage Spaces: 1
- Spaces Total: 0
Bedroom Information
- # of Bedrooms: 2
Bathroom Information
- # of Baths (Full): 2
- # of Baths (Total): 2.0
Interior Features
- # of Rooms: 3
- # of Stories: 1
- Fireplace: Yes
Exterior Features
- Exterior Walls Materials: Stucco
- Foundation: Slab
- Roof Type: Gable or Hip
- Roof Material: Shingle
Land Information
- Land Use: Residential
- Land Use Subtype: Single Family Residential
Lot Information
- Parcel ID: R1222316190000000370
- Lot Size: 7866 sqft
Property Information
- Property Type: Single Family Residence
- Year Built: 1972
Tax Information
- Annual Tax: $2,793
Utilities
- Water & Sewer: Public
- Heating: Central, Electric
- Cooling: Central Air
Location
- County: Hernando
Listing Details
Investment Summary
- Monthly Cash Flow
- -$1,407
- Cap Rate
- 3.0%
- Cash-on-Cash Return
- -13.6%
- Debt Coverage Ratio
- 0.49
- Internal Rate of Return (5 years)
- -9.2%
Cash Flow
Net Operating Income (NOI) minus mortgage payments.
Calculation:
NOI - Mortgage Payments
Cap Rate (Market Value)
Capitalization Rate is a rate of return that compares the yearly Net Operating Income (NOI) to the market value.
Calculation:
NOI / Market Value
Cash-on-Cash Return (CoC)
Annual Cash Flow / Cash Invested
Calculation:
Annual cash flow divided by initial cash invested.
Debt Coverage Ratio (DCR)
Net Operating Income (NOI) divided by total debt payments.
Calculation:
NOI / Total Debt Payments
Internal Rate of Return (IRR)
A metric for assessing profitability over time. IRR is the discount rate at which the net present value (NPV) of all future cash flows (positive and negative) from an investment equals zero — including both periodic cash flow (such as rent) and a projected sale at the end of the holding period. It represents the expected annualized return, accounting for income, expenses, and the recovery of capital through a future sale.
Purchase Details
Purchase PriceThe price paid for the property. Purchase price:
| $539,000 |
|---|---|
Amount FinancedThe amount of the purchase financed through a loan. Amount financed:
| -$431,200 |
Down paymentThe initial payment made towards the purchase. Down payment:
| $107,800 |
Closing CostsFees and expenses associated with purchasing a property, typically ranging from 2% to 5% of the home’s purchase price, paid at the end of a home purchase to cover services like lending, title transfer, and taxes. Closing costs:
| $16,170 |
Rehab CostsCosts incurred to repair or improve the property, including: roof, flooring, exterior siding, kitchen, exterior paint, bathrooms, etc. Rehab costs:
| $0 |
Initial Cash InvestedThe total initial cash invested in the property. Calculation:Down payment + Buying costs + Rehab costs Initial cash invested:
| $123,970 |
Square Feet (SQFT)The total square footage of the property. Square feet:
| 1,397 |
Cost Per Square FootCost per square foot of the property. Calculation:Purchase Price / Square Feet Cost per square foot:
| $386 |
Monthly Rent Per Square FootMonthly rent divided by the number of square feet. This ratio helps investors compare rental income efficiency across properties, markets, and unit sizes Calculation:Monthly Rent / Square Feet Monthly rent per square foot:
| $1.65 |
Financing Details
Loan AmountThe total sum of money borrowed from a lender to finance a property purchase. Calculation:Purchase Price - Down Payment
Loan amount:
| $431,200 |
|---|---|
Loan to Value Ratio (LTV)Loan amount divided by the market value of the property. Calculation:Loan Amount / Market Value
Loan to value ratio:
| 80.0% |
Loan TypeThe type of loan (e.g., fixed, adjustable).
Loan type:
| Amortizing |
TermThe loan repayment period in years.
Term:
| 30 years |
Interest RateThe percentage a lender charges on the borrowed amount of a loan, determining the cost of borrowing money.
Interest rate:
| 6.625% |
Principal & Interest (PI)The principal is the portion of the loan payment that reduces the loan balance. The interest is the lender's charge for borrowing money. Calculation:(P * r * (1 + r) ** n) / ((1 + r) ** n - 1) Where:
P = Loan amount (principal)
Principal & interest:
| $2,761 |
Property TaxesAnnual taxes levied by local governments on real estate properties. These taxes fund public services like schools, roads, and emergency services.
Property tax:
| $233 |
InsuranceThe costs for insurance coverage to protect against financial losses due to risks like fire, natural disasters, theft, liability, or tenant-related damages. Calculation:Assumes 7% of gross rental income, unless insurance rates are specified.
Insurance:
| $161 |
Private Mortgage Insurance (PMI)A fee that borrowers pay when they take out a conventional loan with a loan-to-value (LTV) ratio above 80%.
Private mortgage insurance (PMI):
| $0 |
Monthly PaymentThe fixed amount a borrower pays each month to repay a loan. It typically includes principal and interest (P&I) and may also cover property taxes, insurance, HOA fees, and PMI if escrowed. Monthly payment:
| $3,155 |
Operating Income
| % Rent | Monthly | Yearly | |
|---|---|---|---|
Gross RentThe total rental income received from tenants before deducting any expenses. Includes base rent, late fees, pet fees, parking fees, and other recurring charges.
Gross rent:
| $2,300 | $27,600 | |
Vacancy LossExpected loss of rent due to vacancies.
Vacancy loss:
(6%)
| 6% | -$138 | -$1,656 |
Operating IncomeGross rental income minus vacancy loss. Calculation:Gross rent - Vacancy loss
Operating income:
| $2,162 | $25,944 |
Operating Expenses
| % Rent | Monthly | Yearly | |
|---|---|---|---|
Property TaxesAnnual taxes levied by local governments on real estate properties. These taxes fund public services like schools, roads, and emergency services. | 10% | -$233 | -$2,793 |
InsuranceThe costs for insurance coverage to protect against financial losses due to risks like fire, natural disasters, theft, liability, or tenant-related damages. Calculation:Assumes 7% of gross rental income, unless insurance rates are specified. | 7% | -$161 | -$1,932 |
Property ManagementThe costs associated with hiring a property manager to handle the day-to-day operations of a rental property. Includes management fees, leasing fes, eviction fees, etc. Calculation:Assumes 8% of gross rental income. | 8% | -$184 | -$2,208 |
Repairs & MaintenanceOngoing costs for routine upkeep and minor fixes needed to keep a property in good working condition. Calculation:Assumes 5% of gross rental income. Varies by property age and condition. | 5% | -$115 | -$1,380 |
Capital ExpensesLarge, infrequent costs for major improvements or replacements, like a new roof, HVAC system, or appliances. Calculation:Assumes 5% of gross rental income. Varies by property age. | 5% | -$115 | -$1,380 |
HOA FeesRegular dues paid to a Homeowners Association for community maintenance, amenities, and management. Similar fees include: Condo Association Fees, Co-op Maintenance Fees, etc. | n/a | n/a | n/a |
Operating ExpensesRecurring costs required to maintain and manage a rental property, including property taxes, insurance, maintenance, repairs, utilities (if paid by the owner), property management fees, and other day-to-day expenses. Calculation:Insurance + Property Taxes + Property Management + Repairs & Maintenance + Capital Expenditures + HOA Fees | 35% | -$808 | -$9,693 |
Cash Flow
| Monthly | Yearly | |
|---|---|---|
Net Operating Income (NOI)The income generated from a property after deducting all operating expenses but before deducting mortgage payments, taxes, and capital expenditures. Calculation:Gross Operating Income - Operating Expenses
Net operating income:
| $1,354 | $16,248 |
Mortgage PaymentThe fixed amount a borrower pays each month to repay a loan. It typically includes principal and interest (P&I) and may also cover property taxes, insurance, HOA fees, and PMI if escrowed. | -$2,761 | -$33,132 |
Cash FlowNet Operating Income (NOI) minus mortgage payments. Calculation:NOI - Mortgage Payments | $1,407 | $16,884 |