$2,985,000
Investment Summary
- Monthly Cash Flow
- -$13,806
- Cap Rate
- 0.7%
- Cash-on-Cash Return
- -24.1%
- Debt Coverage Ratio
- 0.12
- Internal Rate of Return (5 years)
- -19.3%
Cash Flow
Net Operating Income (NOI) minus mortgage payments.
Calculation:
NOI - Mortgage Payments
Cap Rate (Market Value)
Capitalization Rate is a rate of return that compares the yearly Net Operating Income (NOI) to the market value.
Calculation:
NOI / Market Value
Cash-on-Cash Return (CoC)
Annual Cash Flow / Cash Invested
Calculation:
Annual cash flow divided by initial cash invested.
Debt Coverage Ratio (DCR)
Net Operating Income (NOI) divided by total debt payments.
Calculation:
NOI / Total Debt Payments
Internal Rate of Return (IRR)
A metric for assessing profitability over time. IRR is the discount rate at which the net present value (NPV) of all future cash flows (positive and negative) from an investment equals zero — including both periodic cash flow (such as rent) and a projected sale at the end of the holding period. It represents the expected annualized return, accounting for income, expenses, and the recovery of capital through a future sale.
Property Description
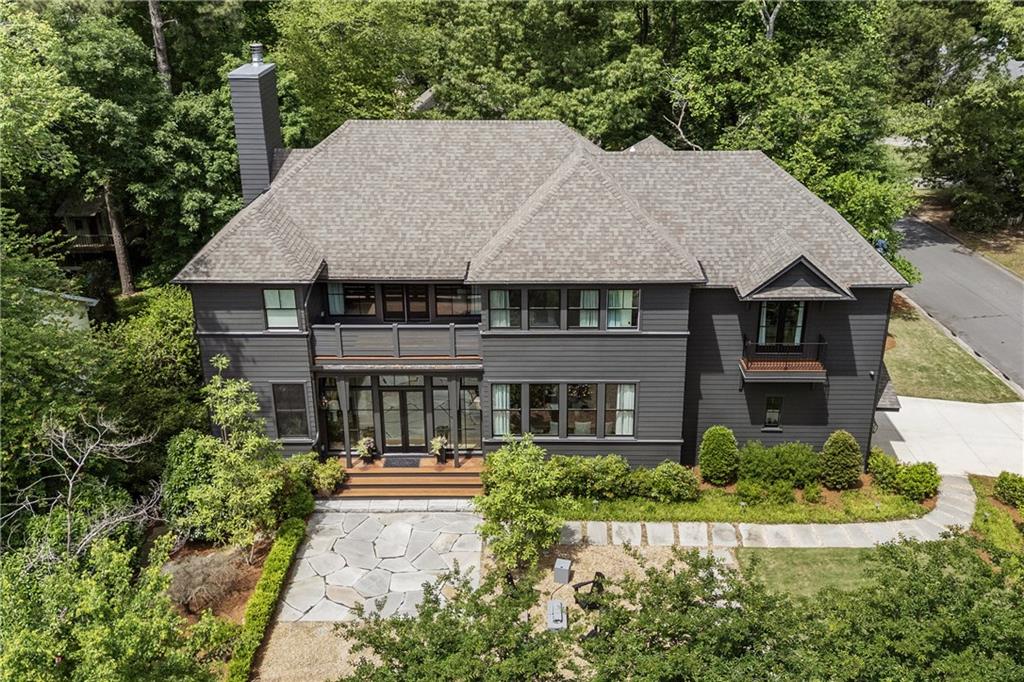
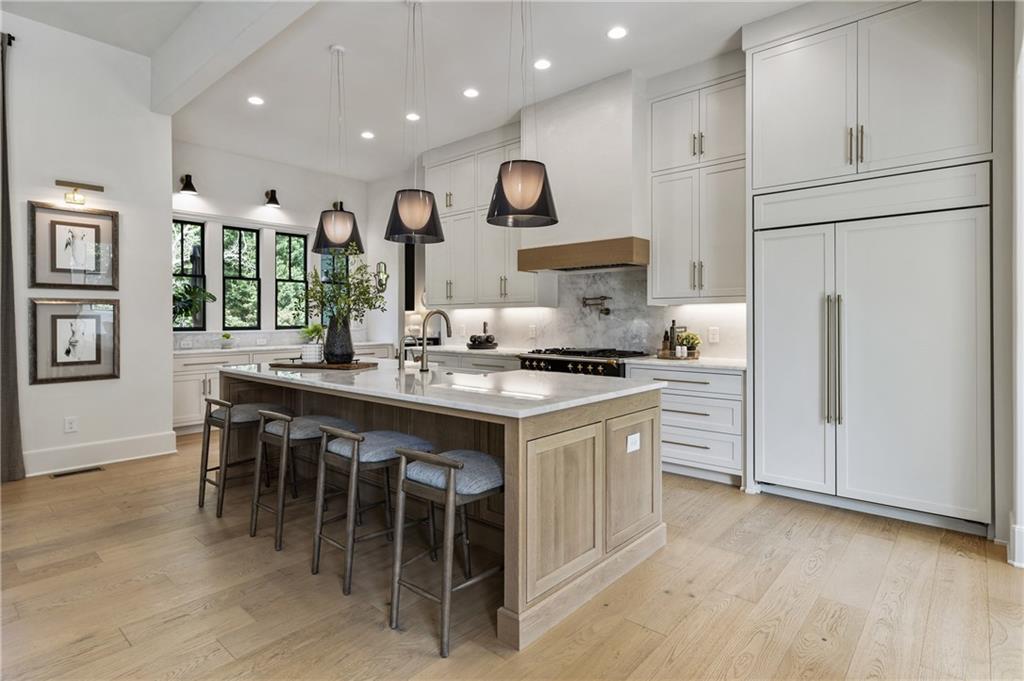
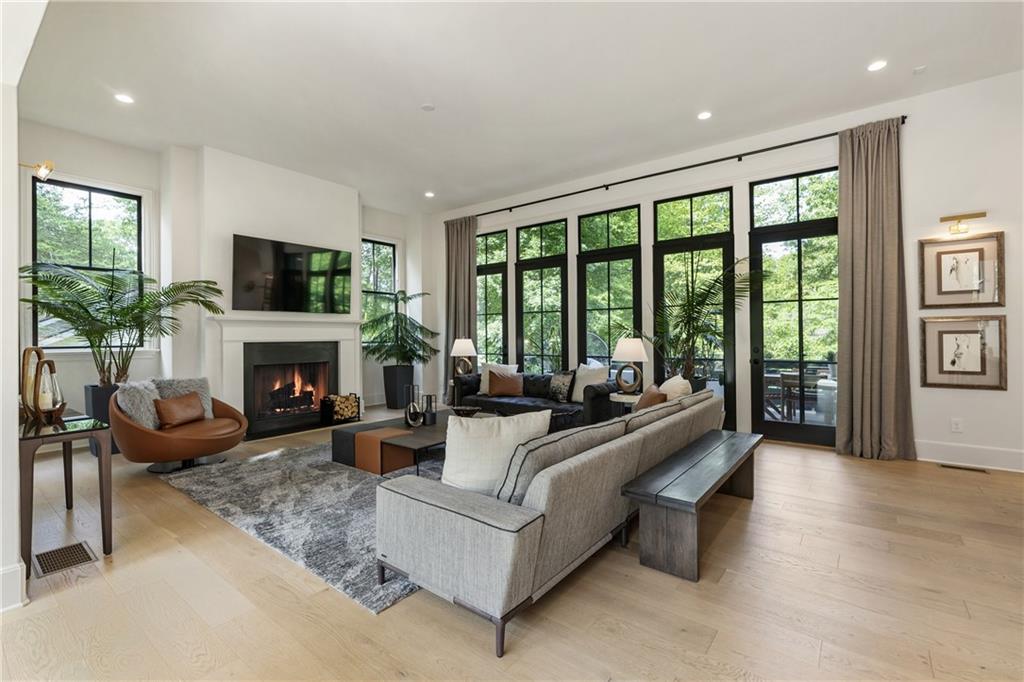
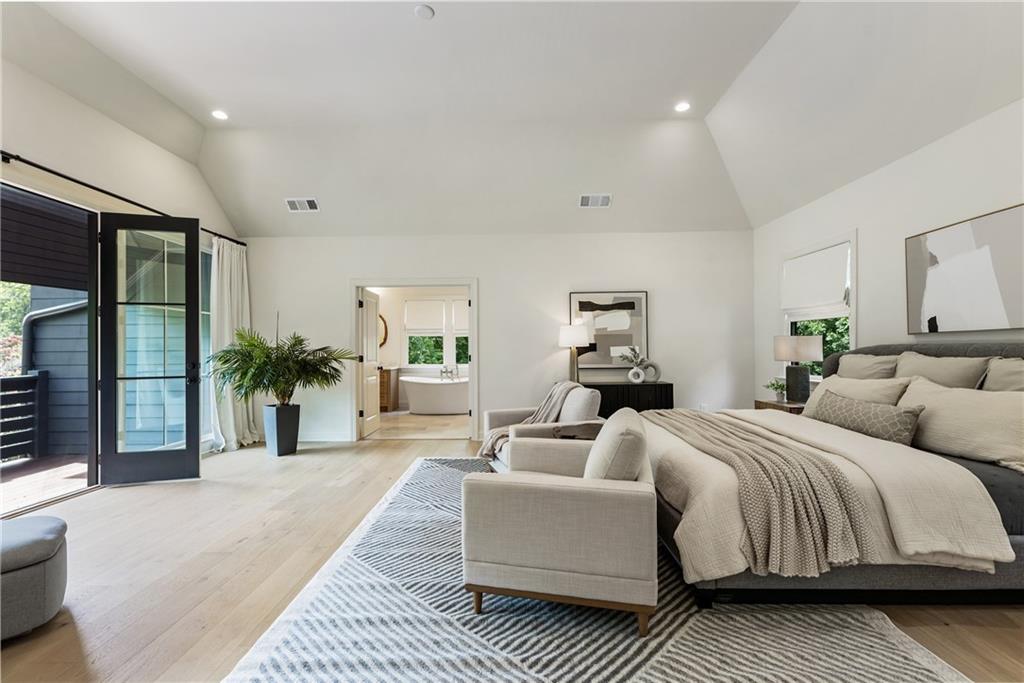
Architectural Elegance Meets Garden District Charm in Downtown Alpharetta. The custom home that turns heads and stops traffic is now available! Designed by acclaimed architect Lew Oliver and crafted by Hedgewood Homes, one of Atlanta's premier builders, this one-of-a-kind residence offers timeless sophistication in the heart of the Garden District-just moments from the vibrant Downtown Alpharetta scene. From the moment you approach, the professionally landscaped private courtyard invites fireside conversations and serene moments. Six dramatic floor-to-ceiling windows and doors frame the light-filled foyer, flanked by a formal dining room with elevated windows that strike the perfect balance between light and privacy. This is not your typical floor plan-it's a statement of style and craftsmanship. Soaring 12-foot ceilings, wide-plank white oak hardwood floors, and 10-foot transom windows create a seamless blend of natural light, warmth, and architectural elegance. The spacious family room with wood-burning fireplace opens to a dedicated office behind French doors, offering tranquil courtyard views. At the heart of the home, the kitchen is a showstopper-featuring a marble top island, custom inset wood cabinetry, LaCanche 43" gas range with pot filler, paneled 48" Sub-Zero refrigerator, and a fully outfitted scullery with a second dishwasher, sink, and additional storage. Venture outside through French doors to your private rear deck-a peaceful haven for alfresco dining and morning coffee, overlooking the flat, grassy backyard with endless potential for a pool, extra garages with guest house. Upstairs, the luxurious primary suite includes a sitting area and a private covered balcony. The spa-inspired bath boasts marble flooring, a soaking tub, dual walk-in shower heads, a towel warmer, and custom dual vanities-alongside an expansive custom closet. Three additional ensuite bedrooms feature marble tile and countertops, walk-in closets, and designer finishes. The laundry room offers ample cabinetry, sink, and storage. The finished daylight terrace level includes a private entrance-perfect for an au pair, in-law suite, or guest retreat-with a kitchenette, living/media room, two bedrooms, two full baths, and generous unfinished storage space. Additional highlights include: Corner lot, mudroom with built-ins, powder room on main flat, private backyard-pool-ready, Sought-after Garden District location, Easy access to Downtown Alpharetta shops, restaurants, music events, farmers markets, and more! This is more than a home-it's a true work of art in a location that can't be beaten.
Build Your Team
Quickly find investor-friendly professionals who can help you succeed in real estate investing at any stage of the investing journey.


Agents
Match with investor-friendly agents who can help you find, analyze, and close your next deal


Lenders
Get the best funding…find investor-friendly lenders who specialize in your deal strategy


Property Managers
Transition to passive investing. Find a trusted property management partnership that lasts.


Tax Pros & Accountants
Taxes and financial reporting made easy—find experts to create tax savings strategies, file taxes, and more
Location
Property Details
Parking
- Details: Attached, Garage, Garage Door Opener, Garage Faces Side, Electric Vehicle Charging Station(s), Driveway
- Garage Spaces: 2
- Spaces Total: 4
Bedroom Information
- # of Bedrooms: 6
Bathroom Information
- # of Baths (Full): 6
- # of Baths (Partial): 1
- # of Baths (Total): 7.0
Interior Features
- # of Rooms: 7
- # of Stories: 3
- Basement: Yes
- Basement Description: Daylight, Exterior Entry, Finished, Full, Interior Entry
- Fireplace: Yes
Exterior Features
- Exterior Walls Materials: Wood
- Foundation: Concrete Perimeter
- Roof Material: Composition, Shingle
Land Information
- Land Use: Residential
- Land Use Subtype: Single Family Residential
Lot Information
- Parcel ID: 22481111790628
- Lot Size: 0 sqft
Property Information
- Property Type: Single Family Residence
- Style: Modern, Traditional
- Year Built: 2022
Tax Information
- Annual Tax: $14,327
Utilities
- Water & Sewer: Public
- Heating: Central, Natural Gas, Zoned
- Cooling: Ceiling Fan(s), Central Air, Zoned
Location
- County: Fulton
Listing Details
Investment Summary
- Monthly Cash Flow
- -$13,806
- Cap Rate
- 0.7%
- Cash-on-Cash Return
- -24.1%
- Debt Coverage Ratio
- 0.12
- Internal Rate of Return (5 years)
- -19.3%
Cash Flow
Net Operating Income (NOI) minus mortgage payments.
Calculation:
NOI - Mortgage Payments
Cap Rate (Market Value)
Capitalization Rate is a rate of return that compares the yearly Net Operating Income (NOI) to the market value.
Calculation:
NOI / Market Value
Cash-on-Cash Return (CoC)
Annual Cash Flow / Cash Invested
Calculation:
Annual cash flow divided by initial cash invested.
Debt Coverage Ratio (DCR)
Net Operating Income (NOI) divided by total debt payments.
Calculation:
NOI / Total Debt Payments
Internal Rate of Return (IRR)
A metric for assessing profitability over time. IRR is the discount rate at which the net present value (NPV) of all future cash flows (positive and negative) from an investment equals zero — including both periodic cash flow (such as rent) and a projected sale at the end of the holding period. It represents the expected annualized return, accounting for income, expenses, and the recovery of capital through a future sale.
Purchase Details
Purchase PriceThe price paid for the property. Purchase price:
| $2,985,000 |
|---|---|
Amount FinancedThe amount of the purchase financed through a loan. Amount financed:
| -$2,388,000 |
Down paymentThe initial payment made towards the purchase. Down payment:
| $597,000 |
Closing CostsFees and expenses associated with purchasing a property, typically ranging from 2% to 5% of the home’s purchase price, paid at the end of a home purchase to cover services like lending, title transfer, and taxes. Closing costs:
| $89,550 |
Rehab CostsCosts incurred to repair or improve the property, including: roof, flooring, exterior siding, kitchen, exterior paint, bathrooms, etc. Rehab costs:
| $0 |
Initial Cash InvestedThe total initial cash invested in the property. Calculation:Down payment + Buying costs + Rehab costs Initial cash invested:
| $686,550 |
Square Feet (SQFT)The total square footage of the property. Square feet:
| 5,381 |
Cost Per Square FootCost per square foot of the property. Calculation:Purchase Price / Square Feet Cost per square foot:
| $555 |
Monthly Rent Per Square FootMonthly rent divided by the number of square feet. This ratio helps investors compare rental income efficiency across properties, markets, and unit sizes Calculation:Monthly Rent / Square Feet Monthly rent per square foot:
| $0.82 |
Financing Details
Loan AmountThe total sum of money borrowed from a lender to finance a property purchase. Calculation:Purchase Price - Down Payment
Loan amount:
| $2,388,000 |
|---|---|
Loan to Value Ratio (LTV)Loan amount divided by the market value of the property. Calculation:Loan Amount / Market Value
Loan to value ratio:
| 80.0% |
Loan TypeThe type of loan (e.g., fixed, adjustable).
Loan type:
| Amortizing |
TermThe loan repayment period in years.
Term:
| 30 years |
Interest RateThe percentage a lender charges on the borrowed amount of a loan, determining the cost of borrowing money.
Interest rate:
| 6.850% |
Principal & Interest (PI)The principal is the portion of the loan payment that reduces the loan balance. The interest is the lender's charge for borrowing money. Calculation:(P * r * (1 + r) ** n) / ((1 + r) ** n - 1) Where:
P = Loan amount (principal)
Principal & interest:
| $15,648 |
Property TaxesAnnual taxes levied by local governments on real estate properties. These taxes fund public services like schools, roads, and emergency services.
Property tax:
| $1,194 |
InsuranceThe costs for insurance coverage to protect against financial losses due to risks like fire, natural disasters, theft, liability, or tenant-related damages. Calculation:Assumes 7% of gross rental income, unless insurance rates are specified.
Insurance:
| $308 |
Private Mortgage Insurance (PMI)A fee that borrowers pay when they take out a conventional loan with a loan-to-value (LTV) ratio above 80%.
Private mortgage insurance (PMI):
| $0 |
Monthly PaymentThe fixed amount a borrower pays each month to repay a loan. It typically includes principal and interest (P&I) and may also cover property taxes, insurance, HOA fees, and PMI if escrowed. Monthly payment:
| $17,150 |
Operating Income
| % Rent | Monthly | Yearly | |
|---|---|---|---|
Gross RentThe total rental income received from tenants before deducting any expenses. Includes base rent, late fees, pet fees, parking fees, and other recurring charges.
Gross rent:
| $4,400 | $52,800 | |
Vacancy LossExpected loss of rent due to vacancies.
Vacancy loss:
(6%)
| 6% | -$264 | -$3,168 |
Operating IncomeGross rental income minus vacancy loss. Calculation:Gross rent - Vacancy loss
Operating income:
| $4,136 | $49,632 |
Operating Expenses
| % Rent | Monthly | Yearly | |
|---|---|---|---|
Property TaxesAnnual taxes levied by local governments on real estate properties. These taxes fund public services like schools, roads, and emergency services. | 27% | -$1,194 | -$14,327 |
InsuranceThe costs for insurance coverage to protect against financial losses due to risks like fire, natural disasters, theft, liability, or tenant-related damages. Calculation:Assumes 7% of gross rental income, unless insurance rates are specified. | 7% | -$308 | -$3,696 |
Property ManagementThe costs associated with hiring a property manager to handle the day-to-day operations of a rental property. Includes management fees, leasing fes, eviction fees, etc. Calculation:Assumes 8% of gross rental income. | 8% | -$352 | -$4,224 |
Repairs & MaintenanceOngoing costs for routine upkeep and minor fixes needed to keep a property in good working condition. Calculation:Assumes 5% of gross rental income. Varies by property age and condition. | 5% | -$220 | -$2,640 |
Capital ExpensesLarge, infrequent costs for major improvements or replacements, like a new roof, HVAC system, or appliances. Calculation:Assumes 5% of gross rental income. Varies by property age. | 5% | -$220 | -$2,640 |
HOA FeesRegular dues paid to a Homeowners Association for community maintenance, amenities, and management. Similar fees include: Condo Association Fees, Co-op Maintenance Fees, etc. | n/a | n/a | n/a |
Operating ExpensesRecurring costs required to maintain and manage a rental property, including property taxes, insurance, maintenance, repairs, utilities (if paid by the owner), property management fees, and other day-to-day expenses. Calculation:Insurance + Property Taxes + Property Management + Repairs & Maintenance + Capital Expenditures + HOA Fees | 52% | -$2,294 | -$27,527 |
Cash Flow
| Monthly | Yearly | |
|---|---|---|
Net Operating Income (NOI)The income generated from a property after deducting all operating expenses but before deducting mortgage payments, taxes, and capital expenditures. Calculation:Gross Operating Income - Operating Expenses
Net operating income:
| $1,842 | $22,104 |
Mortgage PaymentThe fixed amount a borrower pays each month to repay a loan. It typically includes principal and interest (P&I) and may also cover property taxes, insurance, HOA fees, and PMI if escrowed. | -$15,648 | -$187,776 |
Cash FlowNet Operating Income (NOI) minus mortgage payments. Calculation:NOI - Mortgage Payments | $13,806 | $165,672 |