
$1,290,000
Investment Summary
- Monthly Cash Flow
- -$4,239
- Cap Rate
- 1.7%
- Cash-on-Cash Return
- -17.1%
- Debt Coverage Ratio
- 0.31
- Internal Rate of Return (5 years)
- -12.6%
Cash Flow
Net Operating Income (NOI) minus mortgage payments.
Calculation:
NOI - Mortgage Payments
Cap Rate (Market Value)
Capitalization Rate is a rate of return that compares the yearly Net Operating Income (NOI) to the market value.
Calculation:
NOI / Market Value
Cash-on-Cash Return (CoC)
Annual Cash Flow / Cash Invested
Calculation:
Annual cash flow divided by initial cash invested.
Debt Coverage Ratio (DCR)
Net Operating Income (NOI) divided by total debt payments.
Calculation:
NOI / Total Debt Payments
Internal Rate of Return (IRR)
A metric for assessing profitability over time. IRR is the discount rate at which the net present value (NPV) of all future cash flows (positive and negative) from an investment equals zero — including both periodic cash flow (such as rent) and a projected sale at the end of the holding period. It represents the expected annualized return, accounting for income, expenses, and the recovery of capital through a future sale.
Property Description
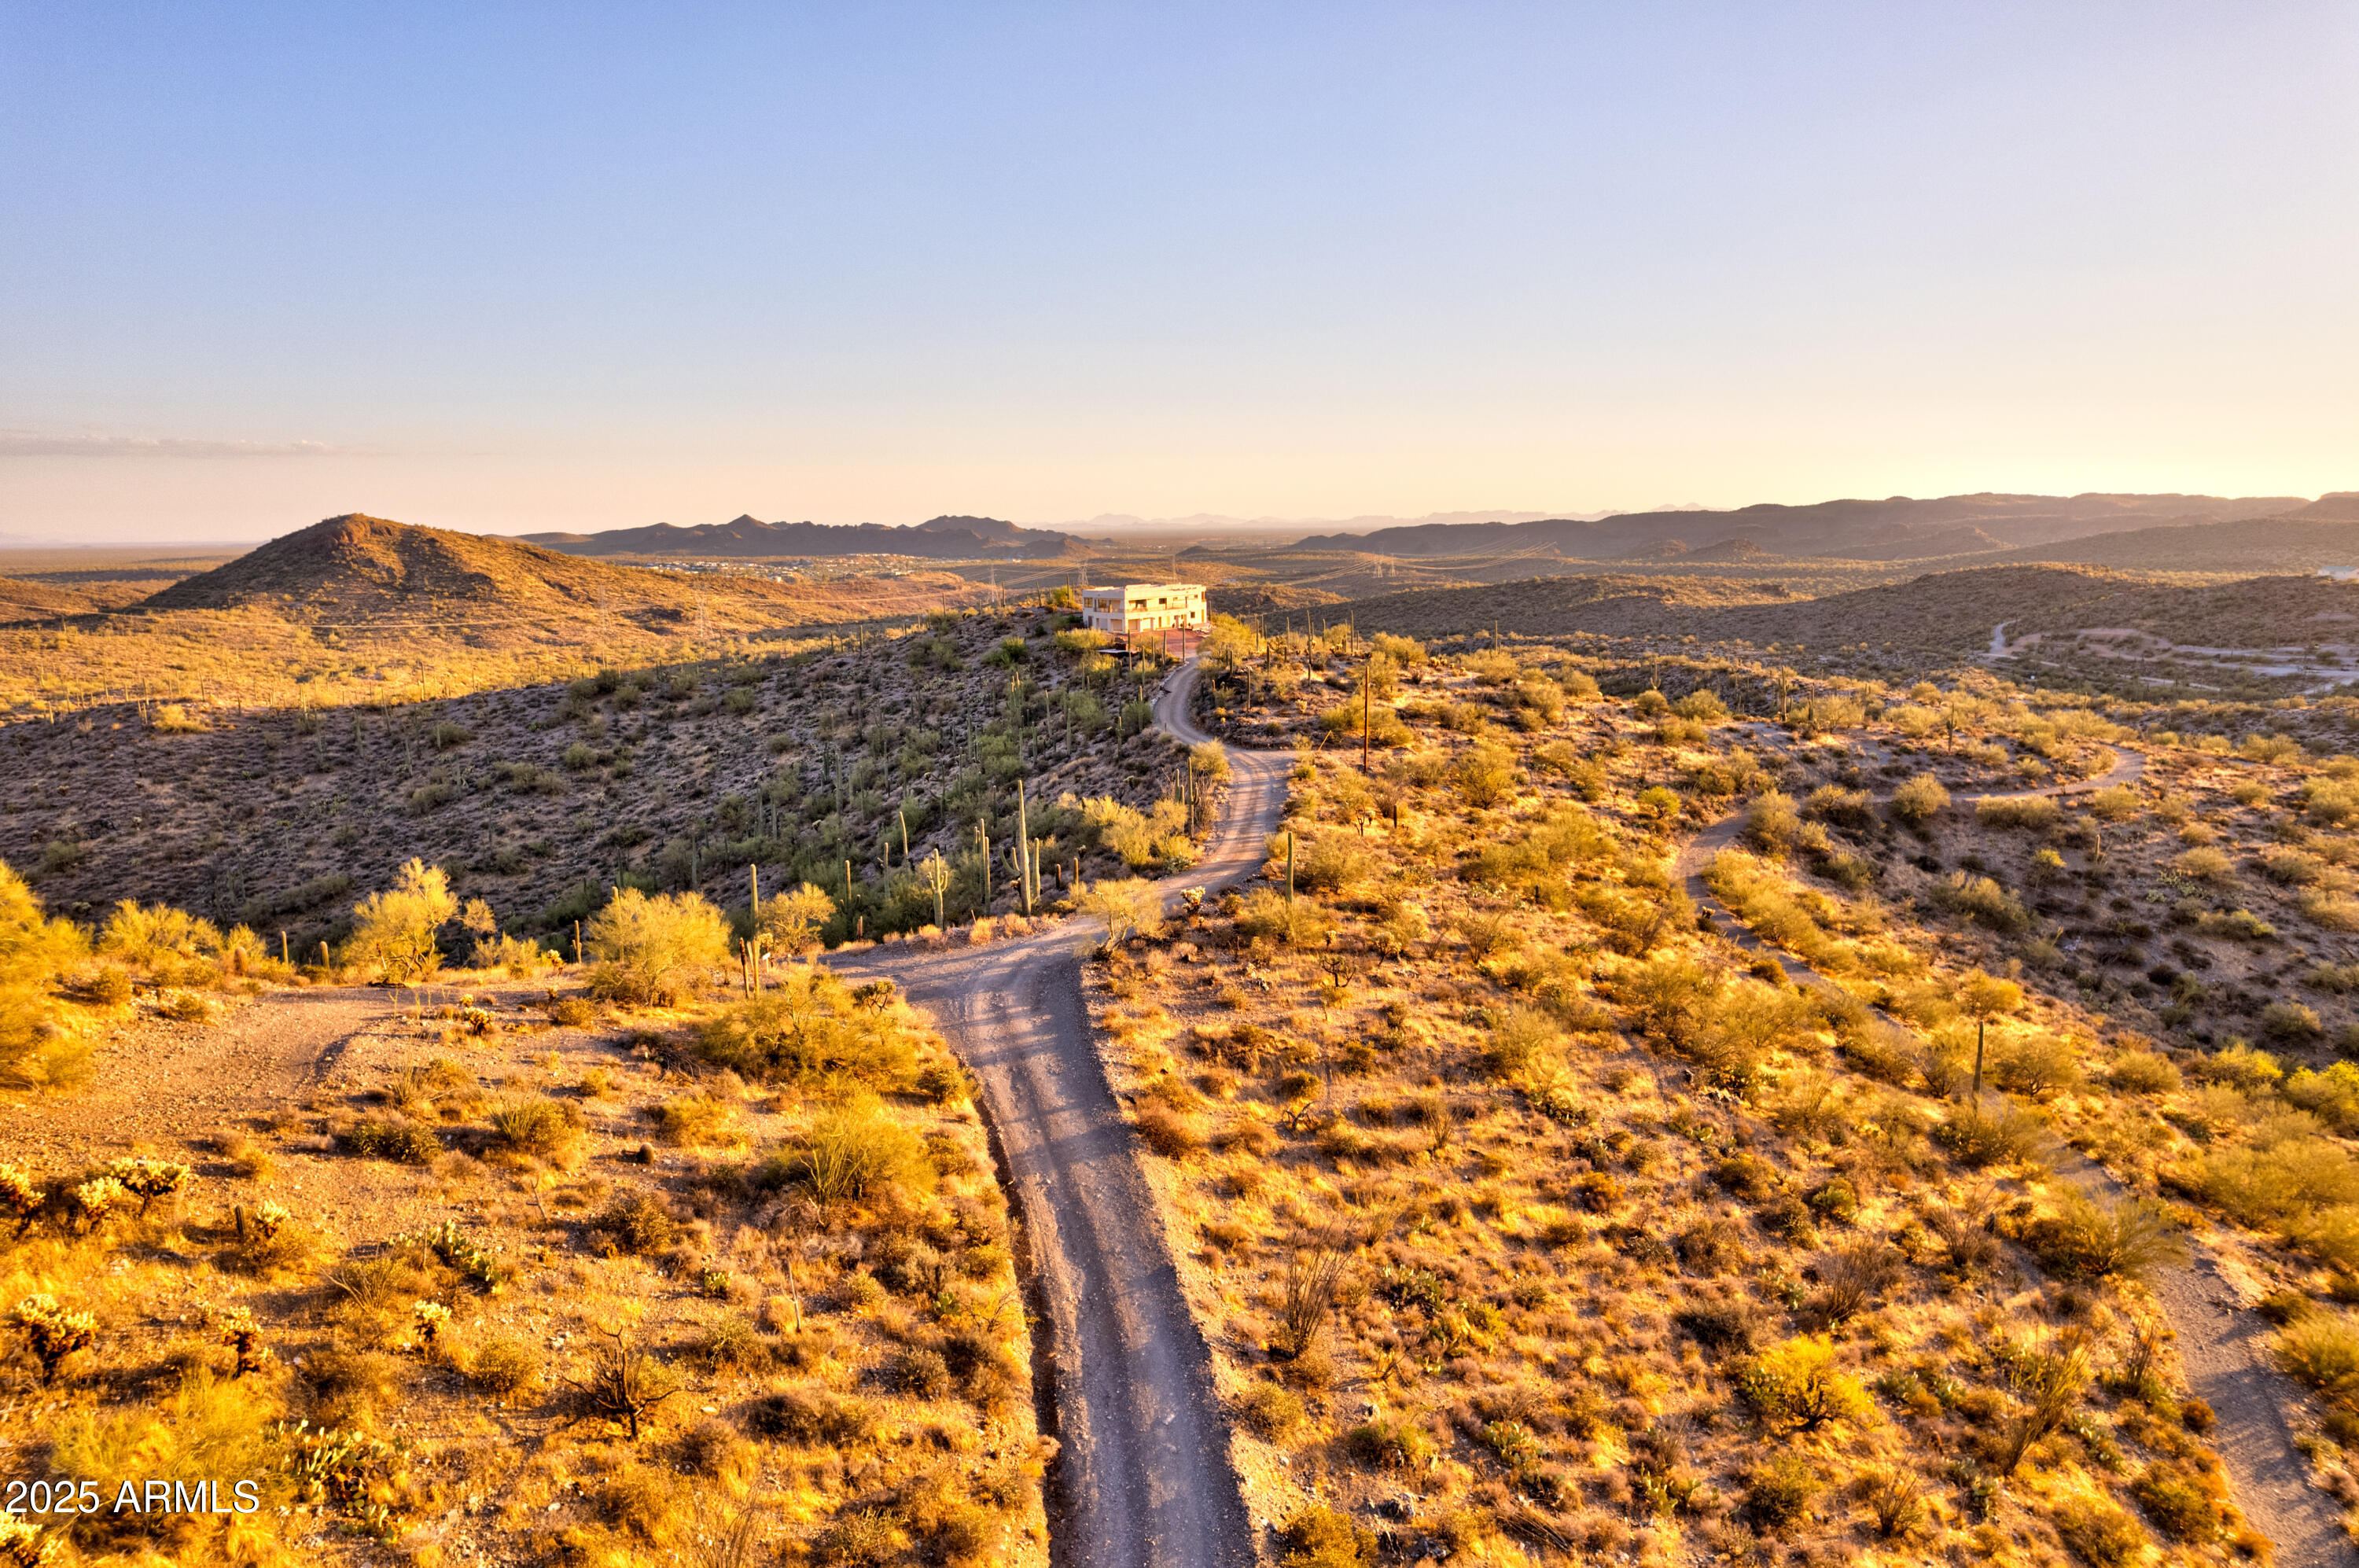
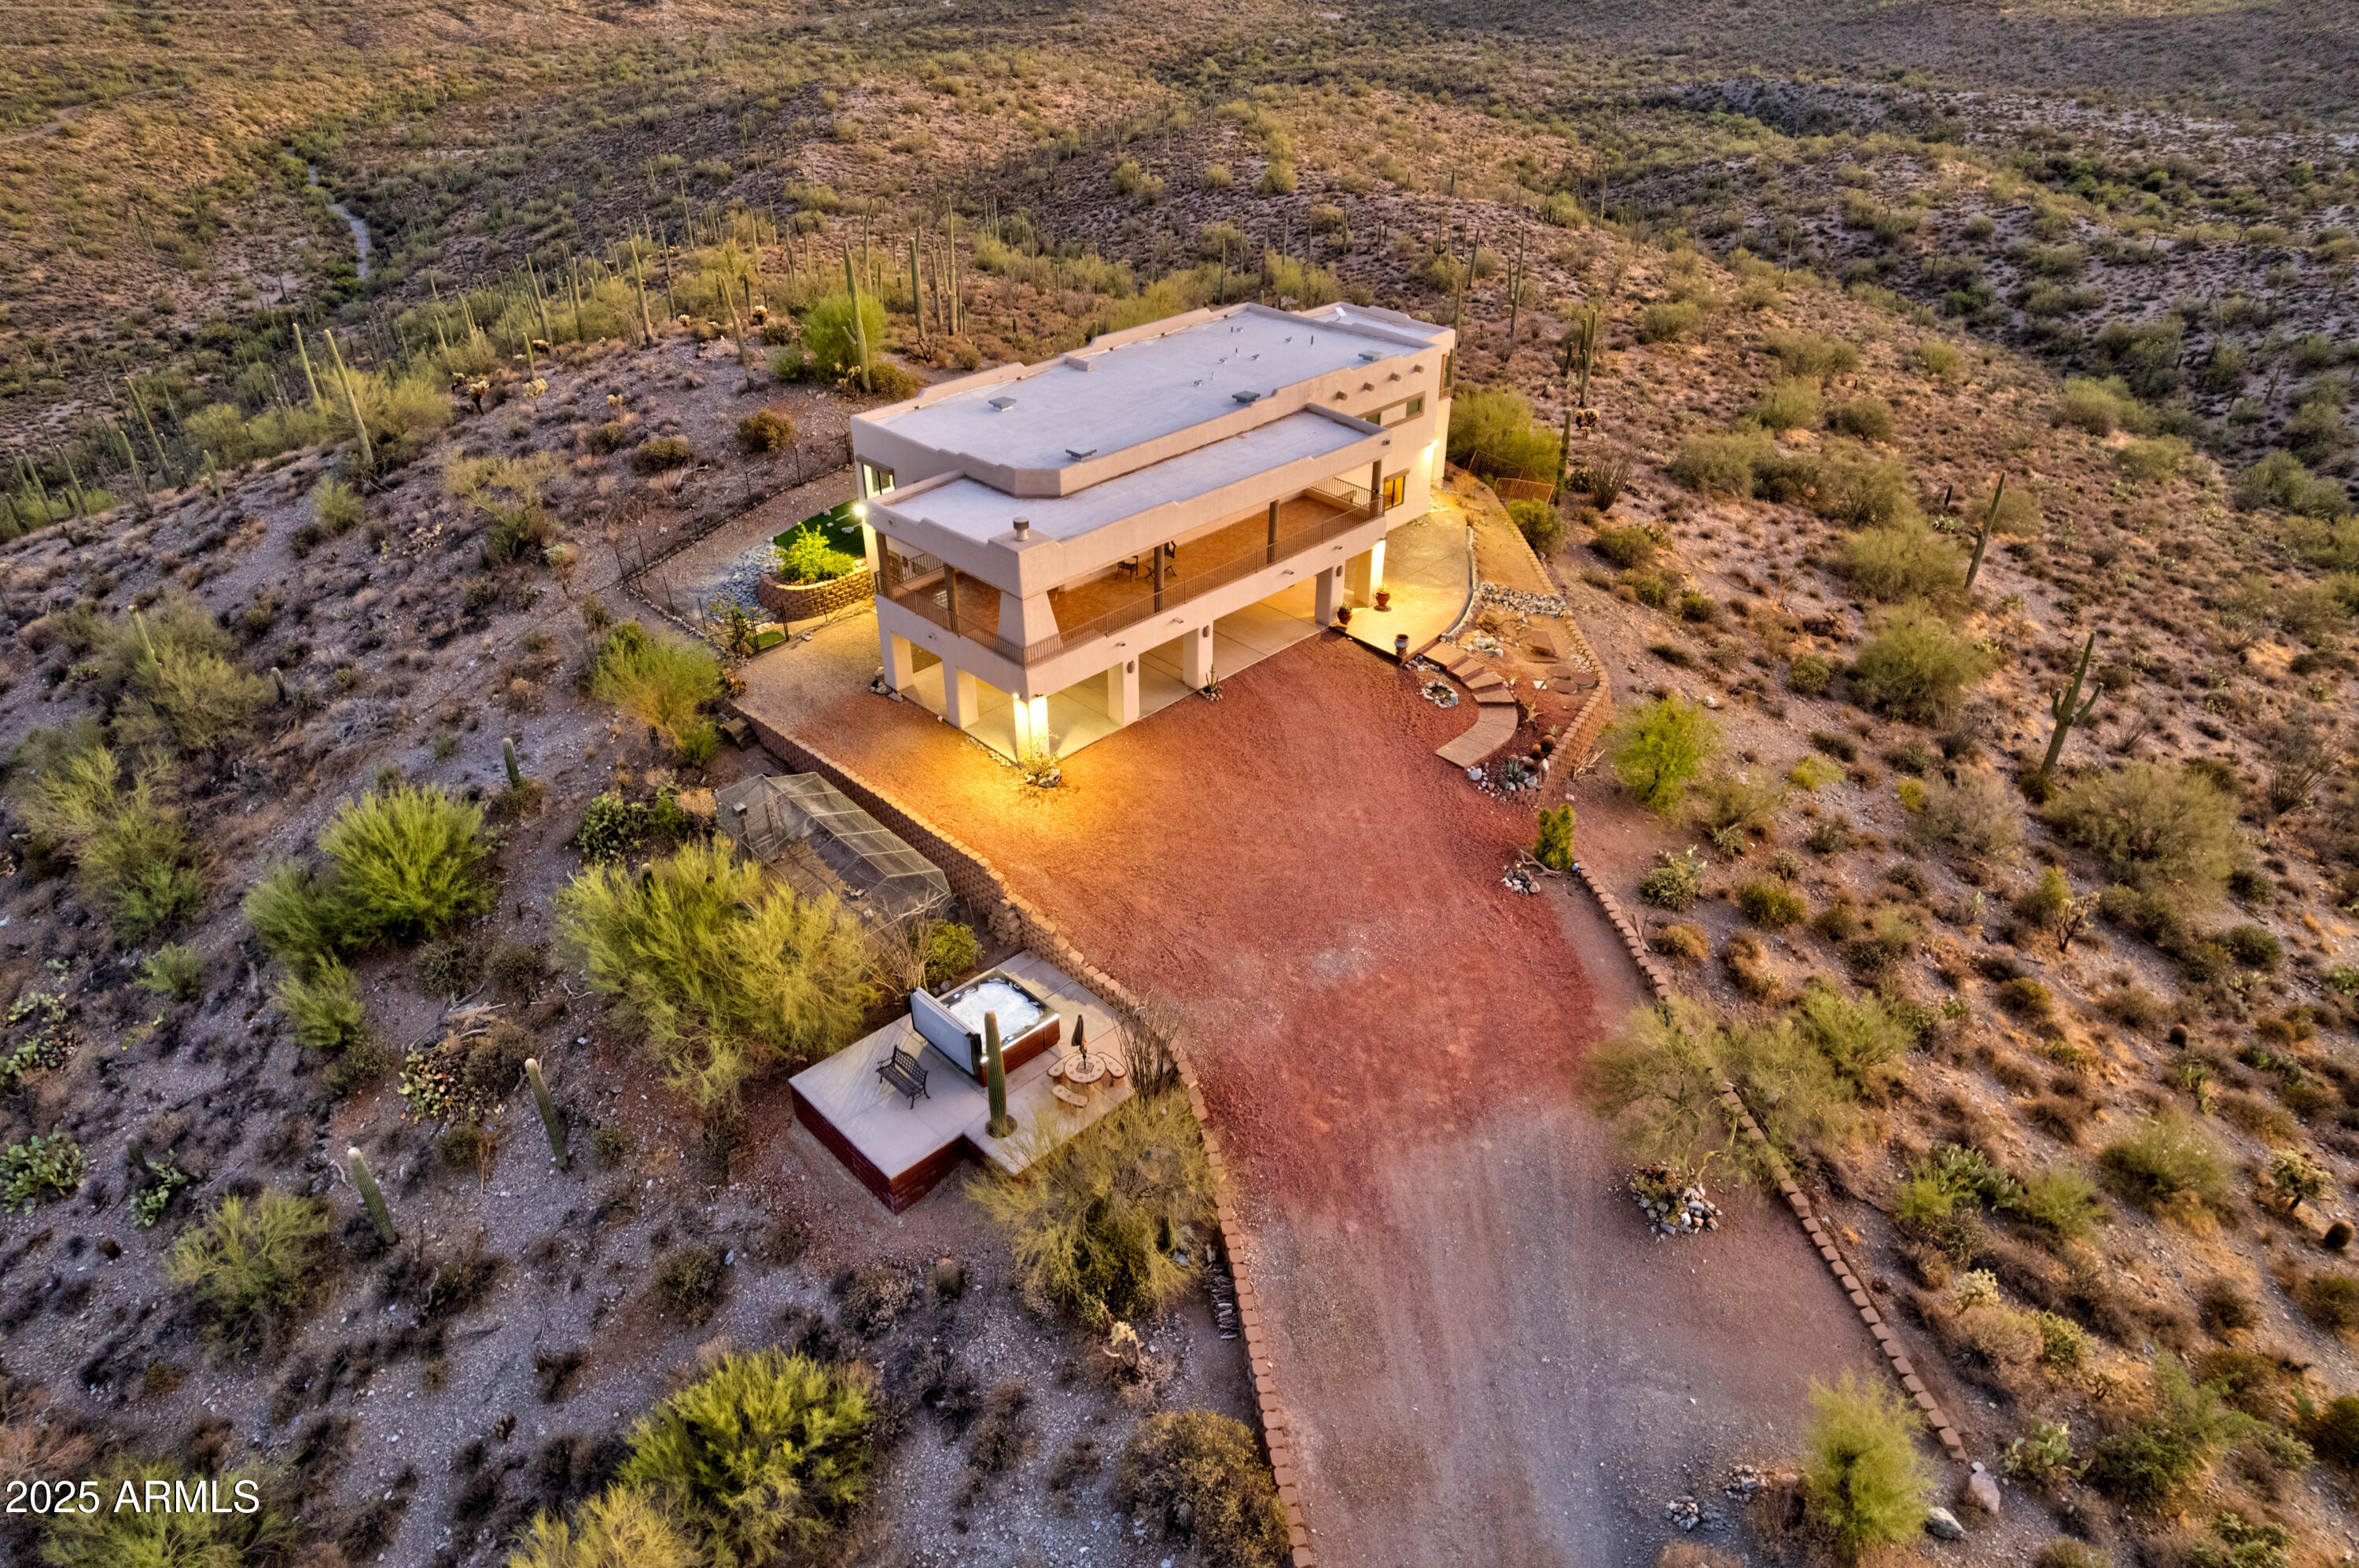
Stunning Custom Home on 15 acres borders State Land. Wake up to a gorgeous sunrise and end your day with a spectacular sunset from every angle of this exceptional custom-built home. Nestled atop mountain slopes (15 acres available in this listing, with the option to purchase all 40), this 2,928 sq. ft. home offers panoramic views of surrounding beauty. A thoughtfully designed 3-bedroom, 3-bath home offers flexible living options with an income-generating opportunity. A downstairs casita has its own entrance, two bedrooms, one bath, living/dining room and kitchenette. Upstairs is open floor plan, expansive primary bedroom, 2 bathrooms. If you're looking for a private escape, a family home, or an income-producer this home and land gives you options. Owner is licensed AZ Realtor. **Upgrades & Features:** - **Exterior**: - New pressure tank and upgrades to the private well - 6-person Bull Frog Spa added in 2023 - Updates to septic system - Rhino Shield 25-year lifetime exterior paint October 2024 - New decking on back patio and new pillars on all porches October 2024 - RV Electrical - Driveway alarms and video cameras which are in use. - Flood lights - Fenced in back yard - **Interior**: - Fresh interior paint throughout - Whole home central vacuum system - 2 Walk in closets in primary bathroom - Spacious 3-car garage with built-in cabinetry for extra storage - Garage has 220 - New hot water heater in 2022 - Separate heating and cooling units and thermostats for upstairs/downstairs - UV protection on windows - Metal Roll Down Shutters on windows (electric and manual) - Starlink Internet could transfer - The wall that is covering the staircase can easily be removed without damage to the staircase. - Cameras and video recording in the home are in use **A View from Every Room** Bordering State Land the home is designed to take full advantage of the spectacular surroundings. From the downstairs living room, you'll enjoy breathtaking views of Elephant Butte. Upstairs, with 9-foot ceilings, the expansive windows offer panoramic vistas of Picket Post, the Superstition Mountains, and - on clear days - even Mount Lemmon. Relax and unwind by the Kiva on the wrap around porch encompassing two sides of the home, take in the stunning southern views from the back patio, or watch the sunset from the 6 person spa. This property offers endless possibilities, including the option to purchase an additional 25 acres separately. See other listings. The survey has been completed but the new parcel numbers have not been assigned. Don't miss your chance to own this beautiful, one-of-a-kind Arizona retreat. Whether you're looking for a private escape, a family home, or an income-producing property, this home has it all. Credit to be given at close of escrow in the amount of $20,000 (new flooring, dishwasher has never worked, and washer dryer are old).
Build Your Team
Quickly find investor-friendly professionals who can help you succeed in real estate investing at any stage of the investing journey.


Agents
Match with investor-friendly agents who can help you find, analyze, and close your next deal


Lenders
Get the best funding…find investor-friendly lenders who specialize in your deal strategy


Property Managers
Transition to passive investing. Find a trusted property management partnership that lasts.


Tax Pros & Accountants
Taxes and financial reporting made easy—find experts to create tax savings strategies, file taxes, and more
Location
Property Details
Parking
- Description: Dir Entry frm Garage, Electric Door Opener, Extnded Lngth Garage, RV Access/Parking
- Details: Garage Door Opener
- Garage Spaces: 3
- Spaces Total: 2
Bedroom Information
- # of Bedrooms: 3
Bathroom Information
- # of Baths (Total): 3.0
Interior Features
- # of Stories: 2
- Fireplace: Yes
Exterior Features
- Exterior Walls Materials: Other
Land Information
- Land Use: Residential
- Land Use Subtype: Single Family Residential
Lot Information
- Parcel ID: 10454005E
- Lot Size: 653400 sqft
Property Information
- Property Type: Single Family Residence
- Year Built: 2001
Tax Information
- Annual Tax: $4,107
Utilities
- Water & Sewer: Private
- Heating: Electric
- Cooling: Central Air, Ceiling Fan(s)
Location
- County: Pinal
Listing Details
Investment Summary
- Monthly Cash Flow
- -$4,239
- Cap Rate
- 1.7%
- Cash-on-Cash Return
- -17.1%
- Debt Coverage Ratio
- 0.31
- Internal Rate of Return (5 years)
- -12.6%
Cash Flow
Net Operating Income (NOI) minus mortgage payments.
Calculation:
NOI - Mortgage Payments
Cap Rate (Market Value)
Capitalization Rate is a rate of return that compares the yearly Net Operating Income (NOI) to the market value.
Calculation:
NOI / Market Value
Cash-on-Cash Return (CoC)
Annual Cash Flow / Cash Invested
Calculation:
Annual cash flow divided by initial cash invested.
Debt Coverage Ratio (DCR)
Net Operating Income (NOI) divided by total debt payments.
Calculation:
NOI / Total Debt Payments
Internal Rate of Return (IRR)
A metric for assessing profitability over time. IRR is the discount rate at which the net present value (NPV) of all future cash flows (positive and negative) from an investment equals zero — including both periodic cash flow (such as rent) and a projected sale at the end of the holding period. It represents the expected annualized return, accounting for income, expenses, and the recovery of capital through a future sale.
Purchase Details
Purchase PriceThe price paid for the property. Purchase price:
| $1,290,000 |
|---|---|
Amount FinancedThe amount of the purchase financed through a loan. Amount financed:
| -$1,032,000 |
Down paymentThe initial payment made towards the purchase. Down payment:
| $258,000 |
Closing CostsFees and expenses associated with purchasing a property, typically ranging from 2% to 5% of the home’s purchase price, paid at the end of a home purchase to cover services like lending, title transfer, and taxes. Closing costs:
| $38,700 |
Rehab CostsCosts incurred to repair or improve the property, including: roof, flooring, exterior siding, kitchen, exterior paint, bathrooms, etc. Rehab costs:
| $0 |
Initial Cash InvestedThe total initial cash invested in the property. Calculation:Down payment + Buying costs + Rehab costs Initial cash invested:
| $296,700 |
Square Feet (SQFT)The total square footage of the property. Square feet:
| 2,928 |
Cost Per Square FootCost per square foot of the property. Calculation:Purchase Price / Square Feet Cost per square foot:
| $441 |
Monthly Rent Per Square FootMonthly rent divided by the number of square feet. This ratio helps investors compare rental income efficiency across properties, markets, and unit sizes Calculation:Monthly Rent / Square Feet Monthly rent per square foot:
| $1.09 |
Financing Details
Loan AmountThe total sum of money borrowed from a lender to finance a property purchase. Calculation:Purchase Price - Down Payment
Loan amount:
| $1,032,000 |
|---|---|
Loan to Value Ratio (LTV)Loan amount divided by the market value of the property. Calculation:Loan Amount / Market Value
Loan to value ratio:
| 80.0% |
Loan TypeThe type of loan (e.g., fixed, adjustable).
Loan type:
| Amortizing |
TermThe loan repayment period in years.
Term:
| 30 years |
Interest RateThe percentage a lender charges on the borrowed amount of a loan, determining the cost of borrowing money.
Interest rate:
| 5.875% |
Principal & Interest (PI)The principal is the portion of the loan payment that reduces the loan balance. The interest is the lender's charge for borrowing money. Calculation:(P * r * (1 + r) ** n) / ((1 + r) ** n - 1) Where:
P = Loan amount (principal)
Principal & interest:
| $6,105 |
Property TaxesAnnual taxes levied by local governments on real estate properties. These taxes fund public services like schools, roads, and emergency services.
Property tax:
| $342 |
InsuranceThe costs for insurance coverage to protect against financial losses due to risks like fire, natural disasters, theft, liability, or tenant-related damages. Calculation:Assumes 7% of gross rental income, unless insurance rates are specified.
Insurance:
| $224 |
Private Mortgage Insurance (PMI)A fee that borrowers pay when they take out a conventional loan with a loan-to-value (LTV) ratio above 80%.
Private mortgage insurance (PMI):
| $0 |
Monthly PaymentThe fixed amount a borrower pays each month to repay a loan. It typically includes principal and interest (P&I) and may also cover property taxes, insurance, HOA fees, and PMI if escrowed. Monthly payment:
| $6,671 |
Operating Income
| % Rent | Monthly | Yearly | |
|---|---|---|---|
Gross RentThe total rental income received from tenants before deducting any expenses. Includes base rent, late fees, pet fees, parking fees, and other recurring charges.
Gross rent:
| $3,200 | $38,400 | |
Vacancy LossExpected loss of rent due to vacancies.
Vacancy loss:
(6%)
| 6% | -$192 | -$2,304 |
Operating IncomeGross rental income minus vacancy loss. Calculation:Gross rent - Vacancy loss
Operating income:
| $3,008 | $36,096 |
Operating Expenses
| % Rent | Monthly | Yearly | |
|---|---|---|---|
Property TaxesAnnual taxes levied by local governments on real estate properties. These taxes fund public services like schools, roads, and emergency services. | 11% | -$342 | -$4,107 |
InsuranceThe costs for insurance coverage to protect against financial losses due to risks like fire, natural disasters, theft, liability, or tenant-related damages. Calculation:Assumes 7% of gross rental income, unless insurance rates are specified. | 7% | -$224 | -$2,688 |
Property ManagementThe costs associated with hiring a property manager to handle the day-to-day operations of a rental property. Includes management fees, leasing fes, eviction fees, etc. Calculation:Assumes 8% of gross rental income. | 8% | -$256 | -$3,072 |
Repairs & MaintenanceOngoing costs for routine upkeep and minor fixes needed to keep a property in good working condition. Calculation:Assumes 5% of gross rental income. Varies by property age and condition. | 5% | -$160 | -$1,920 |
Capital ExpensesLarge, infrequent costs for major improvements or replacements, like a new roof, HVAC system, or appliances. Calculation:Assumes 5% of gross rental income. Varies by property age. | 5% | -$160 | -$1,920 |
HOA FeesRegular dues paid to a Homeowners Association for community maintenance, amenities, and management. Similar fees include: Condo Association Fees, Co-op Maintenance Fees, etc. | n/a | n/a | n/a |
Operating ExpensesRecurring costs required to maintain and manage a rental property, including property taxes, insurance, maintenance, repairs, utilities (if paid by the owner), property management fees, and other day-to-day expenses. Calculation:Insurance + Property Taxes + Property Management + Repairs & Maintenance + Capital Expenditures + HOA Fees | 36% | -$1,142 | -$13,707 |
Cash Flow
| Monthly | Yearly | |
|---|---|---|
Net Operating Income (NOI)The income generated from a property after deducting all operating expenses but before deducting mortgage payments, taxes, and capital expenditures. Calculation:Gross Operating Income - Operating Expenses
Net operating income:
| $1,866 | $22,392 |
Mortgage PaymentThe fixed amount a borrower pays each month to repay a loan. It typically includes principal and interest (P&I) and may also cover property taxes, insurance, HOA fees, and PMI if escrowed. | -$6,105 | -$73,260 |
Cash FlowNet Operating Income (NOI) minus mortgage payments. Calculation:NOI - Mortgage Payments | -$4,239 | -$50,868 |