


$2,500,000
Investment Summary
- Monthly Cash Flow
- -$10,502
- Cap Rate
- 0.6%
- Cash-on-Cash Return
- -21.9%
- Debt Coverage Ratio
- 0.11
- Internal Rate of Return (5 years)
- -17.2%
Cash Flow
Net Operating Income (NOI) minus mortgage payments.
Calculation:
NOI - Mortgage Payments
Cap Rate (Market Value)
Capitalization Rate is a rate of return that compares the yearly Net Operating Income (NOI) to the market value.
Calculation:
NOI / Market Value
Cash-on-Cash Return (CoC)
Annual Cash Flow / Cash Invested
Calculation:
Annual cash flow divided by initial cash invested.
Debt Coverage Ratio (DCR)
Net Operating Income (NOI) divided by total debt payments.
Calculation:
NOI / Total Debt Payments
Internal Rate of Return (IRR)
A metric for assessing profitability over time. IRR is the discount rate at which the net present value (NPV) of all future cash flows (positive and negative) from an investment equals zero — including both periodic cash flow (such as rent) and a projected sale at the end of the holding period. It represents the expected annualized return, accounting for income, expenses, and the recovery of capital through a future sale.
Property Description
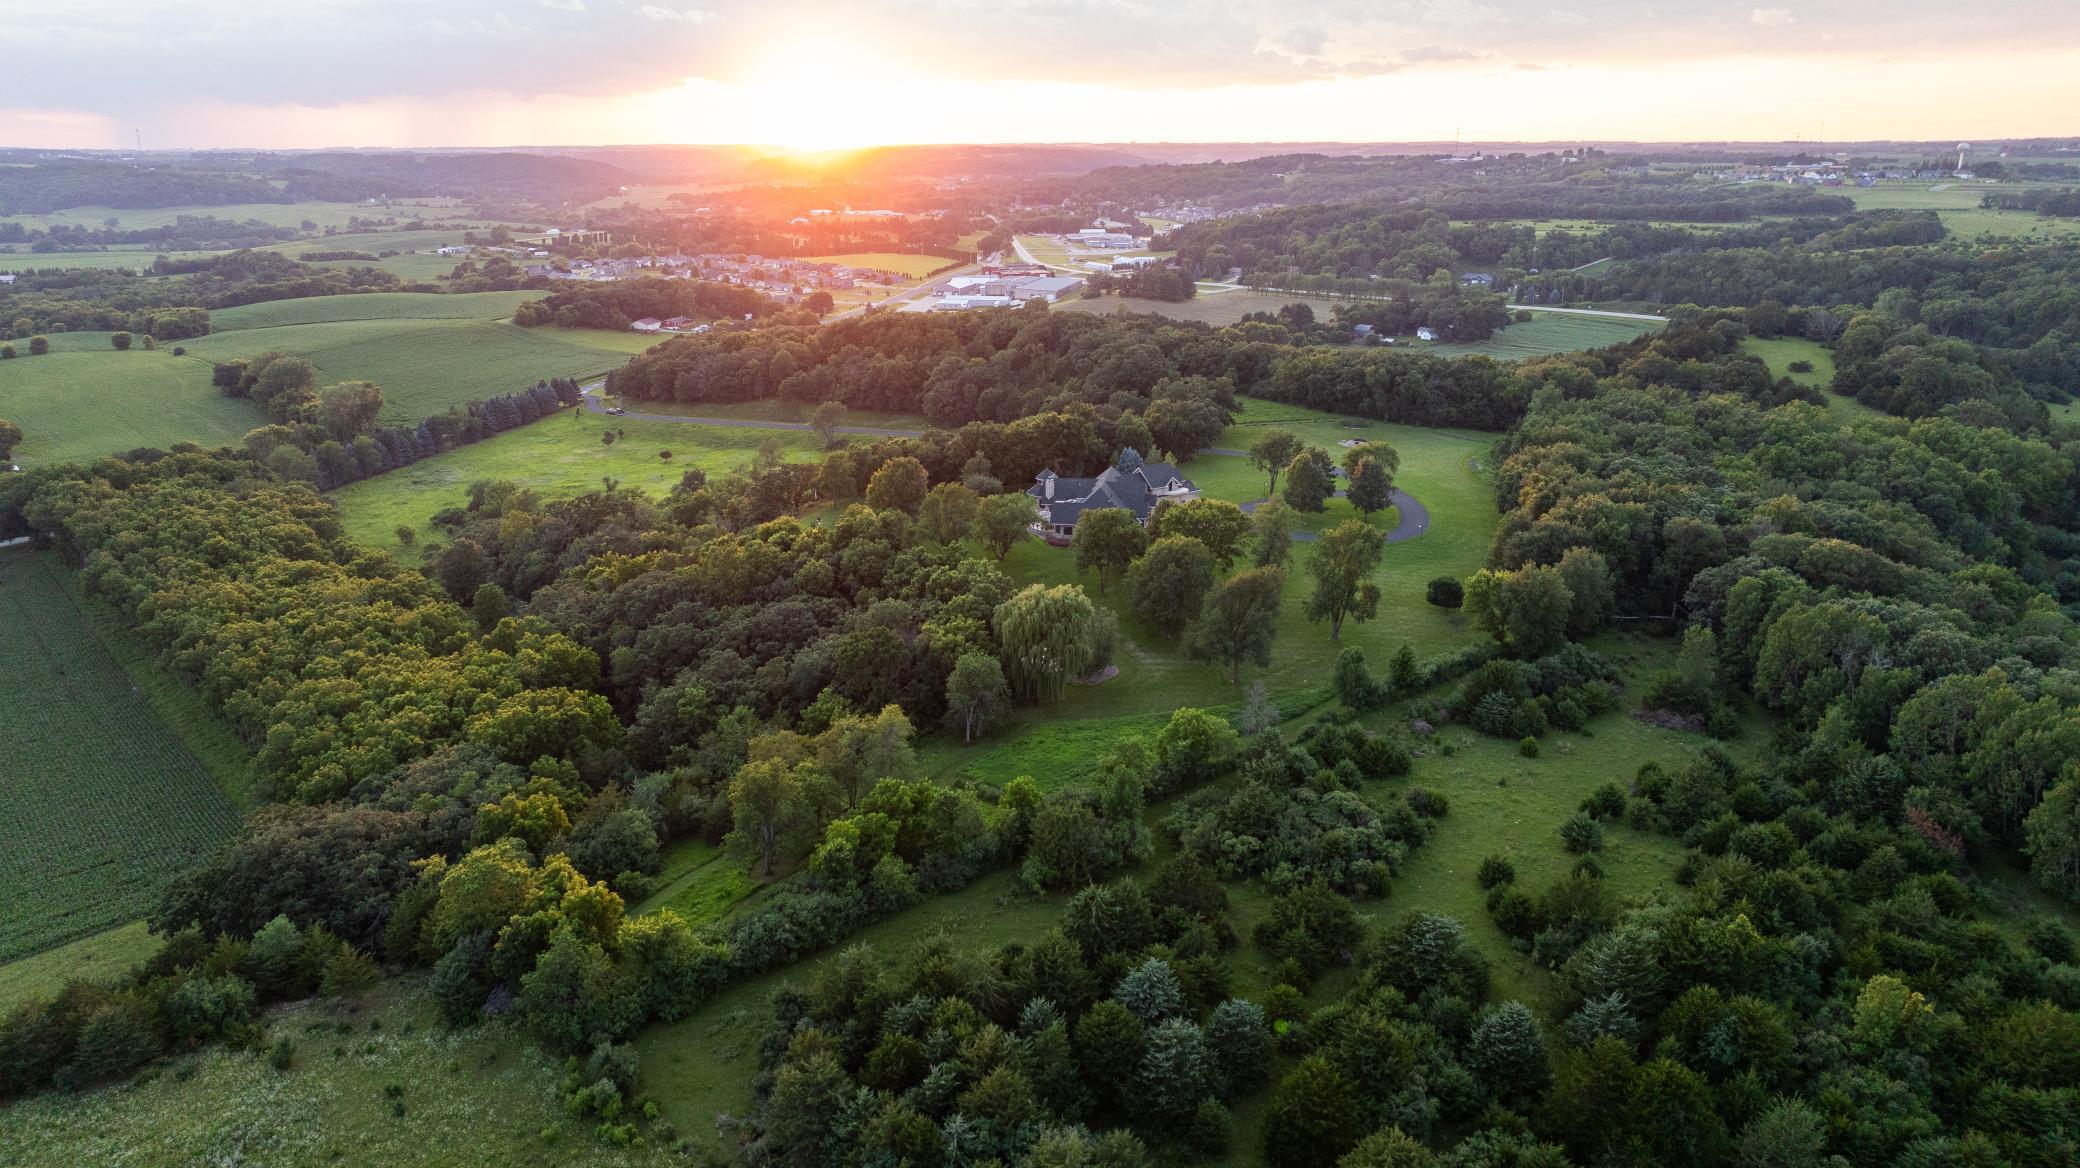
Redtail Ridge Executive Estate on 48+ Private Acres | Unmatched Luxury, Privacy & Scenic Beauty Perched atop a secluded ridge and accessed by a gated, lighted, asphalt driveway, Redtail Ridge is an extraordinary executive retreat nestled on over 48 acres of rolling terrain. With panoramic views, exceptional sunsets, and an unmatched sense of privacy, this one-of-a-kind property offers luxury living surrounded by nature and abundant wildlife—including trophy deer and turkey hunting. This custom-designed residence is an architectural masterpiece that blends elegance, comfort, and functionality. The home features in-floor heating with electric backup, dual-control recirculating hot water, Marvin Integrity windows and sliding doors, and whole-house sound throughout. Exterior amenities include a heated patio and front entry ice melt system, wood-fired Italian pizza oven, multi-tiered fountain, pond with goldfish, a firepit area, and walking trails that wind through native flora, a harvestable walnut grove, and scenic land. Inside, the craftsmanship is evident at every turn—soaring ceilings, rich custom cabinetry, designer finishes, and purposeful layout define the home’s character. The main level features an expansive chef’s kitchen with Sub-Zero and Thermador appliances, double ovens, a 10’ walnut breakfast bar, and seating for eight. Adjacent to the kitchen is a well-appointed bar with granite countertops, beverage fridge, and Scotsman ice maker. A walk-in pantry provides custom storage and appliance-ready space. The dining room accommodates 18 under alabaster chandeliers, while the living room, study, and multiple sun-drenched sitting areas offer both comfort and sophistication. The luxurious owner suite is a true retreat, with private patio access, two large walk-in closets, spa bath featuring Kohler River Bath whirlpool, double vanities, and a two-person shower. Entertainment and functionality continue with a wine cellar (900-bottle capacity), large family room with American cherry ceiling and enclosed entertainment system, and a "Jumby" room with 20’ ceilings, octagonal design, and tiered cove lighting. The home also features a 3-car heated garage with three drains, hot water, and ample workspace and storage. Upstairs, guests and family will enjoy multiple bedrooms with private balconies, a Jack-and-Jill bath, playroom/fitness area with secret nooks, and even a kitchenette-equipped lounge. Whether you're relaxing by the fire, exploring the land, hosting a gathering, or simply enjoying the view from one of three private balconies, Redtail Ridge offers the pinnacle of tranquil, luxury living—just minutes from Chatfield and within reach of Rochester
Build Your Team
Quickly find investor-friendly professionals who can help you succeed in real estate investing at any stage of the investing journey.


Agents
Match with investor-friendly agents who can help you find, analyze, and close your next deal


Lenders
Get the best funding…find investor-friendly lenders who specialize in your deal strategy


Property Managers
Transition to passive investing. Find a trusted property management partnership that lasts.


Tax Pros & Accountants
Taxes and financial reporting made easy—find experts to create tax savings strategies, file taxes, and more
Location
Property Details
Parking
- Description: Garage
- Details: Heated Garage, Garage
- Garage Spaces: 3
- Spaces Total: 0
Bedroom Information
- # of Bedrooms: 4
Bathroom Information
- # of Baths (Full): 2
- # of Baths (Total): 5.0
Interior Features
- # of Stories: 1
- Basement: Yes
- Basement Description: Storage Space, Sump Pump, Block, Concrete
- Fireplace: Yes
Exterior Features
- Exterior Walls Materials: Rock, Stone
- Roof Type: IRR/Cathedral
- Roof Material: Asphalt, Shingle
Land Information
- Land Use: Residential
- Land Use Subtype: Single Family Residential
Lot Information
- Parcel ID: 25.0048.000
- Lot Size: 2101770 sqft
Property Information
- Property Type: Single Family Residence
- Style: (SF) Single Family
- Year Built: 1999
Tax Information
- Annual Tax: $13,028
Utilities
- Water & Sewer: Well
- Heating: Radiant Floor
- Cooling: Central Air
Location
- County: Fillmore
Listing Details
Investment Summary
- Monthly Cash Flow
- -$10,502
- Cap Rate
- 0.6%
- Cash-on-Cash Return
- -21.9%
- Debt Coverage Ratio
- 0.11
- Internal Rate of Return (5 years)
- -17.2%
Cash Flow
Net Operating Income (NOI) minus mortgage payments.
Calculation:
NOI - Mortgage Payments
Cap Rate (Market Value)
Capitalization Rate is a rate of return that compares the yearly Net Operating Income (NOI) to the market value.
Calculation:
NOI / Market Value
Cash-on-Cash Return (CoC)
Annual Cash Flow / Cash Invested
Calculation:
Annual cash flow divided by initial cash invested.
Debt Coverage Ratio (DCR)
Net Operating Income (NOI) divided by total debt payments.
Calculation:
NOI / Total Debt Payments
Internal Rate of Return (IRR)
A metric for assessing profitability over time. IRR is the discount rate at which the net present value (NPV) of all future cash flows (positive and negative) from an investment equals zero — including both periodic cash flow (such as rent) and a projected sale at the end of the holding period. It represents the expected annualized return, accounting for income, expenses, and the recovery of capital through a future sale.
Purchase Details
Purchase PriceThe price paid for the property. Purchase price:
| $2,500,000 |
|---|---|
Amount FinancedThe amount of the purchase financed through a loan. Amount financed:
| -$2,000,000 |
Down paymentThe initial payment made towards the purchase. Down payment:
| $500,000 |
Closing CostsFees and expenses associated with purchasing a property, typically ranging from 2% to 5% of the home’s purchase price, paid at the end of a home purchase to cover services like lending, title transfer, and taxes. Closing costs:
| $75,000 |
Rehab CostsCosts incurred to repair or improve the property, including: roof, flooring, exterior siding, kitchen, exterior paint, bathrooms, etc. Rehab costs:
| $0 |
Initial Cash InvestedThe total initial cash invested in the property. Calculation:Down payment + Buying costs + Rehab costs Initial cash invested:
| $575,000 |
Square Feet (SQFT)The total square footage of the property. Square feet:
| 7,354 |
Cost Per Square FootCost per square foot of the property. Calculation:Purchase Price / Square Feet Cost per square foot:
| $340 |
Monthly Rent Per Square FootMonthly rent divided by the number of square feet. This ratio helps investors compare rental income efficiency across properties, markets, and unit sizes Calculation:Monthly Rent / Square Feet Monthly rent per square foot:
| $0.48 |
Financing Details
Loan AmountThe total sum of money borrowed from a lender to finance a property purchase. Calculation:Purchase Price - Down Payment
Loan amount:
| $2,000,000 |
|---|---|
Loan to Value Ratio (LTV)Loan amount divided by the market value of the property. Calculation:Loan Amount / Market Value
Loan to value ratio:
| 80.0% |
Loan TypeThe type of loan (e.g., fixed, adjustable).
Loan type:
| Amortizing |
TermThe loan repayment period in years.
Term:
| 30 years |
Interest RateThe percentage a lender charges on the borrowed amount of a loan, determining the cost of borrowing money.
Interest rate:
| 5.875% |
Principal & Interest (PI)The principal is the portion of the loan payment that reduces the loan balance. The interest is the lender's charge for borrowing money. Calculation:(P * r * (1 + r) ** n) / ((1 + r) ** n - 1) Where:
P = Loan amount (principal)
Principal & interest:
| $11,831 |
Property TaxesAnnual taxes levied by local governments on real estate properties. These taxes fund public services like schools, roads, and emergency services.
Property tax:
| $1,086 |
InsuranceThe costs for insurance coverage to protect against financial losses due to risks like fire, natural disasters, theft, liability, or tenant-related damages. Calculation:Assumes 7% of gross rental income, unless insurance rates are specified.
Insurance:
| $245 |
Private Mortgage Insurance (PMI)A fee that borrowers pay when they take out a conventional loan with a loan-to-value (LTV) ratio above 80%.
Private mortgage insurance (PMI):
| $0 |
Monthly PaymentThe fixed amount a borrower pays each month to repay a loan. It typically includes principal and interest (P&I) and may also cover property taxes, insurance, HOA fees, and PMI if escrowed. Monthly payment:
| $13,162 |
Operating Income
| % Rent | Monthly | Yearly | |
|---|---|---|---|
Gross RentThe total rental income received from tenants before deducting any expenses. Includes base rent, late fees, pet fees, parking fees, and other recurring charges.
Gross rent:
| $3,500 | $42,000 | |
Vacancy LossExpected loss of rent due to vacancies.
Vacancy loss:
(6%)
| 6% | -$210 | -$2,520 |
Operating IncomeGross rental income minus vacancy loss. Calculation:Gross rent - Vacancy loss
Operating income:
| $3,290 | $39,480 |
Operating Expenses
| % Rent | Monthly | Yearly | |
|---|---|---|---|
Property TaxesAnnual taxes levied by local governments on real estate properties. These taxes fund public services like schools, roads, and emergency services. | 31% | -$1,086 | -$13,028 |
InsuranceThe costs for insurance coverage to protect against financial losses due to risks like fire, natural disasters, theft, liability, or tenant-related damages. Calculation:Assumes 7% of gross rental income, unless insurance rates are specified. | 7% | -$245 | -$2,940 |
Property ManagementThe costs associated with hiring a property manager to handle the day-to-day operations of a rental property. Includes management fees, leasing fes, eviction fees, etc. Calculation:Assumes 8% of gross rental income. | 8% | -$280 | -$3,360 |
Repairs & MaintenanceOngoing costs for routine upkeep and minor fixes needed to keep a property in good working condition. Calculation:Assumes 5% of gross rental income. Varies by property age and condition. | 5% | -$175 | -$2,100 |
Capital ExpensesLarge, infrequent costs for major improvements or replacements, like a new roof, HVAC system, or appliances. Calculation:Assumes 5% of gross rental income. Varies by property age. | 5% | -$175 | -$2,100 |
HOA FeesRegular dues paid to a Homeowners Association for community maintenance, amenities, and management. Similar fees include: Condo Association Fees, Co-op Maintenance Fees, etc. | n/a | n/a | n/a |
Operating ExpensesRecurring costs required to maintain and manage a rental property, including property taxes, insurance, maintenance, repairs, utilities (if paid by the owner), property management fees, and other day-to-day expenses. Calculation:Insurance + Property Taxes + Property Management + Repairs & Maintenance + Capital Expenditures + HOA Fees | 56% | -$1,961 | -$23,528 |
Cash Flow
| Monthly | Yearly | |
|---|---|---|
Net Operating Income (NOI)The income generated from a property after deducting all operating expenses but before deducting mortgage payments, taxes, and capital expenditures. Calculation:Gross Operating Income - Operating Expenses
Net operating income:
| $1,329 | $15,948 |
Mortgage PaymentThe fixed amount a borrower pays each month to repay a loan. It typically includes principal and interest (P&I) and may also cover property taxes, insurance, HOA fees, and PMI if escrowed. | -$11,831 | -$141,972 |
Cash FlowNet Operating Income (NOI) minus mortgage payments. Calculation:NOI - Mortgage Payments | -$10,502 | -$126,024 |