$865,000
Investment Summary
- Monthly Cash Flow
- -$2,223
- Cap Rate
- 3.1%
- Cash-on-Cash Return
- -13.4%
- Debt Coverage Ratio
- 0.50
- Internal Rate of Return (5 years)
- -9.0%
Cash Flow
Net Operating Income (NOI) minus mortgage payments.
Calculation:
NOI - Mortgage Payments
Cap Rate (Market Value)
Capitalization Rate is a rate of return that compares the yearly Net Operating Income (NOI) to the market value.
Calculation:
NOI / Market Value
Cash-on-Cash Return (CoC)
Annual Cash Flow / Cash Invested
Calculation:
Annual cash flow divided by initial cash invested.
Debt Coverage Ratio (DCR)
Net Operating Income (NOI) divided by total debt payments.
Calculation:
NOI / Total Debt Payments
Internal Rate of Return (IRR)
A metric for assessing profitability over time. IRR is the discount rate at which the net present value (NPV) of all future cash flows (positive and negative) from an investment equals zero — including both periodic cash flow (such as rent) and a projected sale at the end of the holding period. It represents the expected annualized return, accounting for income, expenses, and the recovery of capital through a future sale.
Property Description
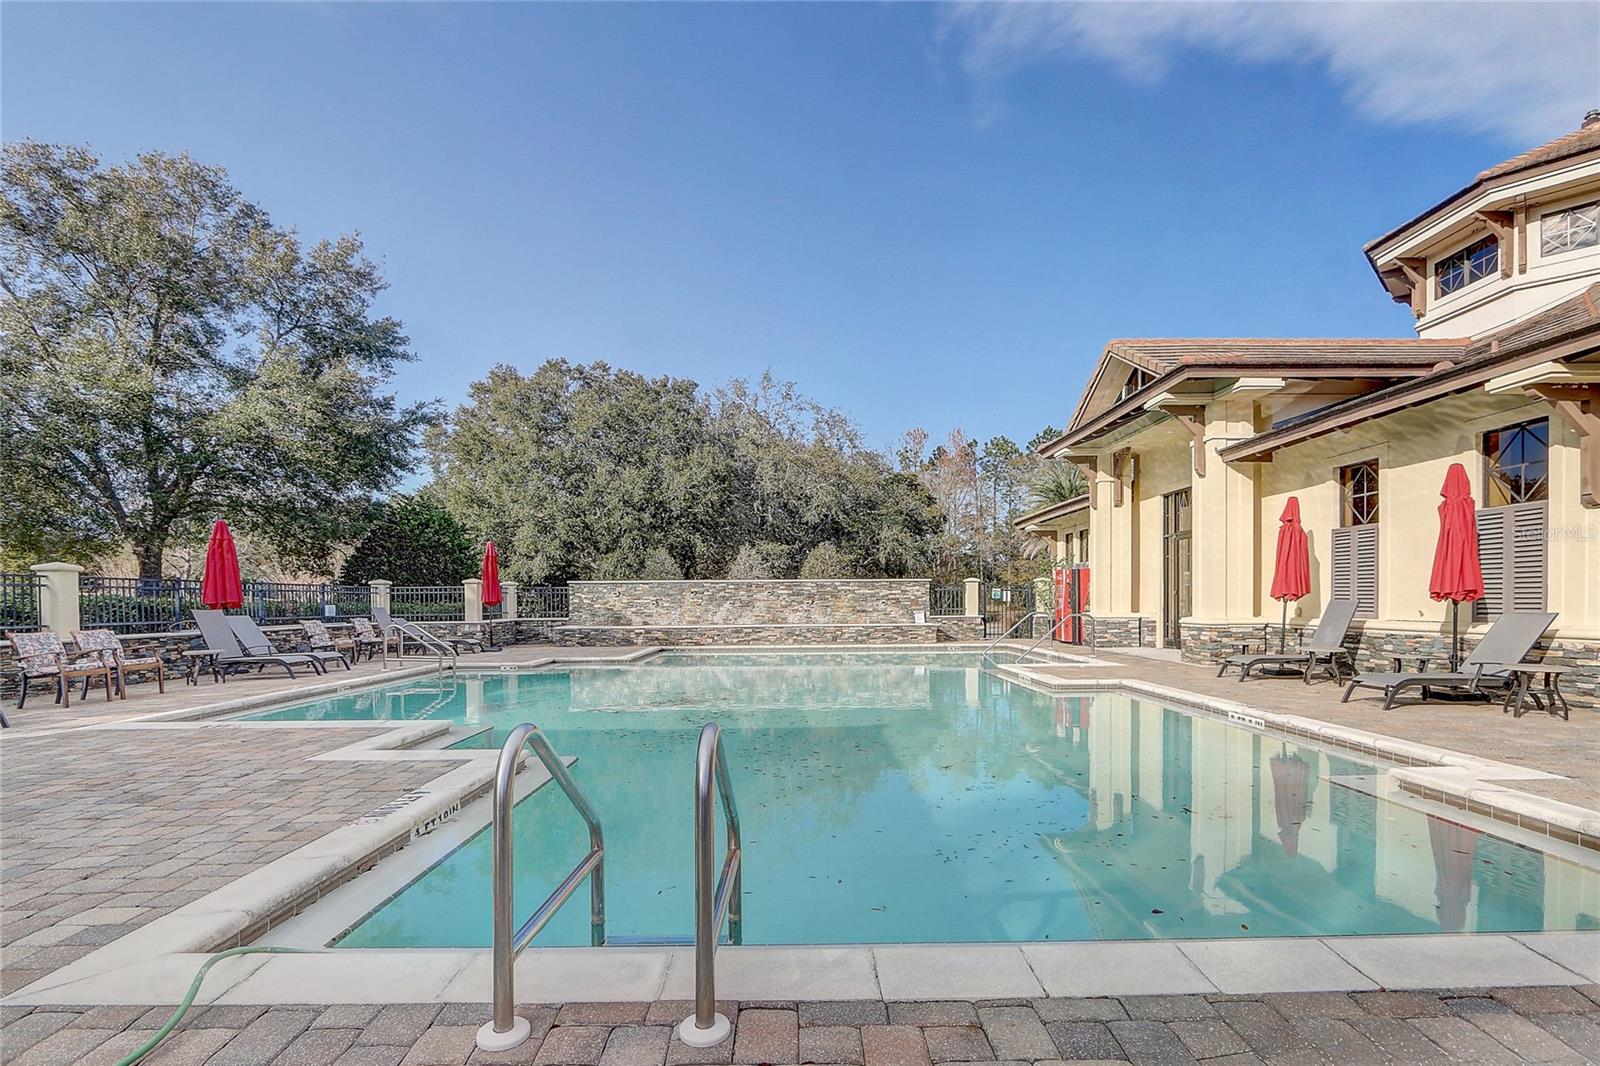
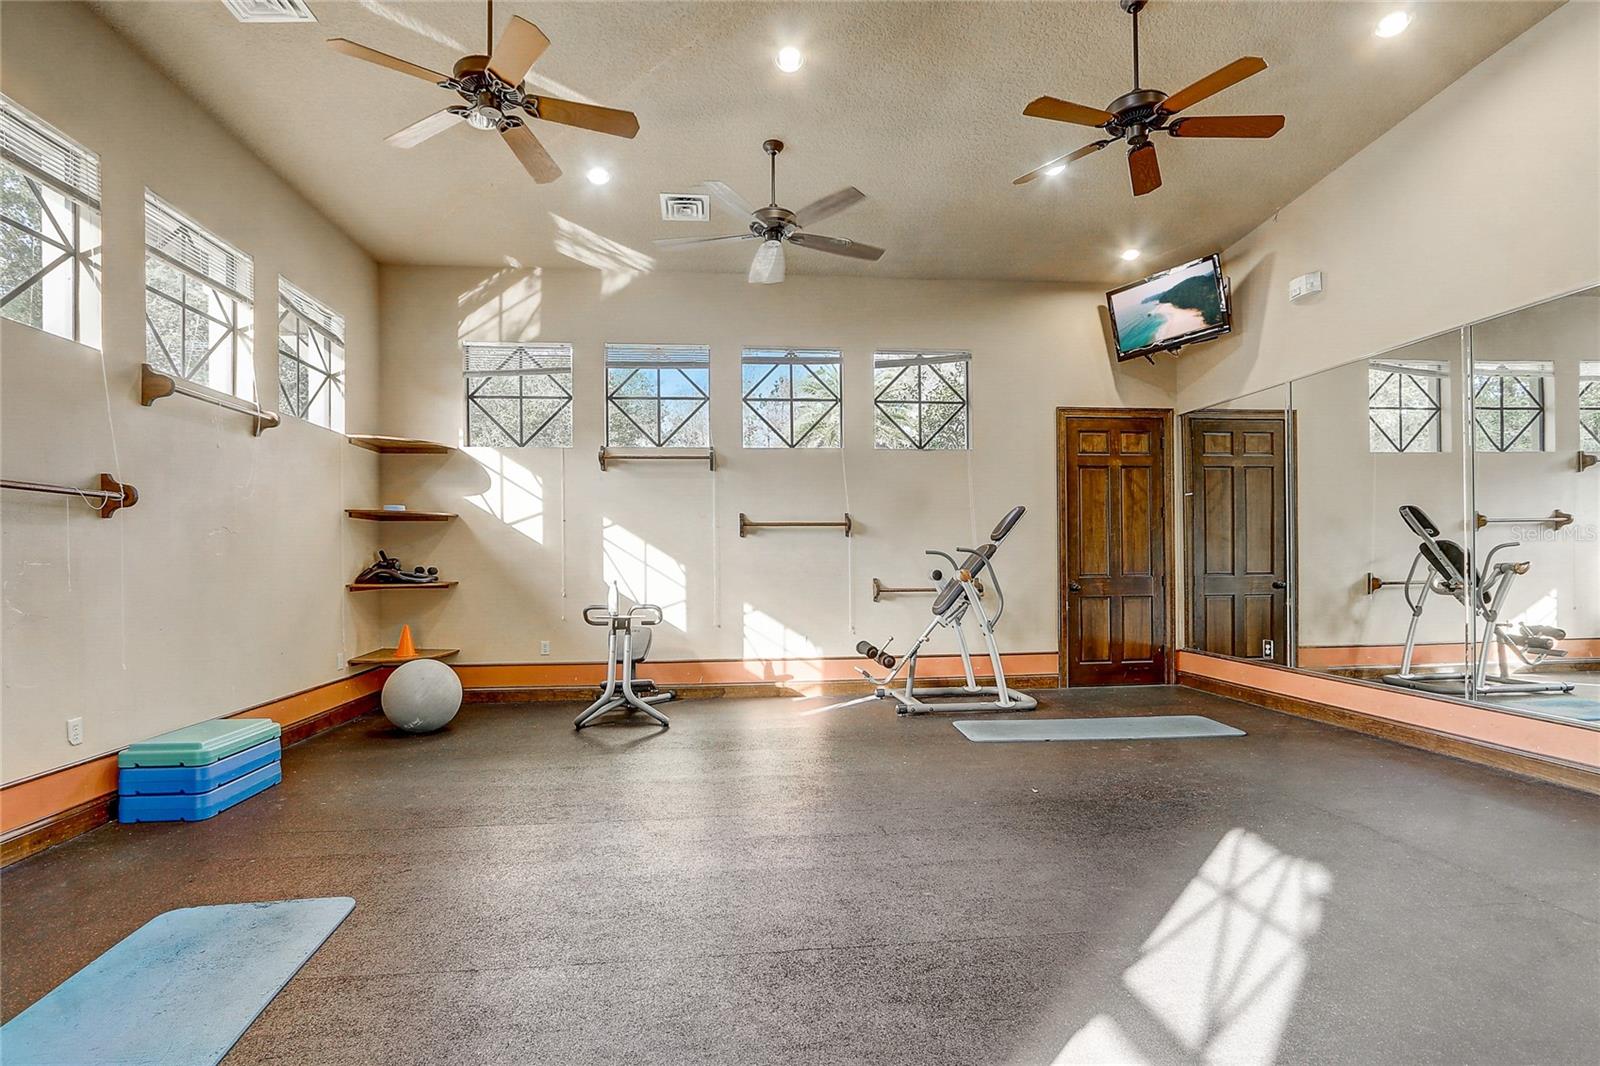
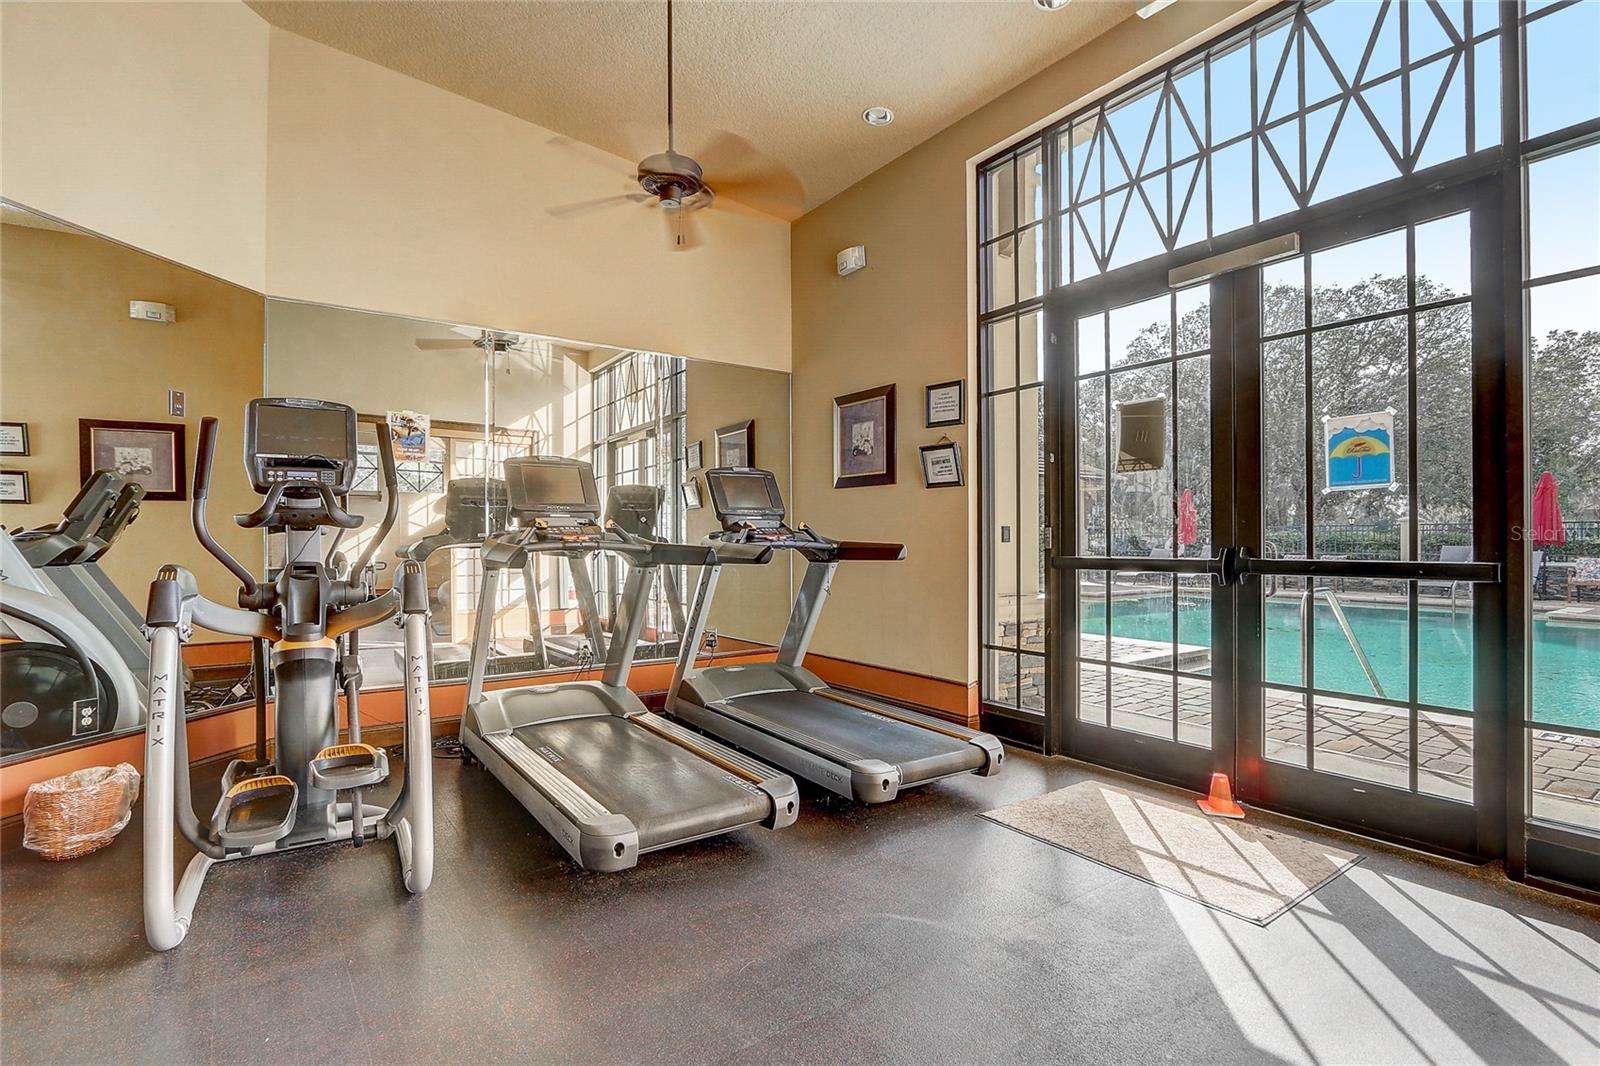
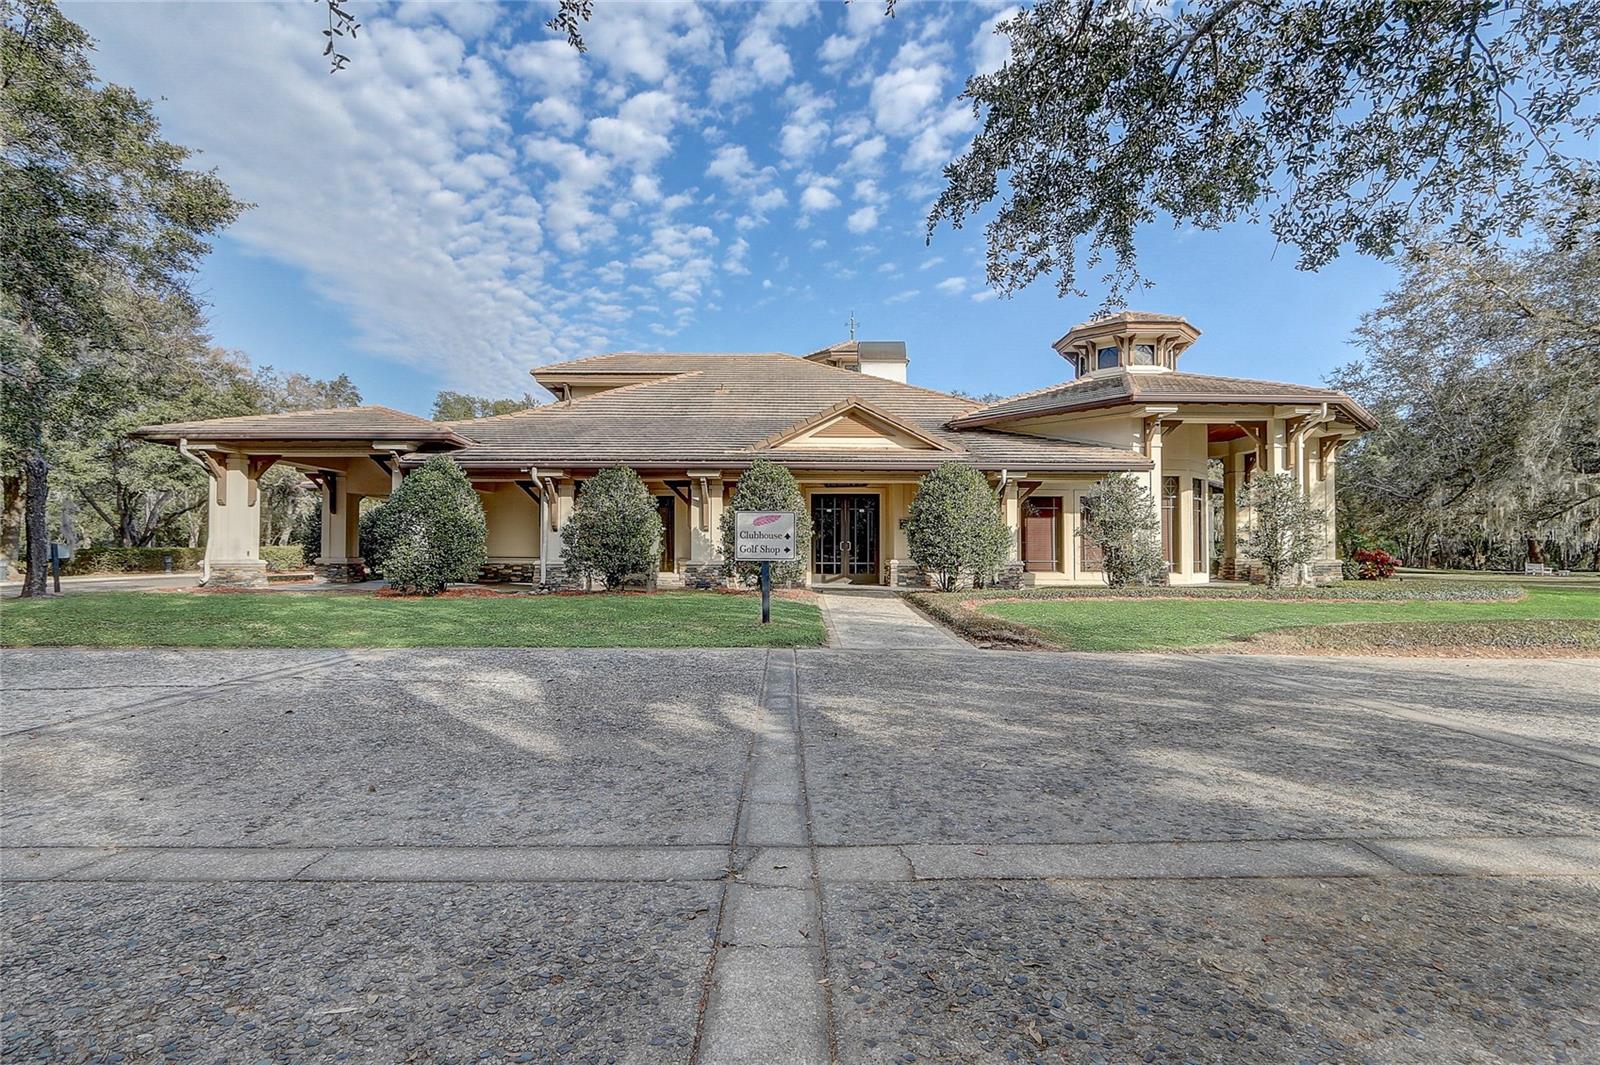
Luxurious Golf Course Living in the HEATHROW COUNTRY ESTATES Discover the epitome of refined living in this exquisite home, perfectly positioned on the 12th hole Fairway of the Red Tail Golf Club. This David Weekly home offers over 3,900 square feet of meticulously designed living space, this residence seamlessly combines modern luxury with timeless elegance to offer an unparalleled lifestyle. Step through the French glass entry doors into a grand foyer and dining room that flows effortlessly into the formal living room. FRESH INTERIOR PAINT throughout creates a crisp and inviting atmosphere, complemented by BRAND NEW CARPET in the bedrooms and upstairs, along with tile flooring throughout the main living areas. The bright and spacious living room opens to an expansive patio through double doors, framing stunning views of the golf course. At the heart of this home lies a chef's dream kitchen, outfitted with built-in ovens, a GAS COOKTOP, a beverage refrigerator, a reverse osmosis system, a massive island, and a breakfast bar. The adjoining dining and family room, warmed by an elegant GAS FIREPLACE, is ideal for both intimate evenings and larger gatherings. The home’s soaring 12-foot ceilings, oversized crown molding, and walls of windows infuse the space with light and grandeur. Upstairs, a recreation room awaits, complete with a full bathroom, projector screen, and plumbing for a wet bar—perfect for entertaining. Additional conveniences include a central vacuum system and two separate garages. Each of the three guest bedrooms features an ensuite bathroom, while the luxurious owner’s suite is a true retreat with a palatial walk-in closet and a bay window offering serene views of the golf course. Step outside to your personal oasis. The expansive covered patio provides ample room for dining and lounging, with ceiling fans ensuring comfort year-round. The FULLY FENCED yard adds privacy and security, all set against the breathtaking backdrop of the golf course. Red Tail is a tranquil, GATED, and well-manicured golfing community in the heart of Central Florida. With easy access to the Wekiva Parkway, downtown Orlando, Winter Park, Mount Dora, airports, theme parks, and beaches, it offers the perfect balance of convenience and serenity. Residents enjoy world-class amenities, including a clubhouse, championship golfing, tennis courts, a state-of-the-art fitness center, and a resort-style swimming pool. The golf course clubhouse also features a restaurant, expansive veranda, and a full-service bar, ideal for a relaxing lunch or dinner with friends. This stunning home is move-in ready and waiting for you to make it your own. Call today to schedule your private showing and discover the luxury lifestyle that awaits you!
Build Your Team
Quickly find investor-friendly professionals who can help you succeed in real estate investing at any stage of the investing journey.


Agents
Match with investor-friendly agents who can help you find, analyze, and close your next deal


Lenders
Get the best funding…find investor-friendly lenders who specialize in your deal strategy


Property Managers
Transition to passive investing. Find a trusted property management partnership that lasts.


Tax Pros & Accountants
Taxes and financial reporting made easy—find experts to create tax savings strategies, file taxes, and more
Location
Property Details
Parking
- Description: Driveway, Garage Door Opener, Garage Faces Side, Split Garage
- Details: Driveway, Garage Door Opener, Garage Faces Side, Garage, Attached
- Garage Spaces: 3
- Spaces Total: 0
Bedroom Information
- # of Bedrooms: 4
Bathroom Information
- # of Baths (Full): 4
- # of Baths (Total): 4.0
Interior Features
- # of Rooms: 4
- # of Stories: 1
- Fireplace: Yes
Exterior Features
- Exterior Walls Materials: Brick Veneer
- Foundation: Slab
- Roof Material: Tile
HOA
- Has HOA: Yes
- Association: Redtail Golf Club
- HOA Fee: $1,040/quarterly
Land Information
- Land Use: Residential
- Land Use Subtype: Single Family Residential
Lot Information
- Parcel ID: 201928080000005500
- Lot Size: 16515 sqft
Property Information
- Property Type: Single Family Residence
- Style: Traditional
- Year Built: 2005
Tax Information
- Annual Tax: $9,911
Utilities
- Water & Sewer: Public
- Heating: Central
- Cooling: Central Air, Zoned
Location
- County: Lake
Listing Details
Investment Summary
- Monthly Cash Flow
- -$2,223
- Cap Rate
- 3.1%
- Cash-on-Cash Return
- -13.4%
- Debt Coverage Ratio
- 0.50
- Internal Rate of Return (5 years)
- -9.0%
Cash Flow
Net Operating Income (NOI) minus mortgage payments.
Calculation:
NOI - Mortgage Payments
Cap Rate (Market Value)
Capitalization Rate is a rate of return that compares the yearly Net Operating Income (NOI) to the market value.
Calculation:
NOI / Market Value
Cash-on-Cash Return (CoC)
Annual Cash Flow / Cash Invested
Calculation:
Annual cash flow divided by initial cash invested.
Debt Coverage Ratio (DCR)
Net Operating Income (NOI) divided by total debt payments.
Calculation:
NOI / Total Debt Payments
Internal Rate of Return (IRR)
A metric for assessing profitability over time. IRR is the discount rate at which the net present value (NPV) of all future cash flows (positive and negative) from an investment equals zero — including both periodic cash flow (such as rent) and a projected sale at the end of the holding period. It represents the expected annualized return, accounting for income, expenses, and the recovery of capital through a future sale.
Purchase Details
Purchase PriceThe price paid for the property. Purchase price:
| $865,000 |
|---|---|
Amount FinancedThe amount of the purchase financed through a loan. Amount financed:
| -$692,000 |
Down paymentThe initial payment made towards the purchase. Down payment:
| $173,000 |
Closing CostsFees and expenses associated with purchasing a property, typically ranging from 2% to 5% of the home’s purchase price, paid at the end of a home purchase to cover services like lending, title transfer, and taxes. Closing costs:
| $25,950 |
Rehab CostsCosts incurred to repair or improve the property, including: roof, flooring, exterior siding, kitchen, exterior paint, bathrooms, etc. Rehab costs:
| $0 |
Initial Cash InvestedThe total initial cash invested in the property. Calculation:Down payment + Buying costs + Rehab costs Initial cash invested:
| $198,950 |
Square Feet (SQFT)The total square footage of the property. Square feet:
| 3,973 |
Cost Per Square FootCost per square foot of the property. Calculation:Purchase Price / Square Feet Cost per square foot:
| $218 |
Monthly Rent Per Square FootMonthly rent divided by the number of square feet. This ratio helps investors compare rental income efficiency across properties, markets, and unit sizes Calculation:Monthly Rent / Square Feet Monthly rent per square foot:
| $1.23 |
Financing Details
Loan AmountThe total sum of money borrowed from a lender to finance a property purchase. Calculation:Purchase Price - Down Payment
Loan amount:
| $692,000 |
|---|---|
Loan to Value Ratio (LTV)Loan amount divided by the market value of the property. Calculation:Loan Amount / Market Value
Loan to value ratio:
| 80.0% |
Loan TypeThe type of loan (e.g., fixed, adjustable).
Loan type:
| Amortizing |
TermThe loan repayment period in years.
Term:
| 30 years |
Interest RateThe percentage a lender charges on the borrowed amount of a loan, determining the cost of borrowing money.
Interest rate:
| 6.625% |
Principal & Interest (PI)The principal is the portion of the loan payment that reduces the loan balance. The interest is the lender's charge for borrowing money. Calculation:(P * r * (1 + r) ** n) / ((1 + r) ** n - 1) Where:
P = Loan amount (principal)
Principal & interest:
| $4,431 |
Property TaxesAnnual taxes levied by local governments on real estate properties. These taxes fund public services like schools, roads, and emergency services.
Property tax:
| $826 |
InsuranceThe costs for insurance coverage to protect against financial losses due to risks like fire, natural disasters, theft, liability, or tenant-related damages. Calculation:Assumes 7% of gross rental income, unless insurance rates are specified.
Insurance:
| $343 |
Private Mortgage Insurance (PMI)A fee that borrowers pay when they take out a conventional loan with a loan-to-value (LTV) ratio above 80%.
Private mortgage insurance (PMI):
| $0 |
Monthly PaymentThe fixed amount a borrower pays each month to repay a loan. It typically includes principal and interest (P&I) and may also cover property taxes, insurance, HOA fees, and PMI if escrowed. Monthly payment:
| $5,600 |
Operating Income
| % Rent | Monthly | Yearly | |
|---|---|---|---|
Gross RentThe total rental income received from tenants before deducting any expenses. Includes base rent, late fees, pet fees, parking fees, and other recurring charges.
Gross rent:
| $4,900 | $58,800 | |
Vacancy LossExpected loss of rent due to vacancies.
Vacancy loss:
(6%)
| 6% | -$294 | -$3,528 |
Operating IncomeGross rental income minus vacancy loss. Calculation:Gross rent - Vacancy loss
Operating income:
| $4,606 | $55,272 |
Operating Expenses
| % Rent | Monthly | Yearly | |
|---|---|---|---|
Property TaxesAnnual taxes levied by local governments on real estate properties. These taxes fund public services like schools, roads, and emergency services. | 17% | -$826 | -$9,911 |
InsuranceThe costs for insurance coverage to protect against financial losses due to risks like fire, natural disasters, theft, liability, or tenant-related damages. Calculation:Assumes 7% of gross rental income, unless insurance rates are specified. | 7% | -$343 | -$4,116 |
Property ManagementThe costs associated with hiring a property manager to handle the day-to-day operations of a rental property. Includes management fees, leasing fes, eviction fees, etc. Calculation:Assumes 8% of gross rental income. | 8% | -$392 | -$4,704 |
Repairs & MaintenanceOngoing costs for routine upkeep and minor fixes needed to keep a property in good working condition. Calculation:Assumes 5% of gross rental income. Varies by property age and condition. | 5% | -$245 | -$2,940 |
Capital ExpensesLarge, infrequent costs for major improvements or replacements, like a new roof, HVAC system, or appliances. Calculation:Assumes 5% of gross rental income. Varies by property age. | 5% | -$245 | -$2,940 |
HOA FeesRegular dues paid to a Homeowners Association for community maintenance, amenities, and management. Similar fees include: Condo Association Fees, Co-op Maintenance Fees, etc. | 7% | -$347 | -$4,164 |
Operating ExpensesRecurring costs required to maintain and manage a rental property, including property taxes, insurance, maintenance, repairs, utilities (if paid by the owner), property management fees, and other day-to-day expenses. Calculation:Insurance + Property Taxes + Property Management + Repairs & Maintenance + Capital Expenditures + HOA Fees | 49% | -$2,398 | -$28,775 |
Cash Flow
| Monthly | Yearly | |
|---|---|---|
Net Operating Income (NOI)The income generated from a property after deducting all operating expenses but before deducting mortgage payments, taxes, and capital expenditures. Calculation:Gross Operating Income - Operating Expenses
Net operating income:
| $2,208 | $26,496 |
Mortgage PaymentThe fixed amount a borrower pays each month to repay a loan. It typically includes principal and interest (P&I) and may also cover property taxes, insurance, HOA fees, and PMI if escrowed. | -$4,431 | -$53,172 |
Cash FlowNet Operating Income (NOI) minus mortgage payments. Calculation:NOI - Mortgage Payments | $2,223 | $26,676 |