$330,000
Investment Summary
- Monthly Cash Flow
- -$540
- Cap Rate
- 4.2%
- Cash-on-Cash Return
- -8.5%
- Debt Coverage Ratio
- 0.68
- Internal Rate of Return (5 years)
- -4.3%
Cash Flow
Net Operating Income (NOI) minus mortgage payments.
Calculation:
NOI - Mortgage Payments
Cap Rate (Market Value)
Capitalization Rate is a rate of return that compares the yearly Net Operating Income (NOI) to the market value.
Calculation:
NOI / Market Value
Cash-on-Cash Return (CoC)
Annual Cash Flow / Cash Invested
Calculation:
Annual cash flow divided by initial cash invested.
Debt Coverage Ratio (DCR)
Net Operating Income (NOI) divided by total debt payments.
Calculation:
NOI / Total Debt Payments
Internal Rate of Return (IRR)
A metric for assessing profitability over time. IRR is the discount rate at which the net present value (NPV) of all future cash flows (positive and negative) from an investment equals zero — including both periodic cash flow (such as rent) and a projected sale at the end of the holding period. It represents the expected annualized return, accounting for income, expenses, and the recovery of capital through a future sale.
Property Description
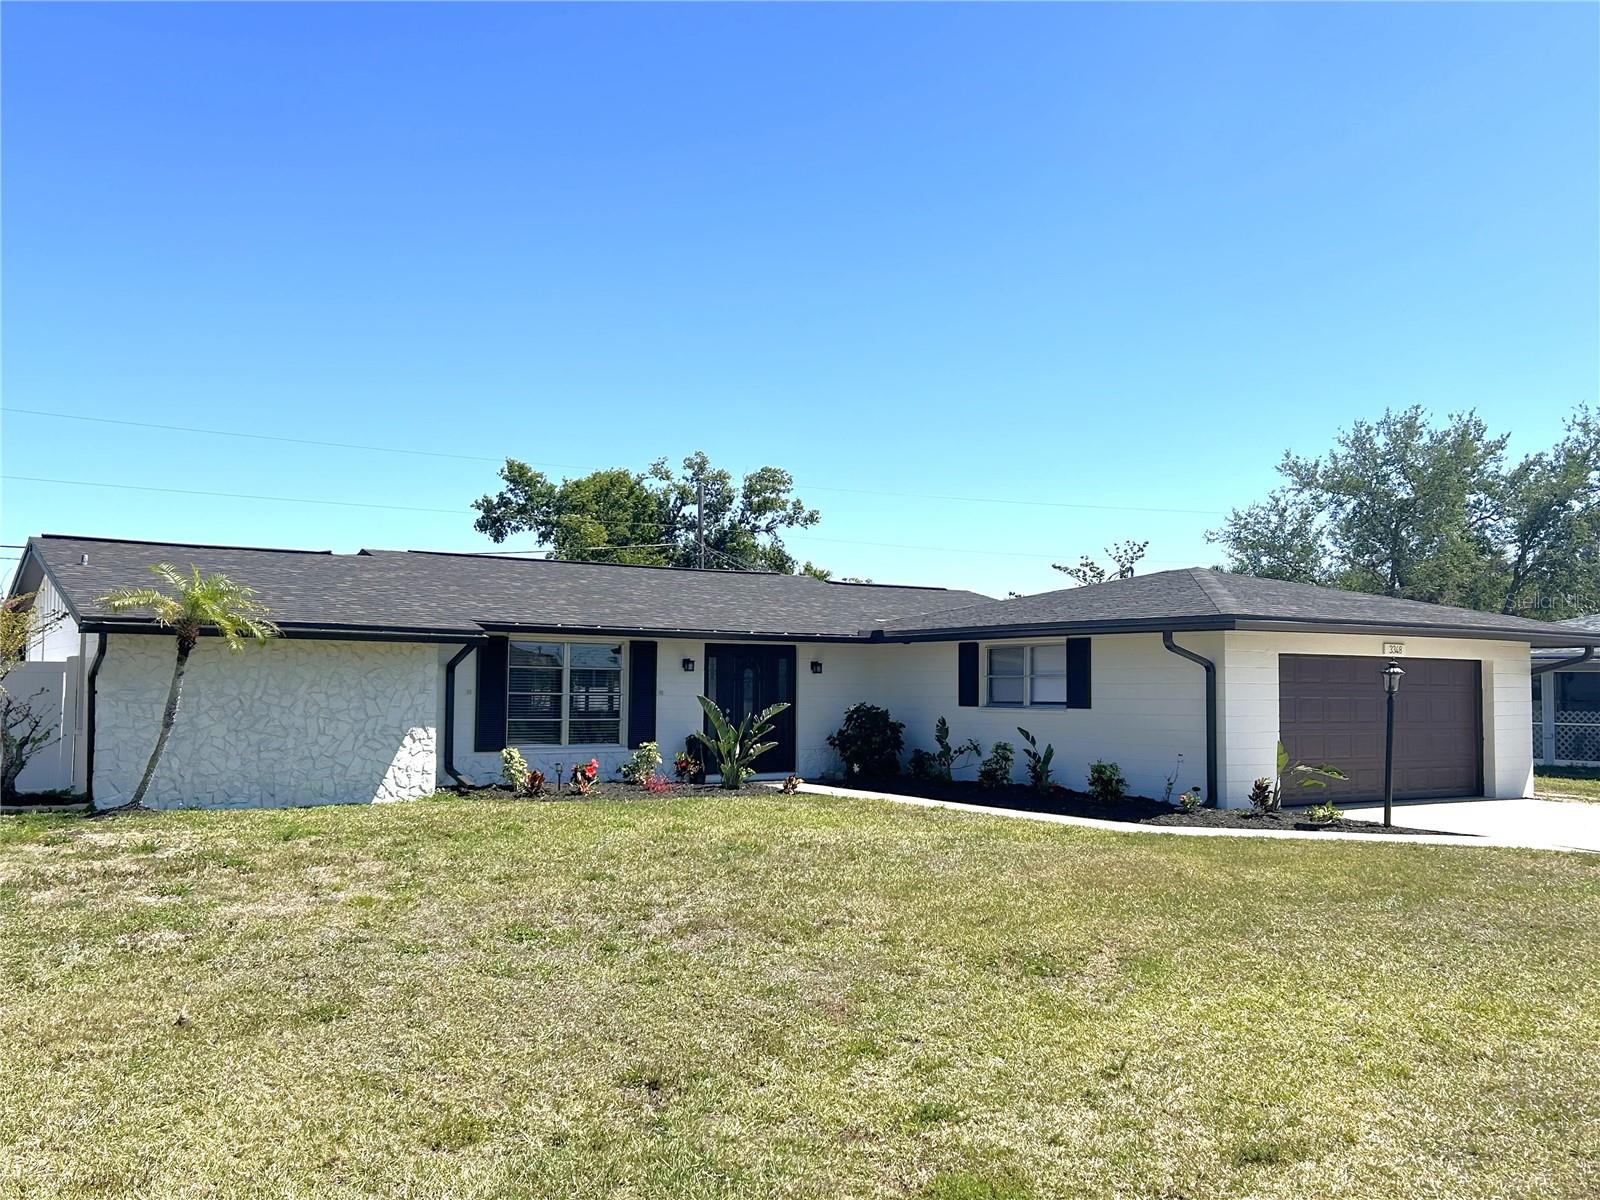
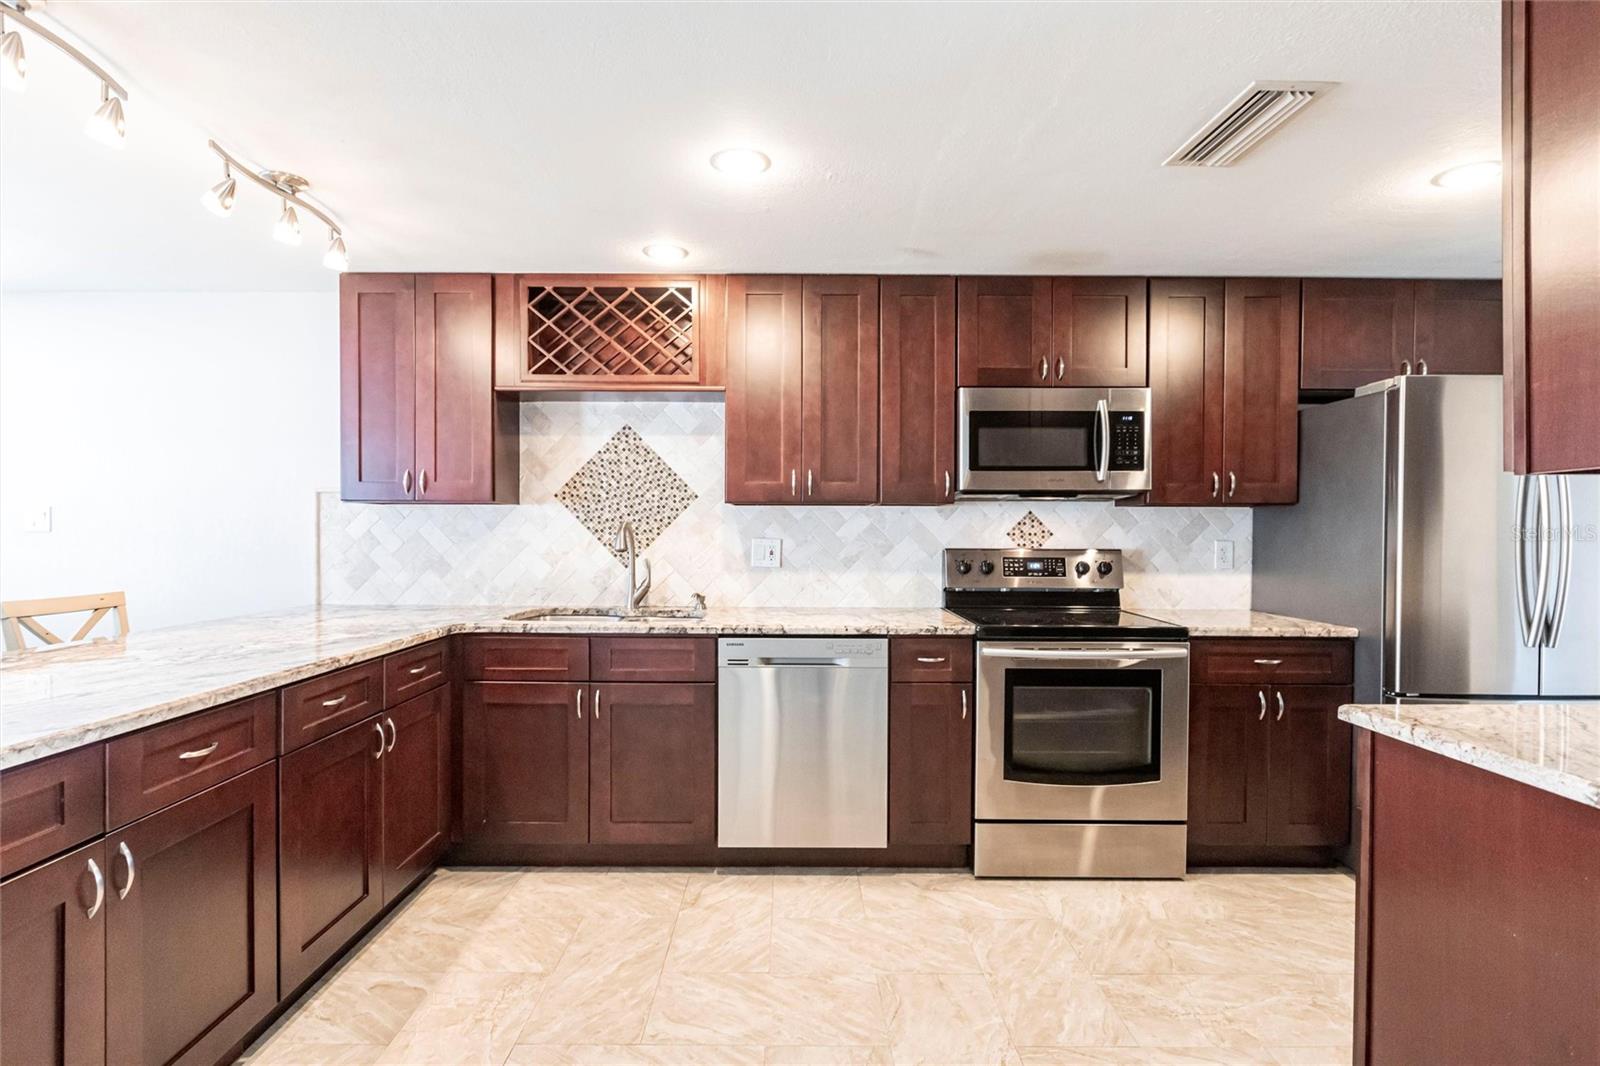
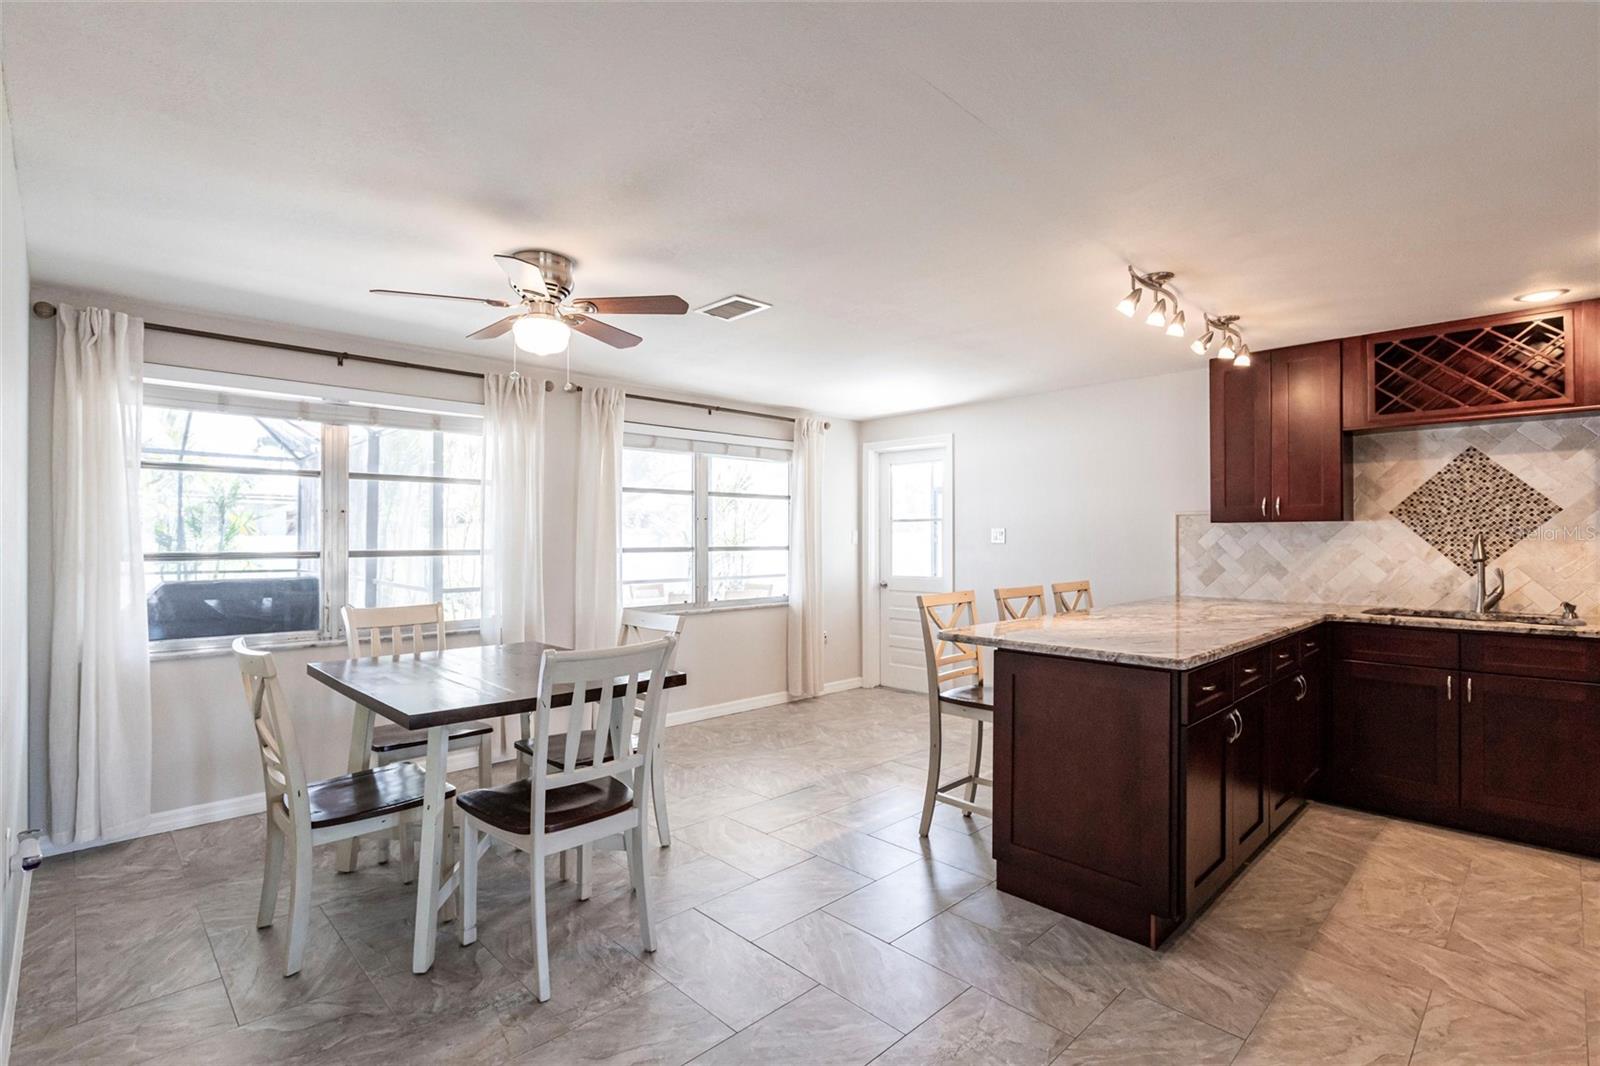
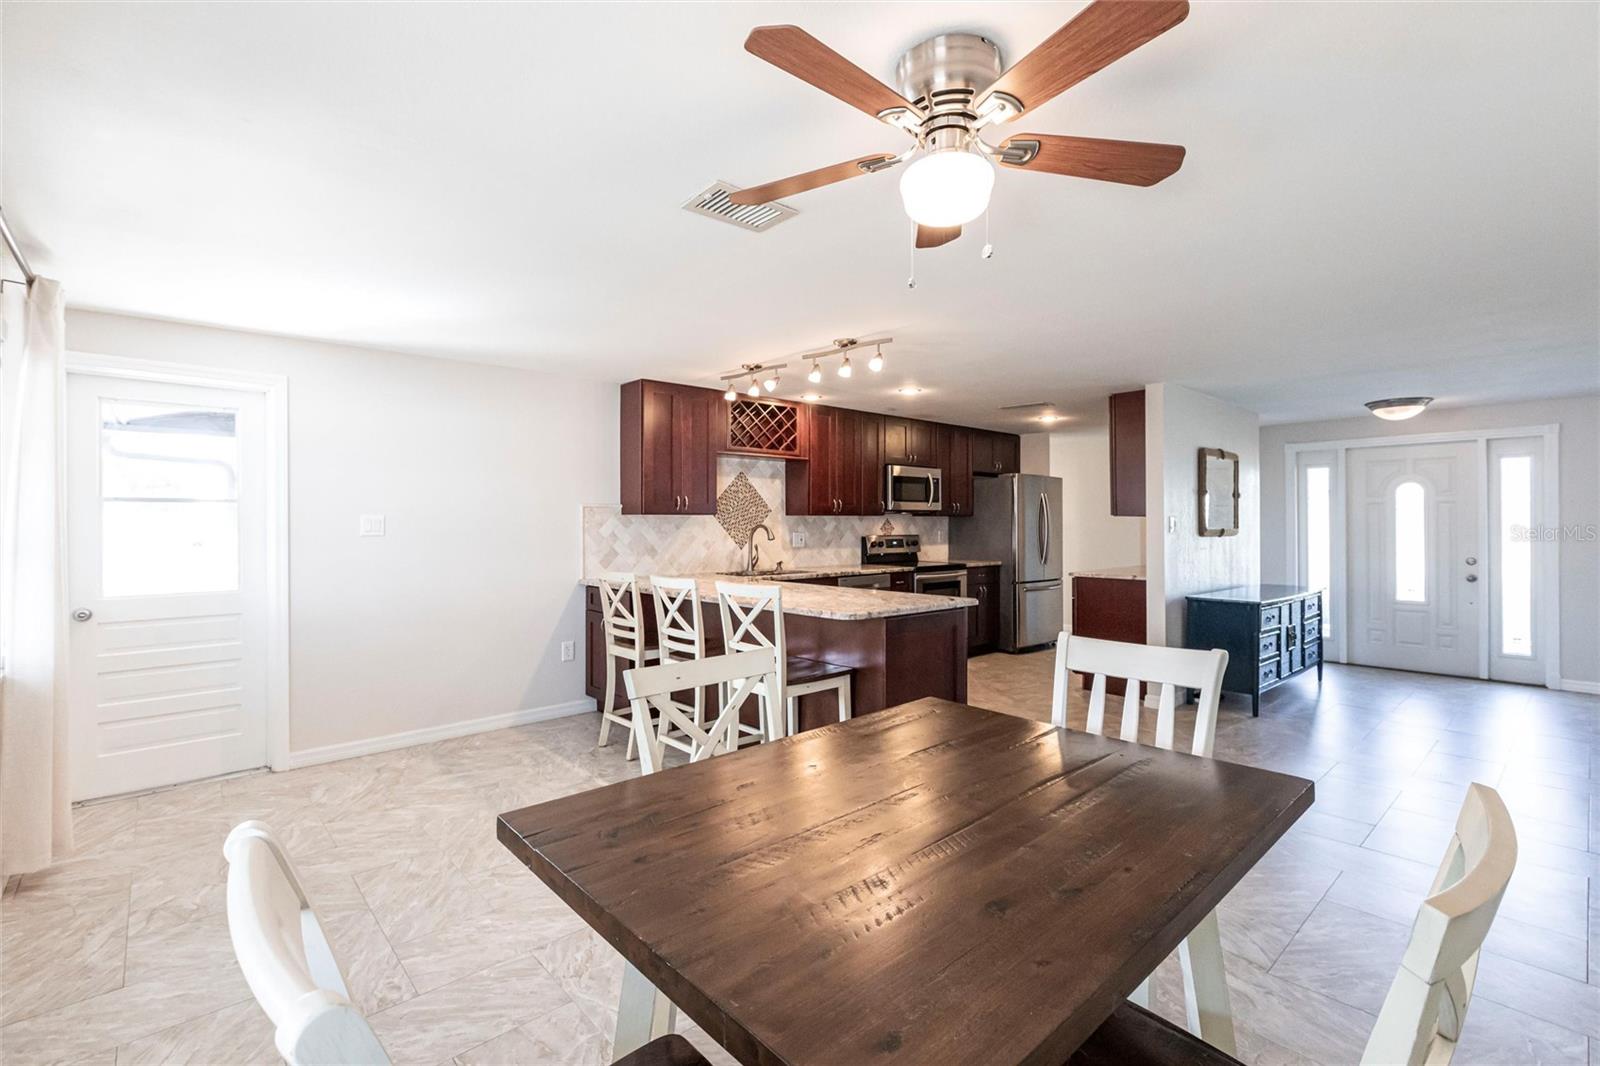
Welcome to this beautifully updated 3-bedroom, 2-bathroom pool home with a 2-car garage, located in the highly sought-after city of Port Charlotte. Offering over 1,548 square feet of living space, this home provides a spacious and welcoming atmosphere, perfect for you to make it your own. Upon entering, you'll be greeted by an open, split floor plan that ensures both privacy and functionality. The large living room seamlessly flows into the kitchen, featuring granite countertops with a stylish brick-style backsplash, a suite of stainless-steel appliances, ample storage space, and a breakfast bar that opens to the dining area—ideal for both everyday living and entertaining. The tiled flooring throughout this space ensures easy maintenance and lasting durability. The primary suite features private slider access to the pool and lanai area, along with wood tile flooring and a spacious walk-in closet. The updated attached bathroom offers a stunning corner walk-in shower with a frameless glass door and a granite-top vanity. The two additional guest bedrooms both include walk-in closets, with one featuring French doors. One room is currently being used as an office/den, offering versatile space for your needs. The guest bathroom has been updated and features a shower/tub combo, complementing the style of the primary bathroom. Step outside to a screened-in lanai featuring a sparkling heated pool, ideal for soaking up the beautiful Florida sunshine. Whether you're looking to take a refreshing swim or unwind on the pool deck, this outdoor space provides endless opportunities for relaxation and entertainment. Adjacent to the pool, you'll find a charming covered patio area, perfect for al fresco dining or simply enjoying a shady retreat. Whether you're savoring a meal outdoors or relaxing with a cool drink, this inviting space offers a comfortable spot to unwind and enjoy the Florida breeze. The backyard is fully fenced with new vinyl fencing, providing both privacy and security. Additionally, a 10x10 shed offers ample space for outdoor storage, making it perfect for keeping your tools, equipment, or other belongings organized. This home also boasts several recent upgrades, including a new garage door, a new A/C unit installed in 2022, and a re-roof completed in 2022. The pool cage was updated in 2022, pool heater was replaced in 2019 and pump in 2024 for added convenience. Additional features include fresh interior paint, hurricane storm shutters for peace of mind, public water and sewer, and a 2-car garage with a utility sink and dedicated laundry area. Centrally located to all major stores, eateries, schools, Gulf beaches, golf and more. Port Charlotte Beach Park and Boat Ramp is a 5-minute drive away. While there enjoy the public beach, picnic areas, playground, tennis courts, boat ramp and swimming pool. ****PLEASE ENJOY THE 3D INTERACTIVE VIRTUAL TOUR ASSOCITED WITH THIS LISTING.
Build Your Team
Quickly find investor-friendly professionals who can help you succeed in real estate investing at any stage of the investing journey.


Agents
Match with investor-friendly agents who can help you find, analyze, and close your next deal


Lenders
Get the best funding…find investor-friendly lenders who specialize in your deal strategy


Property Managers
Transition to passive investing. Find a trusted property management partnership that lasts.


Tax Pros & Accountants
Taxes and financial reporting made easy—find experts to create tax savings strategies, file taxes, and more
Location
Property Details
Parking
- Description: Garage
- Details: Driveway, Garage Door Opener, Off Street, Attached
- Garage Spaces: 2
- Spaces Total: 0
Bedroom Information
- # of Bedrooms: 3
Bathroom Information
- # of Baths (Full): 2
- # of Baths (Total): 2.0
Interior Features
- # of Rooms: 6
- # of Stories: 1
Exterior Features
- Exterior Walls Materials: Ceramic tile
- Foundation: Slab
- Roof Material: Shingle
- Pool: Yes
Land Information
- Land Use: Residential
- Land Use Subtype: Single Family Residential
Lot Information
- Parcel ID: 402221407003
- Lot Size: 10000 sqft
Property Information
- Property Type: Single Family Residence
- Year Built: 1971
Tax Information
- Annual Tax: $4,414
Utilities
- Water & Sewer: Public
- Heating: Electric
- Cooling: Central Air
Location
- County: Charlotte
Listing Details
Investment Summary
- Monthly Cash Flow
- -$540
- Cap Rate
- 4.2%
- Cash-on-Cash Return
- -8.5%
- Debt Coverage Ratio
- 0.68
- Internal Rate of Return (5 years)
- -4.3%
Cash Flow
Net Operating Income (NOI) minus mortgage payments.
Calculation:
NOI - Mortgage Payments
Cap Rate (Market Value)
Capitalization Rate is a rate of return that compares the yearly Net Operating Income (NOI) to the market value.
Calculation:
NOI / Market Value
Cash-on-Cash Return (CoC)
Annual Cash Flow / Cash Invested
Calculation:
Annual cash flow divided by initial cash invested.
Debt Coverage Ratio (DCR)
Net Operating Income (NOI) divided by total debt payments.
Calculation:
NOI / Total Debt Payments
Internal Rate of Return (IRR)
A metric for assessing profitability over time. IRR is the discount rate at which the net present value (NPV) of all future cash flows (positive and negative) from an investment equals zero — including both periodic cash flow (such as rent) and a projected sale at the end of the holding period. It represents the expected annualized return, accounting for income, expenses, and the recovery of capital through a future sale.
Purchase Details
Purchase PriceThe price paid for the property. Purchase price:
| $330,000 |
|---|---|
Amount FinancedThe amount of the purchase financed through a loan. Amount financed:
| -$264,000 |
Down paymentThe initial payment made towards the purchase. Down payment:
| $66,000 |
Closing CostsFees and expenses associated with purchasing a property, typically ranging from 2% to 5% of the home’s purchase price, paid at the end of a home purchase to cover services like lending, title transfer, and taxes. Closing costs:
| $9,900 |
Rehab CostsCosts incurred to repair or improve the property, including: roof, flooring, exterior siding, kitchen, exterior paint, bathrooms, etc. Rehab costs:
| $0 |
Initial Cash InvestedThe total initial cash invested in the property. Calculation:Down payment + Buying costs + Rehab costs Initial cash invested:
| $75,900 |
Square Feet (SQFT)The total square footage of the property. Square feet:
| 1,548 |
Cost Per Square FootCost per square foot of the property. Calculation:Purchase Price / Square Feet Cost per square foot:
| $213 |
Monthly Rent Per Square FootMonthly rent divided by the number of square feet. This ratio helps investors compare rental income efficiency across properties, markets, and unit sizes Calculation:Monthly Rent / Square Feet Monthly rent per square foot:
| $1.42 |
Financing Details
Loan AmountThe total sum of money borrowed from a lender to finance a property purchase. Calculation:Purchase Price - Down Payment
Loan amount:
| $264,000 |
|---|---|
Loan to Value Ratio (LTV)Loan amount divided by the market value of the property. Calculation:Loan Amount / Market Value
Loan to value ratio:
| 80.0% |
Loan TypeThe type of loan (e.g., fixed, adjustable).
Loan type:
| Amortizing |
TermThe loan repayment period in years.
Term:
| 30 years |
Interest RateThe percentage a lender charges on the borrowed amount of a loan, determining the cost of borrowing money.
Interest rate:
| 6.625% |
Principal & Interest (PI)The principal is the portion of the loan payment that reduces the loan balance. The interest is the lender's charge for borrowing money. Calculation:(P * r * (1 + r) ** n) / ((1 + r) ** n - 1) Where:
P = Loan amount (principal)
Principal & interest:
| $1,690 |
Property TaxesAnnual taxes levied by local governments on real estate properties. These taxes fund public services like schools, roads, and emergency services.
Property tax:
| $368 |
InsuranceThe costs for insurance coverage to protect against financial losses due to risks like fire, natural disasters, theft, liability, or tenant-related damages. Calculation:Assumes 7% of gross rental income, unless insurance rates are specified.
Insurance:
| $154 |
Private Mortgage Insurance (PMI)A fee that borrowers pay when they take out a conventional loan with a loan-to-value (LTV) ratio above 80%.
Private mortgage insurance (PMI):
| $0 |
Monthly PaymentThe fixed amount a borrower pays each month to repay a loan. It typically includes principal and interest (P&I) and may also cover property taxes, insurance, HOA fees, and PMI if escrowed. Monthly payment:
| $2,212 |
Operating Income
| % Rent | Monthly | Yearly | |
|---|---|---|---|
Gross RentThe total rental income received from tenants before deducting any expenses. Includes base rent, late fees, pet fees, parking fees, and other recurring charges.
Gross rent:
| $2,200 | $26,400 | |
Vacancy LossExpected loss of rent due to vacancies.
Vacancy loss:
(6%)
| 6% | -$132 | -$1,584 |
Operating IncomeGross rental income minus vacancy loss. Calculation:Gross rent - Vacancy loss
Operating income:
| $2,068 | $24,816 |
Operating Expenses
| % Rent | Monthly | Yearly | |
|---|---|---|---|
Property TaxesAnnual taxes levied by local governments on real estate properties. These taxes fund public services like schools, roads, and emergency services. | 17% | -$368 | -$4,414 |
InsuranceThe costs for insurance coverage to protect against financial losses due to risks like fire, natural disasters, theft, liability, or tenant-related damages. Calculation:Assumes 7% of gross rental income, unless insurance rates are specified. | 7% | -$154 | -$1,848 |
Property ManagementThe costs associated with hiring a property manager to handle the day-to-day operations of a rental property. Includes management fees, leasing fes, eviction fees, etc. Calculation:Assumes 8% of gross rental income. | 8% | -$176 | -$2,112 |
Repairs & MaintenanceOngoing costs for routine upkeep and minor fixes needed to keep a property in good working condition. Calculation:Assumes 5% of gross rental income. Varies by property age and condition. | 5% | -$110 | -$1,320 |
Capital ExpensesLarge, infrequent costs for major improvements or replacements, like a new roof, HVAC system, or appliances. Calculation:Assumes 5% of gross rental income. Varies by property age. | 5% | -$110 | -$1,320 |
HOA FeesRegular dues paid to a Homeowners Association for community maintenance, amenities, and management. Similar fees include: Condo Association Fees, Co-op Maintenance Fees, etc. | n/a | n/a | n/a |
Operating ExpensesRecurring costs required to maintain and manage a rental property, including property taxes, insurance, maintenance, repairs, utilities (if paid by the owner), property management fees, and other day-to-day expenses. Calculation:Insurance + Property Taxes + Property Management + Repairs & Maintenance + Capital Expenditures + HOA Fees | 42% | -$918 | -$11,014 |
Cash Flow
| Monthly | Yearly | |
|---|---|---|
Net Operating Income (NOI)The income generated from a property after deducting all operating expenses but before deducting mortgage payments, taxes, and capital expenditures. Calculation:Gross Operating Income - Operating Expenses
Net operating income:
| $1,150 | $13,800 |
Mortgage PaymentThe fixed amount a borrower pays each month to repay a loan. It typically includes principal and interest (P&I) and may also cover property taxes, insurance, HOA fees, and PMI if escrowed. | -$1,690 | -$20,280 |
Cash FlowNet Operating Income (NOI) minus mortgage payments. Calculation:NOI - Mortgage Payments | $540 | $6,480 |