
$869,900
Investment Summary
- Monthly Cash Flow
- -$2,132
- Cap Rate
- 3.3%
- Cash-on-Cash Return
- -12.8%
- Debt Coverage Ratio
- 0.53
- Internal Rate of Return (5 years)
- -8.4%
Cash Flow
Net Operating Income (NOI) minus mortgage payments.
Calculation:
NOI - Mortgage Payments
Cap Rate (Market Value)
Capitalization Rate is a rate of return that compares the yearly Net Operating Income (NOI) to the market value.
Calculation:
NOI / Market Value
Cash-on-Cash Return (CoC)
Annual Cash Flow / Cash Invested
Calculation:
Annual cash flow divided by initial cash invested.
Debt Coverage Ratio (DCR)
Net Operating Income (NOI) divided by total debt payments.
Calculation:
NOI / Total Debt Payments
Internal Rate of Return (IRR)
A metric for assessing profitability over time. IRR is the discount rate at which the net present value (NPV) of all future cash flows (positive and negative) from an investment equals zero — including both periodic cash flow (such as rent) and a projected sale at the end of the holding period. It represents the expected annualized return, accounting for income, expenses, and the recovery of capital through a future sale.
Property Description
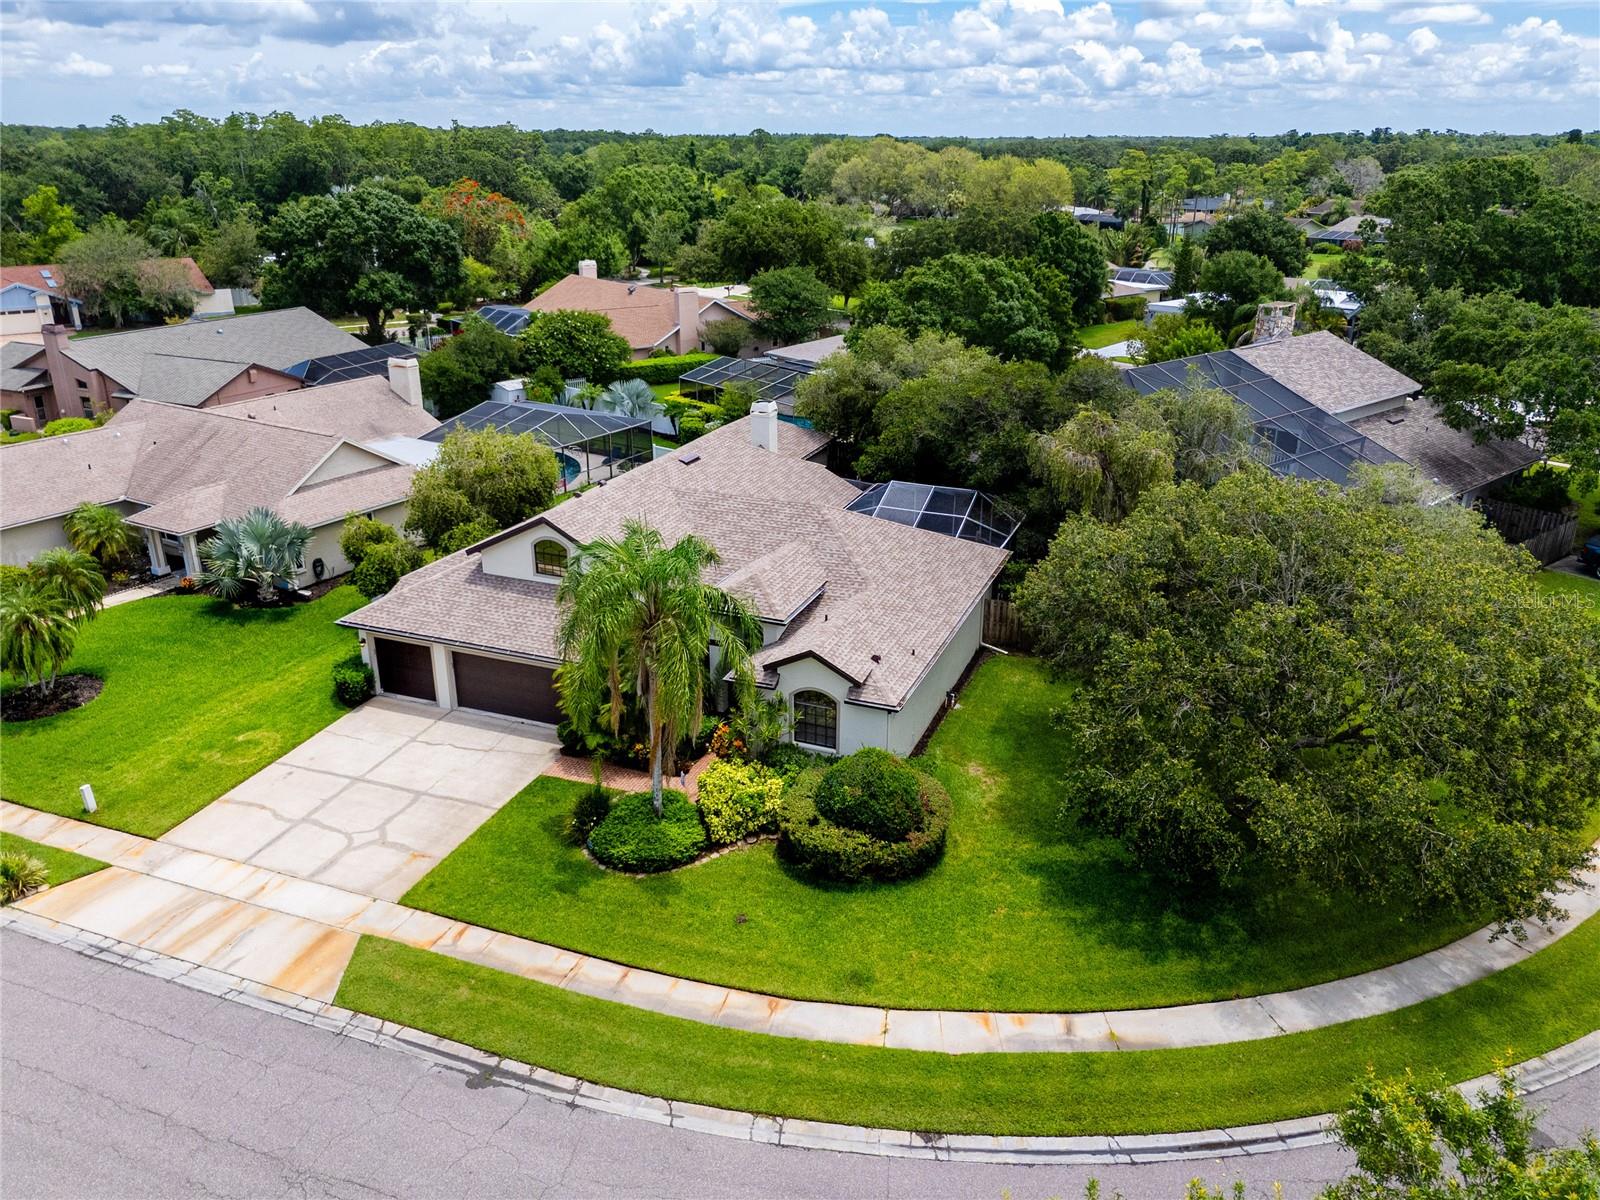
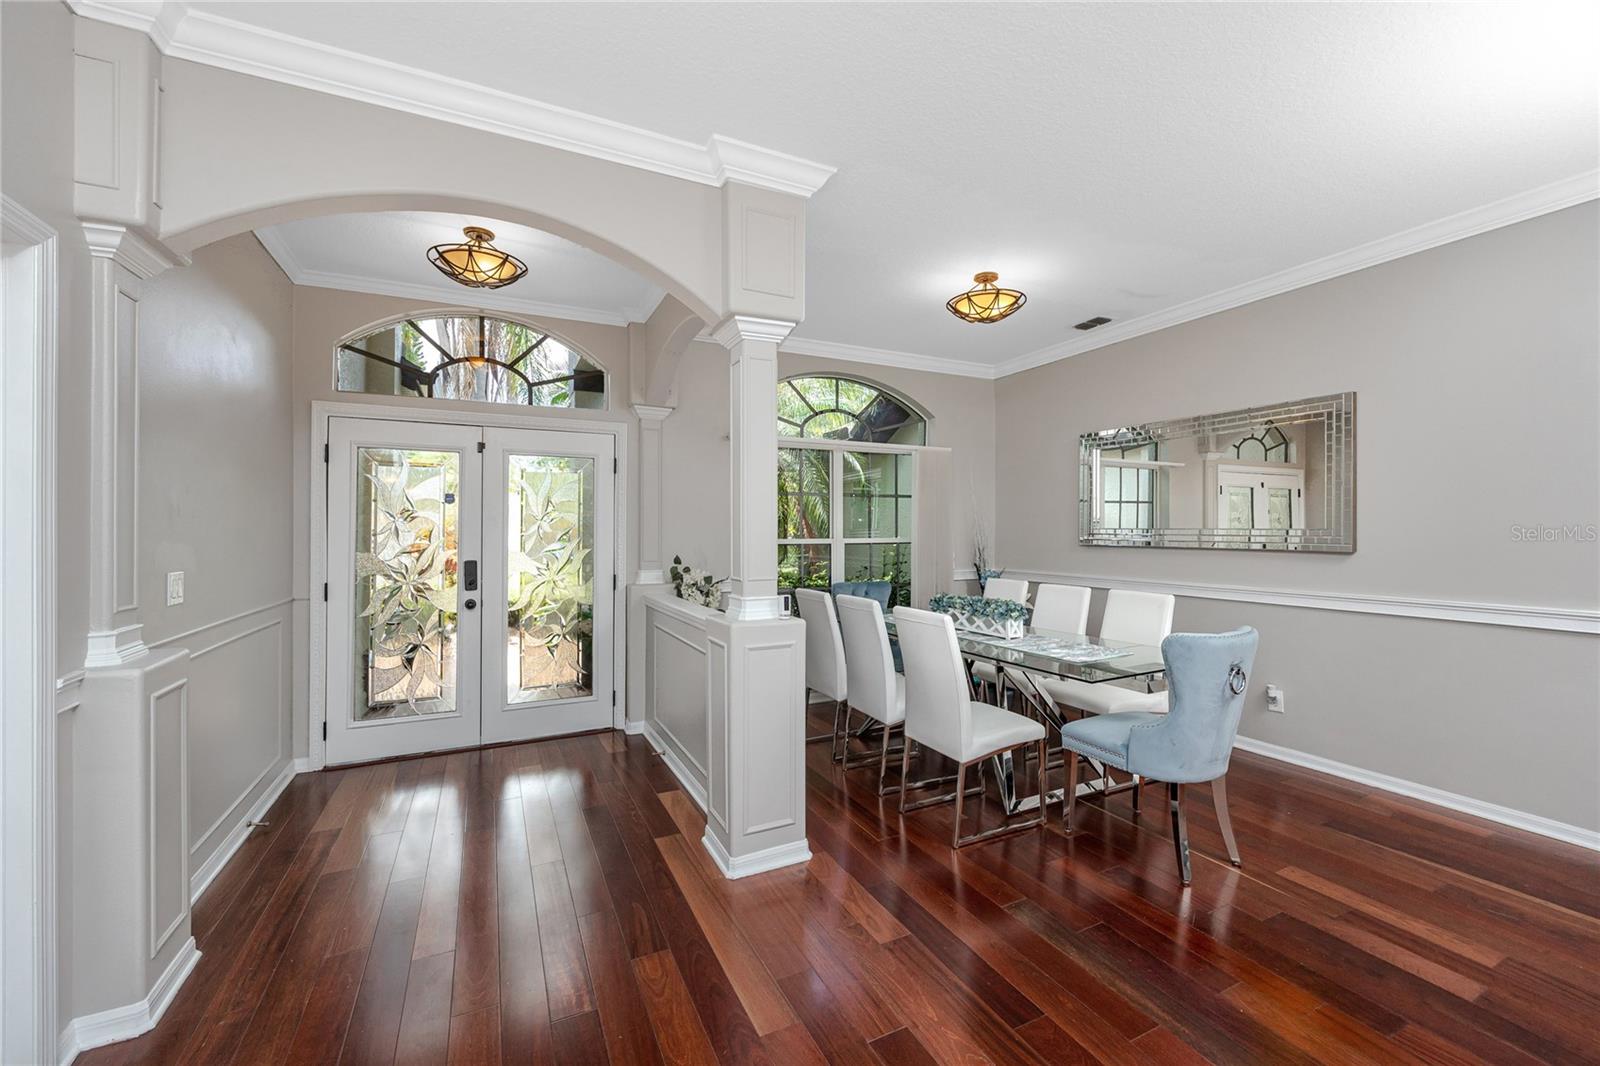
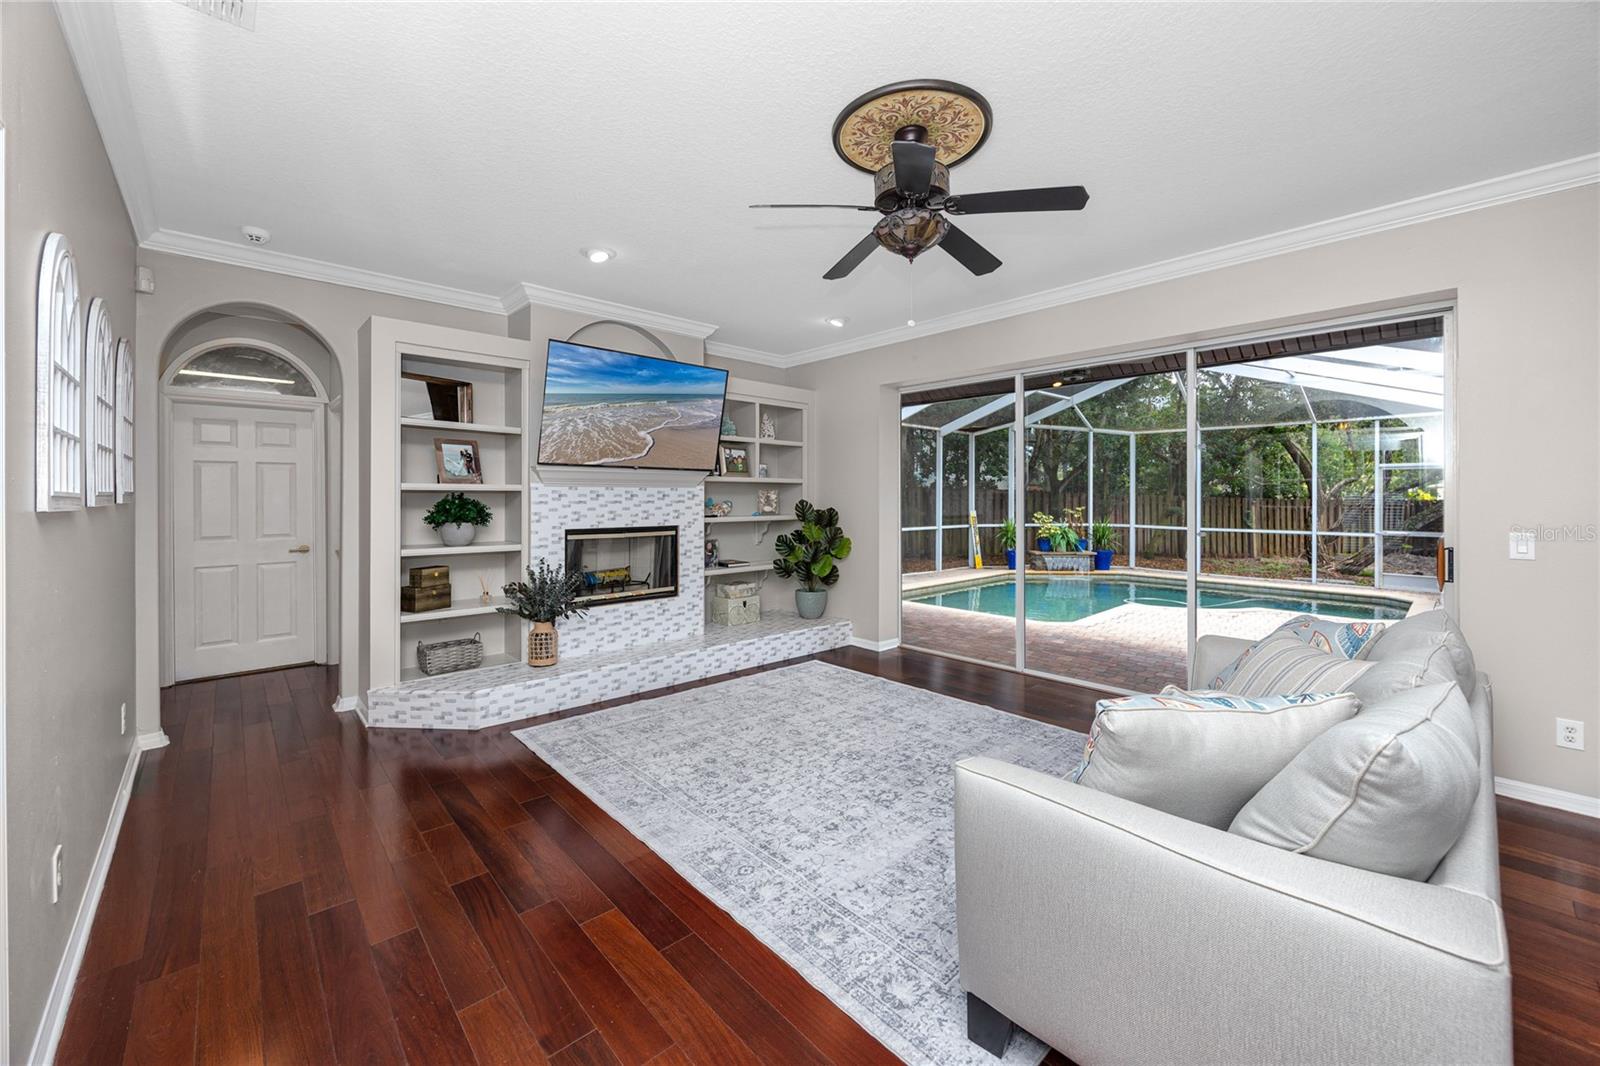
Step into timeless elegance and modern comfort in this exceptional luxury home in Oldsmar—now also available for lease at $6,500/month—where architectural detail and expansive living converge in a quiet, upscale setting. Located in the gated community of East Woodlands, this residence enjoys access to an array of resort-style amenities including pools, pickleball, golf, and dining at the nearby Ardea Golf Club, which offers flexible membership options. A grand sense of arrival awaits as you pass through double leaded glass doors into a stately foyer with soaring ceilings, architectural columns, a transom window, and classic wainscoting that set the tone for the refined details found throughout the home. Arched doorways and windows, rich hardwood floors, and crisp white millwork accented with crown molding showcase the home’s craftsmanship at every turn. To the right, the formal dining room overlooks lush, manicured landscaping, while the elegant living room and spacious family room with a custom fireplace offer serene views of the pool and open seamlessly into the kitchen—creating the ideal space for both relaxation and entertaining. The heart of the home is the chef-inspired kitchen, thoughtfully designed with a farmhouse sink, stainless steel appliances, abundant cabinetry, and a large center island with bar seating. A built-in desk provides a convenient workspace, while the breakfast nook with wraparound aquarium glass windows overlooks the pool, turning everyday meals into a scenic retreat. Outdoor living takes center stage in the screened-in lanai featuring a uniquely shaped L-style saltwater pool with tranquil waterfall features. Surrounded by lush tropical landscaping and multiple lounge areas, this private sanctuary invites you to host gatherings or simply unwind and enjoy peaceful Florida evenings. The luxurious primary suite offers direct access to the pool and includes a spacious walk-in closet and a spa-like ensuite bath with a soaking tub, separate shower, water closet, and dual vanities with a dedicated makeup and dressing area. Each additional bedroom is generously sized, with ample closet space and views or access to the pool area, making the home both functional and comfortable. Designed with versatility in mind, the home also features a dedicated office and an upstairs bonus room with its own HVAC system, oversized window, and two walk-in closets—ideal as a guest suite, gym, media room, or creative flex space. A full pool bath ensures comfort for visitors, while the oversized three-car garage with built-in cabinetry adds smart storage solutions. The laundry room is well-equipped with a utility sink and folding counter. This exceptional property sits on a fully fenced lot in one of Oldsmar’s most desirable neighborhoods and offers the perfect blend of indoor luxury and outdoor lifestyle. Whether you’re hosting poolside celebrations or enjoying coffee in the morning sun, this home delivers timeless sophistication and modern functionality. Recent updates include a new roof in 2024, refrigerator in 2023, washer and dryer in 2020, and a new pool pump and saltwater system in 2023—making this home as move-in ready as it is beautiful.
Build Your Team
Quickly find investor-friendly professionals who can help you succeed in real estate investing at any stage of the investing journey.


Agents
Match with investor-friendly agents who can help you find, analyze, and close your next deal


Lenders
Get the best funding…find investor-friendly lenders who specialize in your deal strategy


Property Managers
Transition to passive investing. Find a trusted property management partnership that lasts.


Tax Pros & Accountants
Taxes and financial reporting made easy—find experts to create tax savings strategies, file taxes, and more
Location
Property Details
Parking
- Description: Driveway, Garage Door Opener
- Details: Attached
- Garage Spaces: 3
- Spaces Total: 0
Bedroom Information
- # of Bedrooms: 5
Bathroom Information
- # of Baths (Full): 3
- # of Baths (Total): 4.0
Interior Features
- # of Rooms: 9
- # of Stories: 2
- Fireplace: Yes
Exterior Features
- Exterior Walls Materials: Stucco
- Foundation: Slab
- Roof Type: Gable
- Roof Material: Shingle
- Pool: Yes
HOA
- Has HOA: Yes
- Association: East Lake Woodlands Comm Assn
- HOA Fee: $1,248/annually
Land Information
- Land Use: Residential
- Land Use Subtype: Single Family Residential
Lot Information
- Parcel ID: 092816239250001480
- Lot Size: 12092 sqft
Property Information
- Property Type: Single Family Residence
- Year Built: 2001
Tax Information
- Annual Tax: $12,060
Utilities
- Water & Sewer: Public
- Heating: Central
- Cooling: Central Air
Location
- County: Pinellas
Listing Details
Investment Summary
- Monthly Cash Flow
- -$2,132
- Cap Rate
- 3.3%
- Cash-on-Cash Return
- -12.8%
- Debt Coverage Ratio
- 0.53
- Internal Rate of Return (5 years)
- -8.4%
Cash Flow
Net Operating Income (NOI) minus mortgage payments.
Calculation:
NOI - Mortgage Payments
Cap Rate (Market Value)
Capitalization Rate is a rate of return that compares the yearly Net Operating Income (NOI) to the market value.
Calculation:
NOI / Market Value
Cash-on-Cash Return (CoC)
Annual Cash Flow / Cash Invested
Calculation:
Annual cash flow divided by initial cash invested.
Debt Coverage Ratio (DCR)
Net Operating Income (NOI) divided by total debt payments.
Calculation:
NOI / Total Debt Payments
Internal Rate of Return (IRR)
A metric for assessing profitability over time. IRR is the discount rate at which the net present value (NPV) of all future cash flows (positive and negative) from an investment equals zero — including both periodic cash flow (such as rent) and a projected sale at the end of the holding period. It represents the expected annualized return, accounting for income, expenses, and the recovery of capital through a future sale.
Purchase Details
Purchase PriceThe price paid for the property. Purchase price:
| $869,900 |
|---|---|
Amount FinancedThe amount of the purchase financed through a loan. Amount financed:
| -$695,920 |
Down paymentThe initial payment made towards the purchase. Down payment:
| $173,980 |
Closing CostsFees and expenses associated with purchasing a property, typically ranging from 2% to 5% of the home’s purchase price, paid at the end of a home purchase to cover services like lending, title transfer, and taxes. Closing costs:
| $26,097 |
Rehab CostsCosts incurred to repair or improve the property, including: roof, flooring, exterior siding, kitchen, exterior paint, bathrooms, etc. Rehab costs:
| $0 |
Initial Cash InvestedThe total initial cash invested in the property. Calculation:Down payment + Buying costs + Rehab costs Initial cash invested:
| $200,077 |
Square Feet (SQFT)The total square footage of the property. Square feet:
| 3,035 |
Cost Per Square FootCost per square foot of the property. Calculation:Purchase Price / Square Feet Cost per square foot:
| $287 |
Monthly Rent Per Square FootMonthly rent divided by the number of square feet. This ratio helps investors compare rental income efficiency across properties, markets, and unit sizes Calculation:Monthly Rent / Square Feet Monthly rent per square foot:
| $1.68 |
Financing Details
Loan AmountThe total sum of money borrowed from a lender to finance a property purchase. Calculation:Purchase Price - Down Payment
Loan amount:
| $695,920 |
|---|---|
Loan to Value Ratio (LTV)Loan amount divided by the market value of the property. Calculation:Loan Amount / Market Value
Loan to value ratio:
| 80.0% |
Loan TypeThe type of loan (e.g., fixed, adjustable).
Loan type:
| Amortizing |
TermThe loan repayment period in years.
Term:
| 30 years |
Interest RateThe percentage a lender charges on the borrowed amount of a loan, determining the cost of borrowing money.
Interest rate:
| 6.810% |
Principal & Interest (PI)The principal is the portion of the loan payment that reduces the loan balance. The interest is the lender's charge for borrowing money. Calculation:(P * r * (1 + r) ** n) / ((1 + r) ** n - 1) Where:
P = Loan amount (principal)
Principal & interest:
| $4,542 |
Property TaxesAnnual taxes levied by local governments on real estate properties. These taxes fund public services like schools, roads, and emergency services.
Property tax:
| $1,005 |
InsuranceThe costs for insurance coverage to protect against financial losses due to risks like fire, natural disasters, theft, liability, or tenant-related damages. Calculation:Assumes 7% of gross rental income, unless insurance rates are specified.
Insurance:
| $357 |
Private Mortgage Insurance (PMI)A fee that borrowers pay when they take out a conventional loan with a loan-to-value (LTV) ratio above 80%.
Private mortgage insurance (PMI):
| $0 |
Monthly PaymentThe fixed amount a borrower pays each month to repay a loan. It typically includes principal and interest (P&I) and may also cover property taxes, insurance, HOA fees, and PMI if escrowed. Monthly payment:
| $5,904 |
Operating Income
| % Rent | Monthly | Yearly | |
|---|---|---|---|
Gross RentThe total rental income received from tenants before deducting any expenses. Includes base rent, late fees, pet fees, parking fees, and other recurring charges.
Gross rent:
| $5,100 | $61,200 | |
Vacancy LossExpected loss of rent due to vacancies.
Vacancy loss:
(6%)
| 6% | -$306 | -$3,672 |
Operating IncomeGross rental income minus vacancy loss. Calculation:Gross rent - Vacancy loss
Operating income:
| $4,794 | $57,528 |
Operating Expenses
| % Rent | Monthly | Yearly | |
|---|---|---|---|
Property TaxesAnnual taxes levied by local governments on real estate properties. These taxes fund public services like schools, roads, and emergency services. | 20% | -$1,005 | -$12,061 |
InsuranceThe costs for insurance coverage to protect against financial losses due to risks like fire, natural disasters, theft, liability, or tenant-related damages. Calculation:Assumes 7% of gross rental income, unless insurance rates are specified. | 7% | -$357 | -$4,284 |
Property ManagementThe costs associated with hiring a property manager to handle the day-to-day operations of a rental property. Includes management fees, leasing fes, eviction fees, etc. Calculation:Assumes 8% of gross rental income. | 8% | -$408 | -$4,896 |
Repairs & MaintenanceOngoing costs for routine upkeep and minor fixes needed to keep a property in good working condition. Calculation:Assumes 5% of gross rental income. Varies by property age and condition. | 5% | -$255 | -$3,060 |
Capital ExpensesLarge, infrequent costs for major improvements or replacements, like a new roof, HVAC system, or appliances. Calculation:Assumes 5% of gross rental income. Varies by property age. | 5% | -$255 | -$3,060 |
HOA FeesRegular dues paid to a Homeowners Association for community maintenance, amenities, and management. Similar fees include: Condo Association Fees, Co-op Maintenance Fees, etc. | 2% | -$104 | -$1,248 |
Operating ExpensesRecurring costs required to maintain and manage a rental property, including property taxes, insurance, maintenance, repairs, utilities (if paid by the owner), property management fees, and other day-to-day expenses. Calculation:Insurance + Property Taxes + Property Management + Repairs & Maintenance + Capital Expenditures + HOA Fees | 47% | -$2,384 | -$28,609 |
Cash Flow
| Monthly | Yearly | |
|---|---|---|
Net Operating Income (NOI)The income generated from a property after deducting all operating expenses but before deducting mortgage payments, taxes, and capital expenditures. Calculation:Gross Operating Income - Operating Expenses
Net operating income:
| $2,410 | $28,920 |
Mortgage PaymentThe fixed amount a borrower pays each month to repay a loan. It typically includes principal and interest (P&I) and may also cover property taxes, insurance, HOA fees, and PMI if escrowed. | -$4,542 | -$54,504 |
Cash FlowNet Operating Income (NOI) minus mortgage payments. Calculation:NOI - Mortgage Payments | $2,132 | $25,584 |