


$6,995,000
Investment Summary
- Monthly Cash Flow
- -$32,223
- Cap Rate
- 0.6%
- Cash-on-Cash Return
- -24.0%
- Debt Coverage Ratio
- 0.10
- Internal Rate of Return (5 years)
- -19.2%
Cash Flow
Net Operating Income (NOI) minus mortgage payments.
Calculation:
NOI - Mortgage Payments
Cap Rate (Market Value)
Capitalization Rate is a rate of return that compares the yearly Net Operating Income (NOI) to the market value.
Calculation:
NOI / Market Value
Cash-on-Cash Return (CoC)
Annual Cash Flow / Cash Invested
Calculation:
Annual cash flow divided by initial cash invested.
Debt Coverage Ratio (DCR)
Net Operating Income (NOI) divided by total debt payments.
Calculation:
NOI / Total Debt Payments
Internal Rate of Return (IRR)
A metric for assessing profitability over time. IRR is the discount rate at which the net present value (NPV) of all future cash flows (positive and negative) from an investment equals zero — including both periodic cash flow (such as rent) and a projected sale at the end of the holding period. It represents the expected annualized return, accounting for income, expenses, and the recovery of capital through a future sale.
Property Description
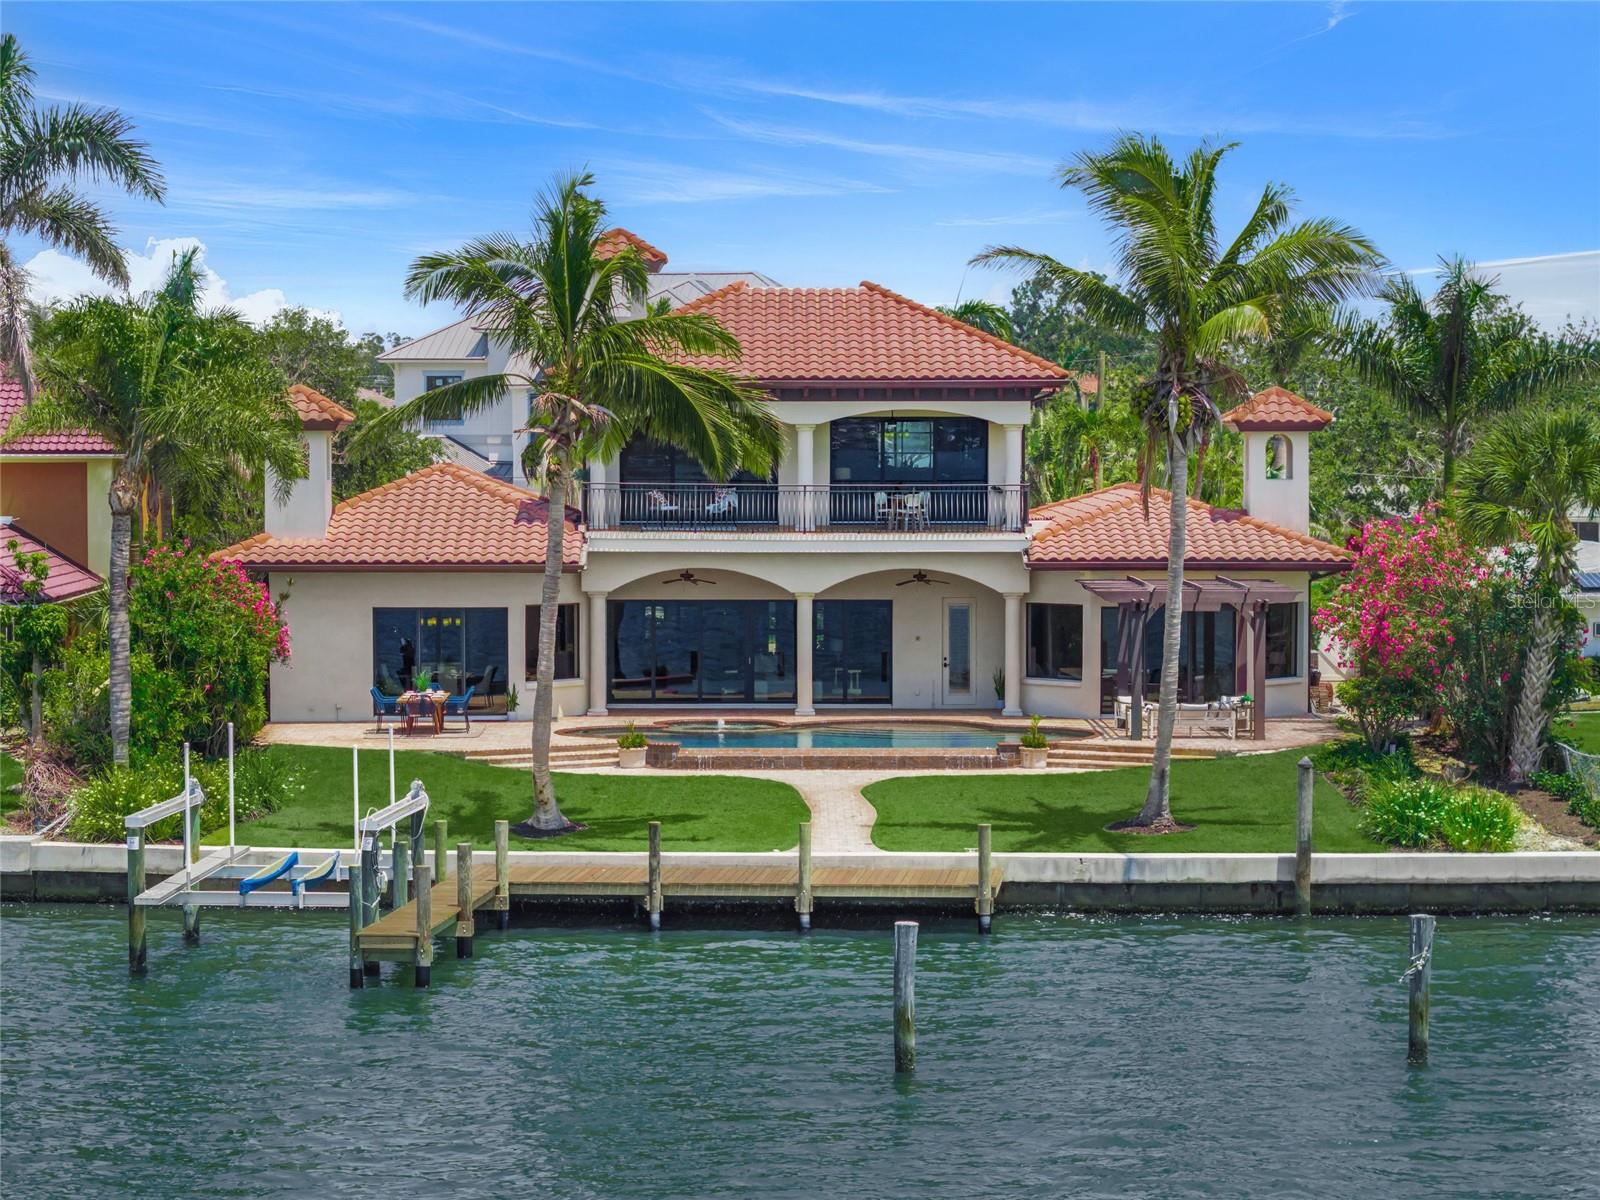
One or more photo(s) has been virtually staged. 3576 San Remo Terrace – A Waterfront Masterpiece in Sarasota Discover the pinnacle of coastal luxury at this exquisite estate, nestled in the highly sought after San Remo Estates. Offering the best views over Roberts Bay, this 6,091-square-foot residence seamlessly blends timeless elegance, modern sophistication, and unparalleled waterfront access. With an unrivaled location & architectural grandeur it is positioned just over the North Bridge to Siesta Key, this estate delivers spectacular bay views without the flood risks or accessibility challenges often associated with barrier island living. Set on the preferred side of San Remo Terrace, the home enjoys mesmerizing sunset panoramas, deep-water access to the Gulf, and a private, tree-lined setting. A grand custom entryway welcomes you into a world of refined luxury, where turquoise water vistas and the gentle movement of passing boats create an immediate sense of tranquility. The circular paver driveway, lush tropical landscaping, and striking architectural design set the tone for an extraordinary living experience. Designed for entertaining and everyday indulgence. The expansive open floor plan is tailored for both grand gatherings and intimate moments. A grand salon, spacious family room, and a fireplace-accented dining space establish an inviting atmosphere for hosting. The chef’s kitchen is a culinary masterpiece, featuring dual islands with exotic stone countertops, a six-burner gas stove with griddle, double ovens, warming drawer, and an oversized refrigerator/freezer—crafted for culinary excellence. A wet bar and 625-bottle climate-controlled wine room provide the ultimate setting for connoisseurs and casual entertainers alike. With 4 bedrooms, 4.5 baths, an oversized office, and a versatile upstairs entertaining space, this home offers unmatched comfort and functionality. The primary suite on the main floor serves as a serene haven, complete with a luxurious en suite bath, while a private guest suite on the second floor ensures exclusivity for visitors. Step outside into a world of unparalleled alfresco luxury. A resort-style infinity-edge pool takes center stage, surrounded by an expansive paver deck with multiple seating and dining areas—perfect for sun-drenched afternoons or moonlit gatherings. Lush landscaping wraps this serene retreat, creating an oasis for relaxation or playful indulgence. For boating enthusiasts, this estate presents unmatched access to Sarasota’s famed waterways. Brand-new dock & 10,000-lb boat lift Kayak & paddleboard access Fortified seawall The Best of Sarasota Living! This home offers effortless proximity to downtown Sarasota, Siesta Key’s award-winning beaches, fine dining, top-tier schools, and world-class healthcare facilities. Don’t miss the rare opportunity to make this timeless, Tuscan, luxurious waterfront estate your own!
Build Your Team
Quickly find investor-friendly professionals who can help you succeed in real estate investing at any stage of the investing journey.


Agents
Match with investor-friendly agents who can help you find, analyze, and close your next deal


Lenders
Get the best funding…find investor-friendly lenders who specialize in your deal strategy


Property Managers
Transition to passive investing. Find a trusted property management partnership that lasts.


Tax Pros & Accountants
Taxes and financial reporting made easy—find experts to create tax savings strategies, file taxes, and more
Location
Property Details
Parking
- Description: Circular Driveway
- Details: Circular Driveway, Attached
- Garage Spaces: 2
- Spaces Total: 0
Bedroom Information
- # of Bedrooms: 4
Bathroom Information
- # of Baths (Full): 4
- # of Baths (Partial): 1
- # of Baths (Total): 5.0
Interior Features
- # of Rooms: 3
- # of Stories: 2
- Fireplace: Yes
Exterior Features
- Exterior Walls Materials: Stucco
- Foundation: Slab
- Roof Type: Hip
- Roof Material: Concrete, Tile
- Pool: Yes
HOA
- Has HOA: Yes
- Association: Dave
- HOA Fee: $160/annually
Land Information
- Land Use: Residential
- Land Use Subtype: Single Family Residential
Lot Information
- Parcel ID: 2039110021
- Lot Size: 15724 sqft
Property Information
- Property Type: Single Family Residence
- Year Built: 2009
Tax Information
- Annual Tax: $23,607
Utilities
- Water & Sewer: Public
- Heating: Central
- Cooling: Central Air
Location
- County: Sarasota
Listing Details
Investment Summary
- Monthly Cash Flow
- -$32,223
- Cap Rate
- 0.6%
- Cash-on-Cash Return
- -24.0%
- Debt Coverage Ratio
- 0.10
- Internal Rate of Return (5 years)
- -19.2%
Cash Flow
Net Operating Income (NOI) minus mortgage payments.
Calculation:
NOI - Mortgage Payments
Cap Rate (Market Value)
Capitalization Rate is a rate of return that compares the yearly Net Operating Income (NOI) to the market value.
Calculation:
NOI / Market Value
Cash-on-Cash Return (CoC)
Annual Cash Flow / Cash Invested
Calculation:
Annual cash flow divided by initial cash invested.
Debt Coverage Ratio (DCR)
Net Operating Income (NOI) divided by total debt payments.
Calculation:
NOI / Total Debt Payments
Internal Rate of Return (IRR)
A metric for assessing profitability over time. IRR is the discount rate at which the net present value (NPV) of all future cash flows (positive and negative) from an investment equals zero — including both periodic cash flow (such as rent) and a projected sale at the end of the holding period. It represents the expected annualized return, accounting for income, expenses, and the recovery of capital through a future sale.
Purchase Details
Purchase PriceThe price paid for the property. Purchase price:
| $6,995,000 |
|---|---|
Amount FinancedThe amount of the purchase financed through a loan. Amount financed:
| -$5,596,000 |
Down paymentThe initial payment made towards the purchase. Down payment:
| $1,399,000 |
Closing CostsFees and expenses associated with purchasing a property, typically ranging from 2% to 5% of the home’s purchase price, paid at the end of a home purchase to cover services like lending, title transfer, and taxes. Closing costs:
| $209,850 |
Rehab CostsCosts incurred to repair or improve the property, including: roof, flooring, exterior siding, kitchen, exterior paint, bathrooms, etc. Rehab costs:
| $0 |
Initial Cash InvestedThe total initial cash invested in the property. Calculation:Down payment + Buying costs + Rehab costs Initial cash invested:
| $1,608,850 |
Square Feet (SQFT)The total square footage of the property. Square feet:
| 6,091 |
Cost Per Square FootCost per square foot of the property. Calculation:Purchase Price / Square Feet Cost per square foot:
| $1,148 |
Monthly Rent Per Square FootMonthly rent divided by the number of square feet. This ratio helps investors compare rental income efficiency across properties, markets, and unit sizes Calculation:Monthly Rent / Square Feet Monthly rent per square foot:
| $1.33 |
Financing Details
Loan AmountThe total sum of money borrowed from a lender to finance a property purchase. Calculation:Purchase Price - Down Payment
Loan amount:
| $5,596,000 |
|---|---|
Loan to Value Ratio (LTV)Loan amount divided by the market value of the property. Calculation:Loan Amount / Market Value
Loan to value ratio:
| 80.0% |
Loan TypeThe type of loan (e.g., fixed, adjustable).
Loan type:
| Amortizing |
TermThe loan repayment period in years.
Term:
| 30 years |
Interest RateThe percentage a lender charges on the borrowed amount of a loan, determining the cost of borrowing money.
Interest rate:
| 6.625% |
Principal & Interest (PI)The principal is the portion of the loan payment that reduces the loan balance. The interest is the lender's charge for borrowing money. Calculation:(P * r * (1 + r) ** n) / ((1 + r) ** n - 1) Where:
P = Loan amount (principal)
Principal & interest:
| $35,832 |
Property TaxesAnnual taxes levied by local governments on real estate properties. These taxes fund public services like schools, roads, and emergency services.
Property tax:
| $1,967 |
InsuranceThe costs for insurance coverage to protect against financial losses due to risks like fire, natural disasters, theft, liability, or tenant-related damages. Calculation:Assumes 7% of gross rental income, unless insurance rates are specified.
Insurance:
| $567 |
Private Mortgage Insurance (PMI)A fee that borrowers pay when they take out a conventional loan with a loan-to-value (LTV) ratio above 80%.
Private mortgage insurance (PMI):
| $0 |
Monthly PaymentThe fixed amount a borrower pays each month to repay a loan. It typically includes principal and interest (P&I) and may also cover property taxes, insurance, HOA fees, and PMI if escrowed. Monthly payment:
| $38,366 |
Operating Income
| % Rent | Monthly | Yearly | |
|---|---|---|---|
Gross RentThe total rental income received from tenants before deducting any expenses. Includes base rent, late fees, pet fees, parking fees, and other recurring charges.
Gross rent:
| $8,100 | $97,200 | |
Vacancy LossExpected loss of rent due to vacancies.
Vacancy loss:
(6%)
| 6% | -$486 | -$5,832 |
Operating IncomeGross rental income minus vacancy loss. Calculation:Gross rent - Vacancy loss
Operating income:
| $7,614 | $91,368 |
Operating Expenses
| % Rent | Monthly | Yearly | |
|---|---|---|---|
Property TaxesAnnual taxes levied by local governments on real estate properties. These taxes fund public services like schools, roads, and emergency services. | 24% | -$1,967 | -$23,607 |
InsuranceThe costs for insurance coverage to protect against financial losses due to risks like fire, natural disasters, theft, liability, or tenant-related damages. Calculation:Assumes 7% of gross rental income, unless insurance rates are specified. | 7% | -$567 | -$6,804 |
Property ManagementThe costs associated with hiring a property manager to handle the day-to-day operations of a rental property. Includes management fees, leasing fes, eviction fees, etc. Calculation:Assumes 8% of gross rental income. | 8% | -$648 | -$7,776 |
Repairs & MaintenanceOngoing costs for routine upkeep and minor fixes needed to keep a property in good working condition. Calculation:Assumes 5% of gross rental income. Varies by property age and condition. | 5% | -$405 | -$4,860 |
Capital ExpensesLarge, infrequent costs for major improvements or replacements, like a new roof, HVAC system, or appliances. Calculation:Assumes 5% of gross rental income. Varies by property age. | 5% | -$405 | -$4,860 |
HOA FeesRegular dues paid to a Homeowners Association for community maintenance, amenities, and management. Similar fees include: Condo Association Fees, Co-op Maintenance Fees, etc. | 0% | -$13 | -$156 |
Operating ExpensesRecurring costs required to maintain and manage a rental property, including property taxes, insurance, maintenance, repairs, utilities (if paid by the owner), property management fees, and other day-to-day expenses. Calculation:Insurance + Property Taxes + Property Management + Repairs & Maintenance + Capital Expenditures + HOA Fees | 49% | -$4,005 | -$48,063 |
Cash Flow
| Monthly | Yearly | |
|---|---|---|
Net Operating Income (NOI)The income generated from a property after deducting all operating expenses but before deducting mortgage payments, taxes, and capital expenditures. Calculation:Gross Operating Income - Operating Expenses
Net operating income:
| $3,609 | $43,308 |
Mortgage PaymentThe fixed amount a borrower pays each month to repay a loan. It typically includes principal and interest (P&I) and may also cover property taxes, insurance, HOA fees, and PMI if escrowed. | -$35,832 | -$429,984 |
Cash FlowNet Operating Income (NOI) minus mortgage payments. Calculation:NOI - Mortgage Payments | $32,223 | $386,676 |