$975,000
Investment Summary
- Monthly Cash Flow
- -$1,630
- Cap Rate
- 4.3%
- Cash-on-Cash Return
- -8.7%
- Debt Coverage Ratio
- 0.68
- Internal Rate of Return (5 years)
- -4.5%
Cash Flow
Net Operating Income (NOI) minus mortgage payments.
Calculation:
NOI - Mortgage Payments
Cap Rate (Market Value)
Capitalization Rate is a rate of return that compares the yearly Net Operating Income (NOI) to the market value.
Calculation:
NOI / Market Value
Cash-on-Cash Return (CoC)
Annual Cash Flow / Cash Invested
Calculation:
Annual cash flow divided by initial cash invested.
Debt Coverage Ratio (DCR)
Net Operating Income (NOI) divided by total debt payments.
Calculation:
NOI / Total Debt Payments
Internal Rate of Return (IRR)
A metric for assessing profitability over time. IRR is the discount rate at which the net present value (NPV) of all future cash flows (positive and negative) from an investment equals zero — including both periodic cash flow (such as rent) and a projected sale at the end of the holding period. It represents the expected annualized return, accounting for income, expenses, and the recovery of capital through a future sale.
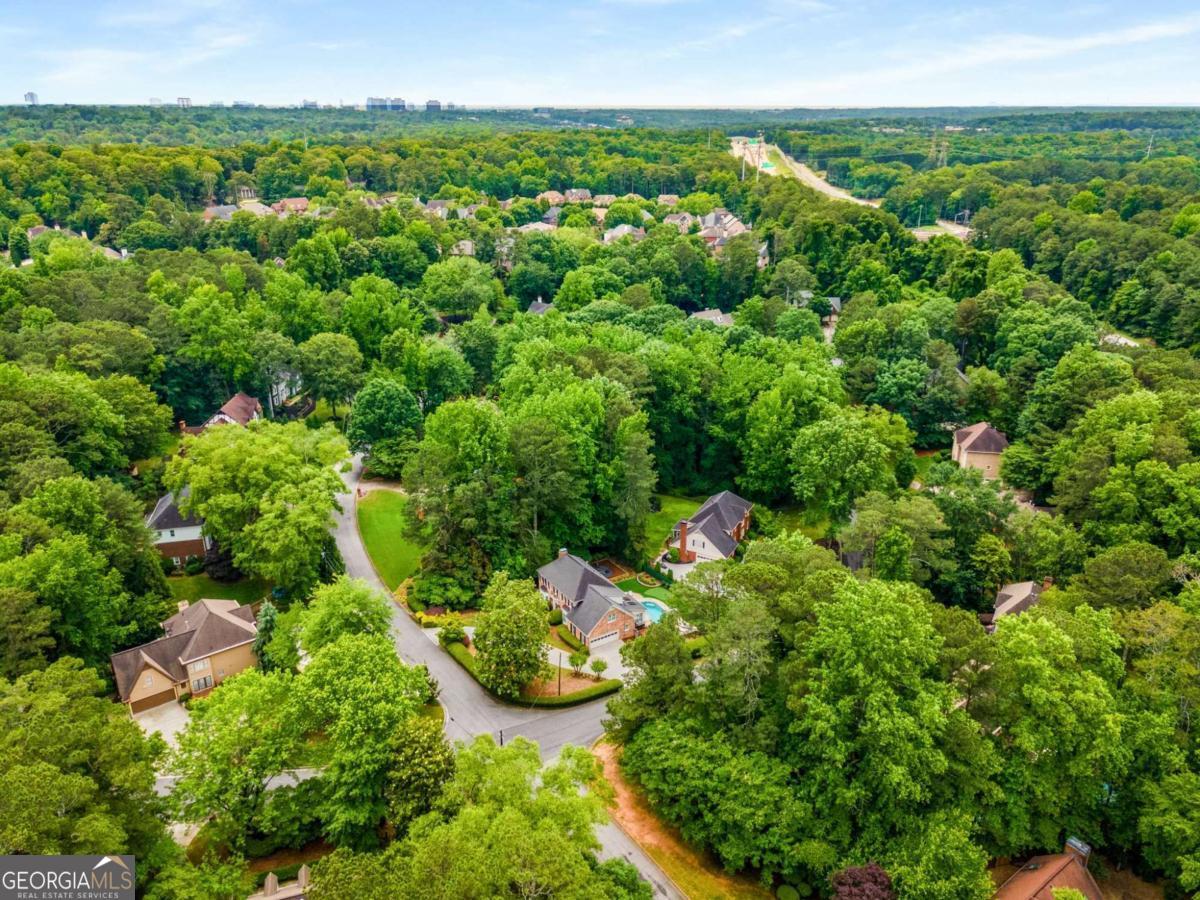
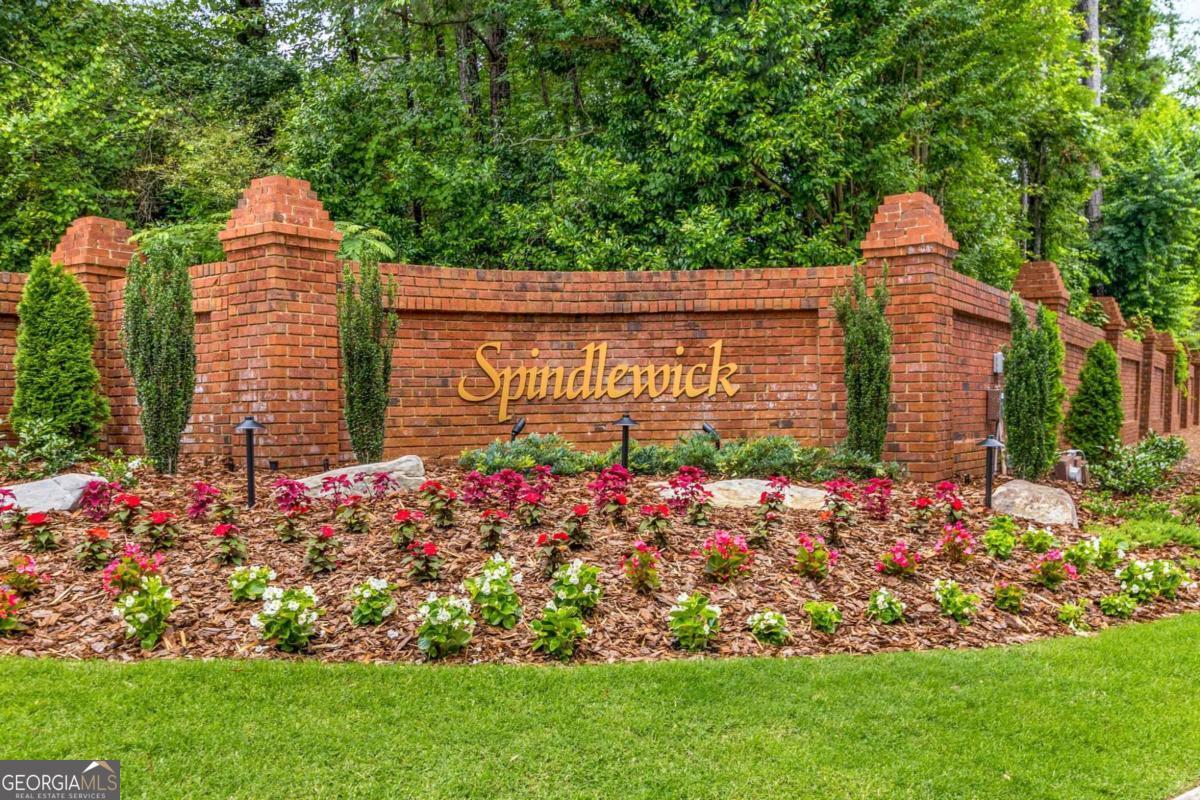
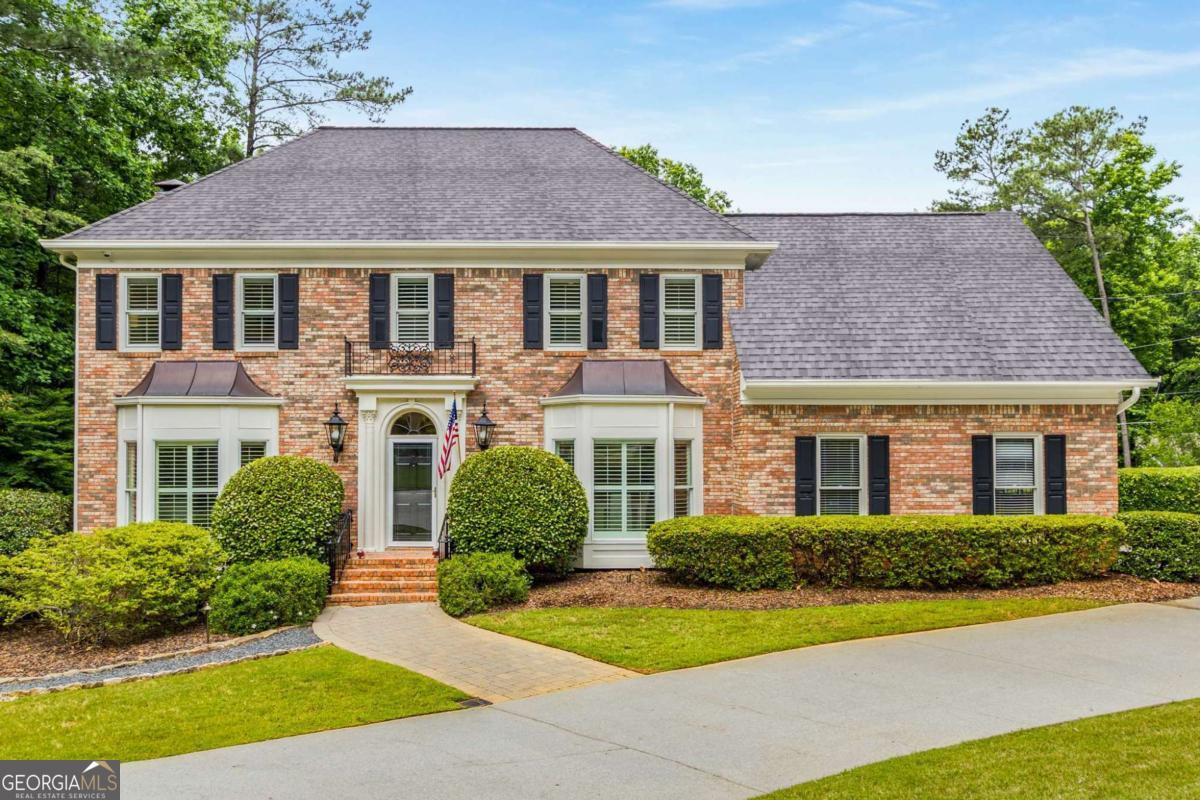
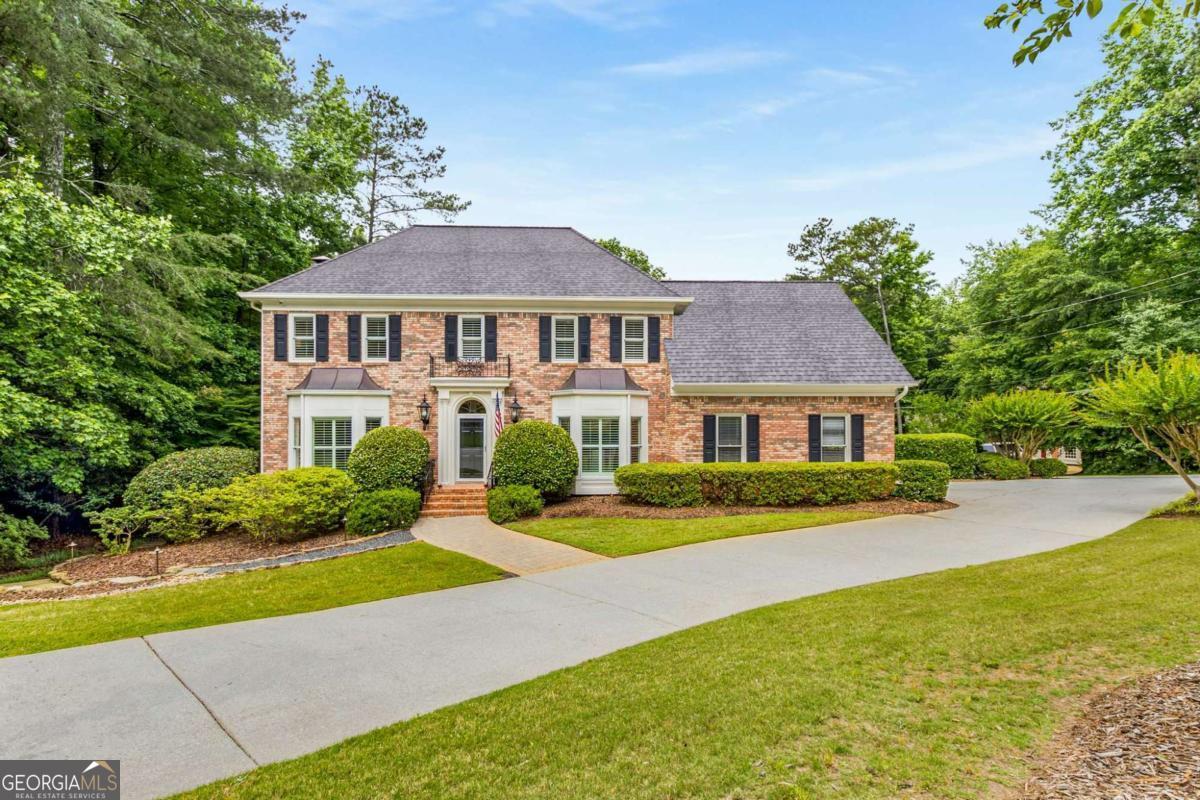
Property Description
Move right into this stunning brick home in the incredibly convenient Sandy Springs neighborhood of Spindlewick. Nestled between two culdesacs, this stately property sits on a large corner lot with beautiful, mature landscaping. You'll love the curb appeal as you enter the circular driveway approaching this property. Once inside, the streaming natural light, gleaming hardwood floors, fresh paint and beautiful trim work throughout greet you. Floor-to-ceiling Pella windows and plantation shutters add a touch of elegance to the home. The extra large fireside family room is perfect for all of your oversized furniture and relaxing at the end of a long day. The beautiful eat-in kitchen features custom 42" wood cabinetry, stainless steel appliances (including double ovens and a gas range), granite countertops, two pantries and a convenient bar area with dual temp beverage fridge. The adjacent sunroom is ideal for enjoying a cup of coffee in the morning or winding down with a glass of wine at night while overlooking your stunning backyard. This level is completed by a formal dining room, laundry room, convenient powder bath, ample storage and a large rear porch with Trex composite decking. Upstairs offers four bedroom retreats - each with fresh paint, new carpet and upgraded bathrooms. The oversized primary suite features a double tray ceiling, large walk-in closet with Elfa custom closet system and a bathroom with relaxing soaking tub, double vanity, walk-in shower and additional custom cabinetry for storage. Three guest bedrooms round out this level, two that share a hall bath plus an expansive junior primary suite. The basement of this home is impressive and perfect for entertaining! It features a large room for entertaining, a wood-burning fireplace, custom wet bar, powder room and two expansive unfinished spaces that are perfect for storage or future use. Walk out onto your covered paver patio and into your backyard oasis. A beautiful gunite pool with relaxing waterfall feature, low-maintenance artificial turf yard, firepit area, custom putting green and outdoor grilling station make this yard the envy of its neighbors! You'll enjoy having family and friends over all summer long. This home is not only what you've been looking for in terms of finishes but it also happens to be perfectly located in the North Dunwoody/Sandy Springs panhandle area. You're less than 2 miles to Dunwoody Village and only 10 minutes to City Springs and downtown Roswell. Convenient to major thoroughfares, Dunwoody Country Club, Davis Academy, Chattahoochee River access areas and so much more!
Build Your Team
Quickly find investor-friendly professionals who can help you succeed in real estate investing at any stage of the investing journey.


Agents
Match with investor-friendly agents who can help you find, analyze, and close your next deal


Lenders
Get the best funding…find investor-friendly lenders who specialize in your deal strategy


Property Managers
Transition to passive investing. Find a trusted property management partnership that lasts.


Tax Pros & Accountants
Taxes and financial reporting made easy—find experts to create tax savings strategies, file taxes, and more
Location
Property Details
Parking
- Description: Attached, Driveway, Garage, Garage Faces Side, Kitchen Level, Level Driveway
- Details: Attached, Garage, Kitchen Level
- Garage Spaces: 2
- Spaces Total: 2
Bedroom Information
- # of Bedrooms: 4
Bathroom Information
- # of Baths (Full): 3
- # of Baths (Partial): 2
- # of Baths (Total): 0.0
Interior Features
- # of Rooms: 8
- # of Stories: 2
- Basement: Yes
- Basement Description: Daylight, Exterior Entry, Finished, Full, Interior Entry
- Fireplace: Yes
Exterior Features
- Exterior Walls Materials: Rock, Stone
- Foundation: Slab
- Roof Material: Composition
HOA
- Has HOA: Yes
- Association: Richard McGowan
- HOA Fee: $350/annually
Land Information
- Land Use: Residential
- Land Use Subtype: Single Family Residential
Lot Information
- Parcel ID: 06038400030505
- Lot Size: 0 sqft
Property Information
- Property Type: Single Family Residence
- Style: Brick 4 Side, Traditional
- Year Built: 1983
Tax Information
- Annual Tax: $5,960
Utilities
- Water & Sewer: Public
- Heating: Wood Stove, Central, Forced Air, Natural Gas, Zoned
- Cooling: Ceiling Fan(s), Central Air, Electric, Zoned
Location
- County: Fulton
Investment Summary
- Monthly Cash Flow
- -$1,630
- Cap Rate
- 4.3%
- Cash-on-Cash Return
- -8.7%
- Debt Coverage Ratio
- 0.68
- Internal Rate of Return (5 years)
- -4.5%
Cash Flow
Net Operating Income (NOI) minus mortgage payments.
Calculation:
NOI - Mortgage Payments
Cap Rate (Market Value)
Capitalization Rate is a rate of return that compares the yearly Net Operating Income (NOI) to the market value.
Calculation:
NOI / Market Value
Cash-on-Cash Return (CoC)
Annual Cash Flow / Cash Invested
Calculation:
Annual cash flow divided by initial cash invested.
Debt Coverage Ratio (DCR)
Net Operating Income (NOI) divided by total debt payments.
Calculation:
NOI / Total Debt Payments
Internal Rate of Return (IRR)
A metric for assessing profitability over time. IRR is the discount rate at which the net present value (NPV) of all future cash flows (positive and negative) from an investment equals zero — including both periodic cash flow (such as rent) and a projected sale at the end of the holding period. It represents the expected annualized return, accounting for income, expenses, and the recovery of capital through a future sale.
Purchase Details
Purchase PriceThe price paid for the property. Purchase price:
| $975,000 |
|---|---|
Amount FinancedThe amount of the purchase financed through a loan. Amount financed:
| -$780,000 |
Down paymentThe initial payment made towards the purchase. Down payment:
| $195,000 |
Closing CostsFees and expenses associated with purchasing a property, typically ranging from 2% to 5% of the home’s purchase price, paid at the end of a home purchase to cover services like lending, title transfer, and taxes. Closing costs:
| $29,250 |
Rehab CostsCosts incurred to repair or improve the property, including: roof, flooring, exterior siding, kitchen, exterior paint, bathrooms, etc. Rehab costs:
| $0 |
Initial Cash InvestedThe total initial cash invested in the property. Calculation:Down payment + Buying costs + Rehab costs Initial cash invested:
| $224,250 |
Square Feet (SQFT)The total square footage of the property. Square feet:
| 4,520 |
Cost Per Square FootCost per square foot of the property. Calculation:Purchase Price / Square Feet Cost per square foot:
| $216 |
Monthly Rent Per Square FootMonthly rent divided by the number of square feet. This ratio helps investors compare rental income efficiency across properties, markets, and unit sizes Calculation:Monthly Rent / Square Feet Monthly rent per square foot:
| $1.28 |
Financing Details
Loan AmountThe total sum of money borrowed from a lender to finance a property purchase. Calculation:Purchase Price - Down Payment
Loan amount:
| $780,000 |
|---|---|
Loan to Value Ratio (LTV)Loan amount divided by the market value of the property. Calculation:Loan Amount / Market Value
Loan to value ratio:
| 80.0% |
Loan TypeThe type of loan (e.g., fixed, adjustable).
Loan type:
| Amortizing |
TermThe loan repayment period in years.
Term:
| 30 years |
Interest RateThe percentage a lender charges on the borrowed amount of a loan, determining the cost of borrowing money.
Interest rate:
| 6.840% |
Principal & Interest (PI)The principal is the portion of the loan payment that reduces the loan balance. The interest is the lender's charge for borrowing money. Calculation:(P * r * (1 + r) ** n) / ((1 + r) ** n - 1) Where:
P = Loan amount (principal)
Principal & interest:
| $5,106 |
Property TaxesAnnual taxes levied by local governments on real estate properties. These taxes fund public services like schools, roads, and emergency services.
Property tax:
| $497 |
InsuranceThe costs for insurance coverage to protect against financial losses due to risks like fire, natural disasters, theft, liability, or tenant-related damages. Calculation:Assumes 7% of gross rental income, unless insurance rates are specified.
Insurance:
| $406 |
Private Mortgage Insurance (PMI)A fee that borrowers pay when they take out a conventional loan with a loan-to-value (LTV) ratio above 80%.
Private mortgage insurance (PMI):
| $0 |
Monthly PaymentThe fixed amount a borrower pays each month to repay a loan. It typically includes principal and interest (P&I) and may also cover property taxes, insurance, HOA fees, and PMI if escrowed. Monthly payment:
| $6,009 |
Operating Income
| % Rent | Monthly | Yearly | |
|---|---|---|---|
Gross RentThe total rental income received from tenants before deducting any expenses. Includes base rent, late fees, pet fees, parking fees, and other recurring charges.
Gross rent:
| $5,800 | $69,600 | |
Vacancy LossExpected loss of rent due to vacancies.
Vacancy loss:
(6%)
| 6% | -$348 | -$4,176 |
Operating IncomeGross rental income minus vacancy loss. Calculation:Gross rent - Vacancy loss
Operating income:
| $5,452 | $65,424 |
Operating Expenses
| % Rent | Monthly | Yearly | |
|---|---|---|---|
Property TaxesAnnual taxes levied by local governments on real estate properties. These taxes fund public services like schools, roads, and emergency services. | 9% | -$497 | -$5,960 |
InsuranceThe costs for insurance coverage to protect against financial losses due to risks like fire, natural disasters, theft, liability, or tenant-related damages. Calculation:Assumes 7% of gross rental income, unless insurance rates are specified. | 7% | -$406 | -$4,872 |
Property ManagementThe costs associated with hiring a property manager to handle the day-to-day operations of a rental property. Includes management fees, leasing fes, eviction fees, etc. Calculation:Assumes 8% of gross rental income. | 8% | -$464 | -$5,568 |
Repairs & MaintenanceOngoing costs for routine upkeep and minor fixes needed to keep a property in good working condition. Calculation:Assumes 5% of gross rental income. Varies by property age and condition. | 5% | -$290 | -$3,480 |
Capital ExpensesLarge, infrequent costs for major improvements or replacements, like a new roof, HVAC system, or appliances. Calculation:Assumes 5% of gross rental income. Varies by property age. | 5% | -$290 | -$3,480 |
HOA FeesRegular dues paid to a Homeowners Association for community maintenance, amenities, and management. Similar fees include: Condo Association Fees, Co-op Maintenance Fees, etc. | 1% | -$29 | -$348 |
Operating ExpensesRecurring costs required to maintain and manage a rental property, including property taxes, insurance, maintenance, repairs, utilities (if paid by the owner), property management fees, and other day-to-day expenses. Calculation:Insurance + Property Taxes + Property Management + Repairs & Maintenance + Capital Expenditures + HOA Fees | 34% | -$1,976 | -$23,708 |
Cash Flow
| Monthly | Yearly | |
|---|---|---|
Net Operating Income (NOI)The income generated from a property after deducting all operating expenses but before deducting mortgage payments, taxes, and capital expenditures. Calculation:Gross Operating Income - Operating Expenses
Net operating income:
| $3,476 | $41,712 |
Mortgage PaymentThe fixed amount a borrower pays each month to repay a loan. It typically includes principal and interest (P&I) and may also cover property taxes, insurance, HOA fees, and PMI if escrowed. | -$5,106 | -$61,272 |
Cash FlowNet Operating Income (NOI) minus mortgage payments. Calculation:NOI - Mortgage Payments | $1,630 | $19,560 |