$1,199,000
Investment Summary
- Monthly Cash Flow
- -$4,223
- Cap Rate
- 1.9%
- Cash-on-Cash Return
- -18.4%
- Debt Coverage Ratio
- 0.31
- Internal Rate of Return (5 years)
- -13.8%
Cash Flow
Net Operating Income (NOI) minus mortgage payments.
Calculation:
NOI - Mortgage Payments
Cap Rate (Market Value)
Capitalization Rate is a rate of return that compares the yearly Net Operating Income (NOI) to the market value.
Calculation:
NOI / Market Value
Cash-on-Cash Return (CoC)
Annual Cash Flow / Cash Invested
Calculation:
Annual cash flow divided by initial cash invested.
Debt Coverage Ratio (DCR)
Net Operating Income (NOI) divided by total debt payments.
Calculation:
NOI / Total Debt Payments
Internal Rate of Return (IRR)
A metric for assessing profitability over time. IRR is the discount rate at which the net present value (NPV) of all future cash flows (positive and negative) from an investment equals zero — including both periodic cash flow (such as rent) and a projected sale at the end of the holding period. It represents the expected annualized return, accounting for income, expenses, and the recovery of capital through a future sale.
Property Description
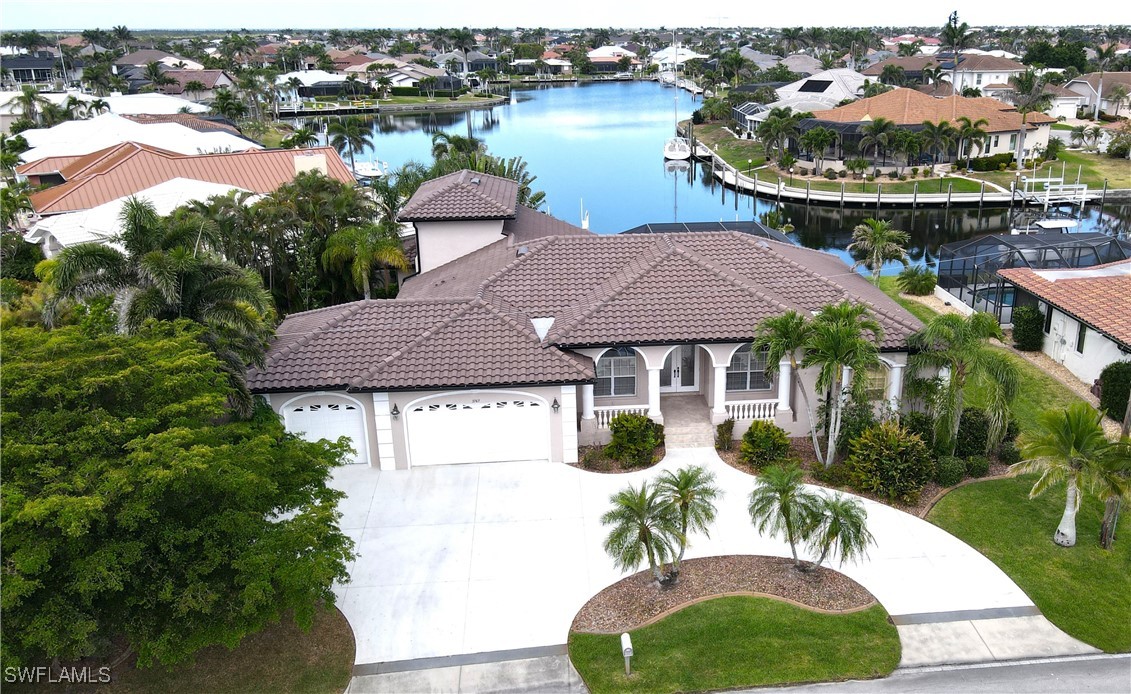
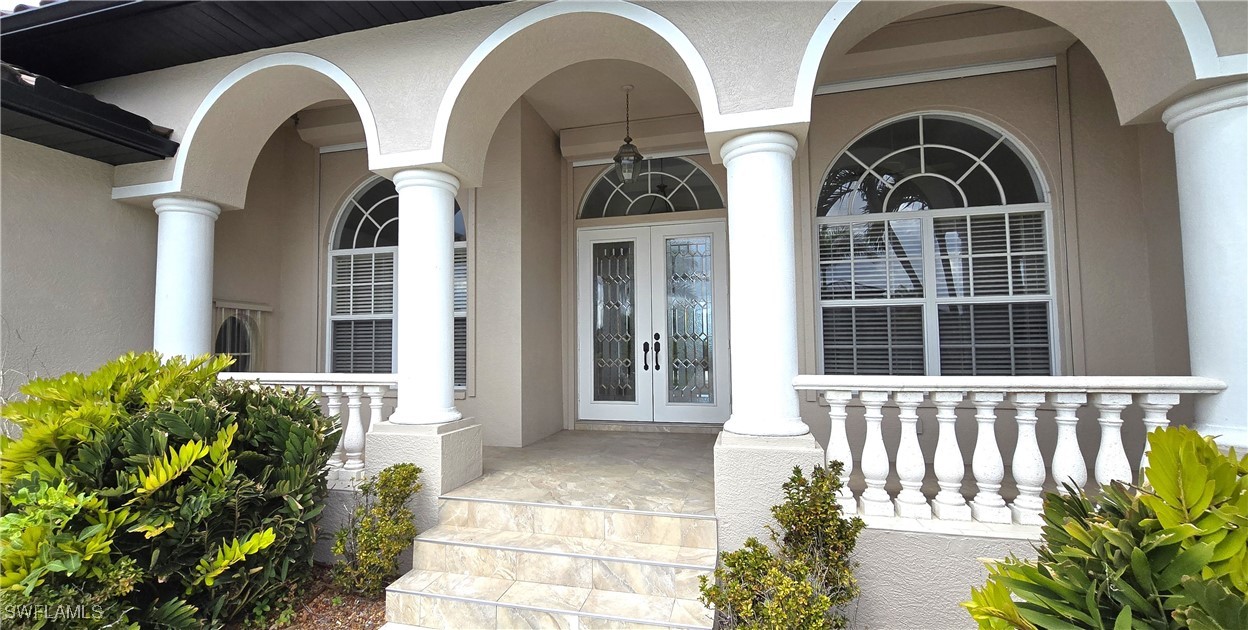
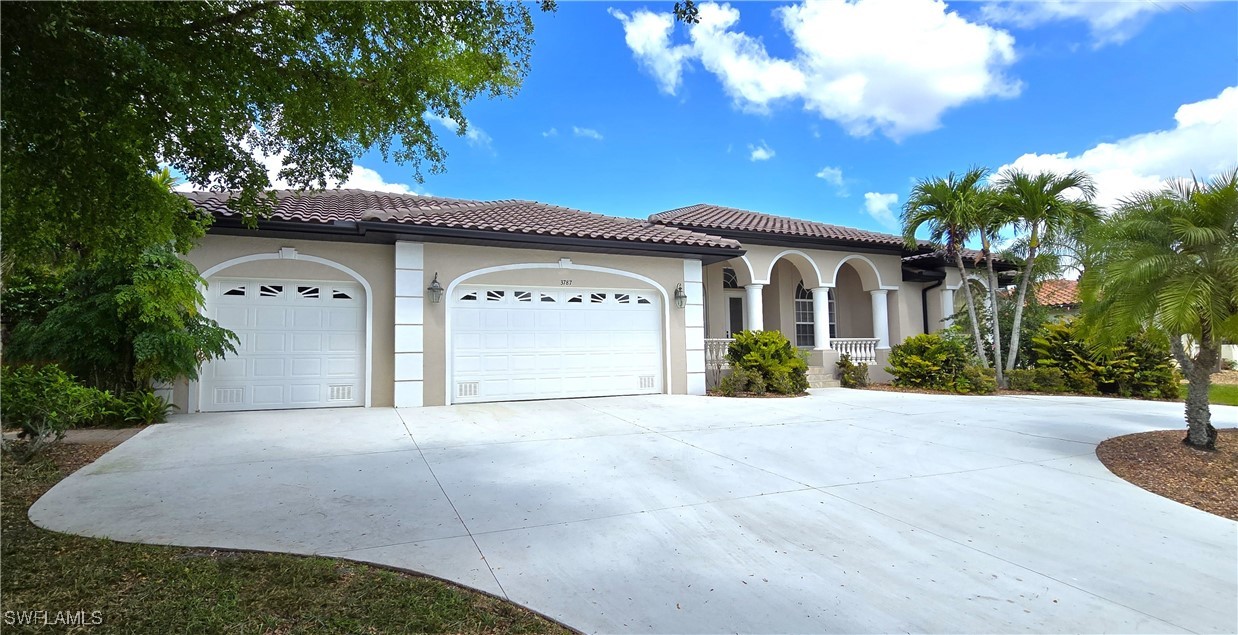
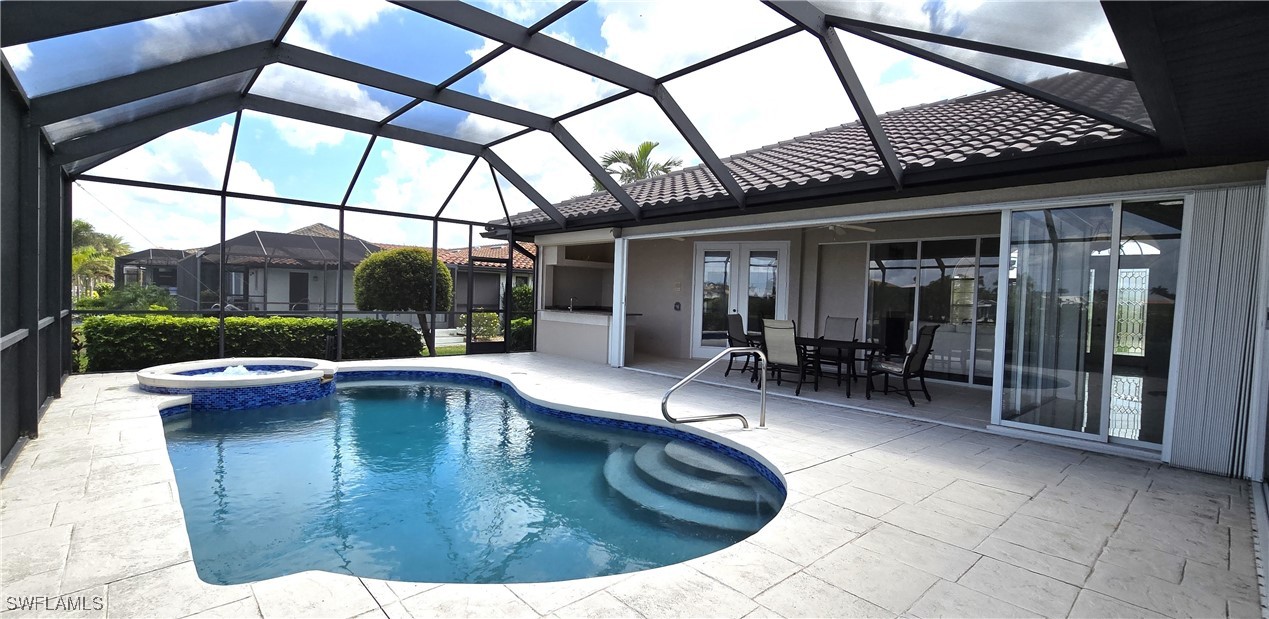
CUSTOM WATERFRONT, FURNISHED, POOL HOME IN PUNTA GORDA ISLES: Situated on an oversized corner lot with lush tropical landscaping, this stunning custom-built home offers a serene waterfront setting with a basin view of intersecting canals and quick boating access to Charlotte Harbor and the Gulf via Buckley’s Pass. This residence is a showstopper from the moment you arrive, you’ll be captivated by the beautifully manicured surroundings, including a private side garden with a paver patio—perfect for evening gatherings. Step through the grand entry to discover soaring ceilings, a bright open split floorplan, and granite tile throughout the main living spaces. The formal living room welcomes you with an elegant in-wall propane fireplace and pocket sliders that open fully to the expansive lanai and pool area. The formal dining room features a full wall of custom cabinetry with a granite-topped buffet and glass shelving. A chef’s dream, the stylish kitchen with pickled wood cabinetry, granite countertops and backsplash, under-cabinet lighting, and high-end appliances including a Bosch induction cooktop, KitchenAid built-in wall oven and microwave, wine fridge, and prep island. The built-in desk, breakfast bar, and cozy breakfast nook with zero-corner sliders make this space versatile. The adjacent family room continues the open feel with a wall of built-in shelving and pocket sliders leading to the pool. Resort style spacious lanai featuring a resurfaced pool and spillover spa, summer kitchen with granite counters, downdraft grill, and refrigerator…ready for any gathering. The owner's suite is a tranquil retreat with a lighted tray ceiling, newer plush carpet, French doors to the lanai, dual walk-in closets, and a spa-inspired ensuite bath featuring separate vanities, a soaking tub, a large tiled walk-in shower, and a private atrium garden view. Need a home office or flex space? The Den (currently used as a bedroom) with double pocket doors and hardwood floors is located near the entry, while two guest bedrooms downstairs share a full bath. Bedroom 2 overlooks the private garden, and Bedroom 3 features hardwood floors, French doors to a private porch, and canal views—currently used as an office. Upstairs, a large ensuite bedroom 4 or bonus room includes a full bath, walk-in closet, and French doors opening to a private balcony overlooking the canal and backyard. Additional features include a well-equipped laundry room with built-in sink and two storage closets, a 3-car garage with workbench, central vac, and newer HVAC, as well as accordion and roll-down storm shutters for full protection. Waterfront upgrades include 30-foot concrete dock with pilings, 10,000 lb boat lift and room to dock two boats—perfect for boaters seeking direct access to Charlotte Harbor and Gulf. You won’t find another like it....see why this Punta Gorda Isles stunner is easy to love and even easier to live in. ***PLEASE CLICK 3D INTERACTIVE VIRTUAL TOUR LINK***
Build Your Team
Quickly find investor-friendly professionals who can help you succeed in real estate investing at any stage of the investing journey.


Agents
Match with investor-friendly agents who can help you find, analyze, and close your next deal


Lenders
Get the best funding…find investor-friendly lenders who specialize in your deal strategy


Property Managers
Transition to passive investing. Find a trusted property management partnership that lasts.


Tax Pros & Accountants
Taxes and financial reporting made easy—find experts to create tax savings strategies, file taxes, and more
Location
Property Details
Parking
- Description: Circular Driveway, Garage Door Opener, Garage Faces Rear, Garage Faces Side, Oversized
- Details: Attached, Circular Driveway, Driveway, Garage, Paved, Garage Door Opener
- Garage Spaces: 3
- Spaces Total: 0
Bedroom Information
- # of Bedrooms: 4
Bathroom Information
- # of Baths (Full): 3
- # of Baths (Total): 3.0
Interior Features
- # of Rooms: 11
- # of Stories: 2
- Fireplace: Yes
Exterior Features
- Exterior Walls Materials: Stucco
- Roof Material: Tile
- Pool: Yes
Land Information
- Land Use: Residential
- Land Use Subtype: Single Family Residential
Lot Information
- Parcel ID: 412224428006
- Lot Size: 0 sqft
Property Information
- Property Type: Single Family Residence
- Style: Contemporary, Florida, Two Story
- Year Built: 2002
Tax Information
- Annual Tax: $15,054
Utilities
- Water & Sewer: Public
- Heating: Central, Electric
- Cooling: Central Air, Ceiling Fan(s), Electric
Location
- County: Charlotte
Listing Details
Investment Summary
- Monthly Cash Flow
- -$4,223
- Cap Rate
- 1.9%
- Cash-on-Cash Return
- -18.4%
- Debt Coverage Ratio
- 0.31
- Internal Rate of Return (5 years)
- -13.8%
Cash Flow
Net Operating Income (NOI) minus mortgage payments.
Calculation:
NOI - Mortgage Payments
Cap Rate (Market Value)
Capitalization Rate is a rate of return that compares the yearly Net Operating Income (NOI) to the market value.
Calculation:
NOI / Market Value
Cash-on-Cash Return (CoC)
Annual Cash Flow / Cash Invested
Calculation:
Annual cash flow divided by initial cash invested.
Debt Coverage Ratio (DCR)
Net Operating Income (NOI) divided by total debt payments.
Calculation:
NOI / Total Debt Payments
Internal Rate of Return (IRR)
A metric for assessing profitability over time. IRR is the discount rate at which the net present value (NPV) of all future cash flows (positive and negative) from an investment equals zero — including both periodic cash flow (such as rent) and a projected sale at the end of the holding period. It represents the expected annualized return, accounting for income, expenses, and the recovery of capital through a future sale.
Purchase Details
Purchase PriceThe price paid for the property. Purchase price:
| $1,199,000 |
|---|---|
Amount FinancedThe amount of the purchase financed through a loan. Amount financed:
| -$959,200 |
Down paymentThe initial payment made towards the purchase. Down payment:
| $239,800 |
Closing CostsFees and expenses associated with purchasing a property, typically ranging from 2% to 5% of the home’s purchase price, paid at the end of a home purchase to cover services like lending, title transfer, and taxes. Closing costs:
| $35,970 |
Rehab CostsCosts incurred to repair or improve the property, including: roof, flooring, exterior siding, kitchen, exterior paint, bathrooms, etc. Rehab costs:
| $0 |
Initial Cash InvestedThe total initial cash invested in the property. Calculation:Down payment + Buying costs + Rehab costs Initial cash invested:
| $275,770 |
Square Feet (SQFT)The total square footage of the property. Square feet:
| 3,249 |
Cost Per Square FootCost per square foot of the property. Calculation:Purchase Price / Square Feet Cost per square foot:
| $369 |
Monthly Rent Per Square FootMonthly rent divided by the number of square feet. This ratio helps investors compare rental income efficiency across properties, markets, and unit sizes Calculation:Monthly Rent / Square Feet Monthly rent per square foot:
| $1.42 |
Financing Details
Loan AmountThe total sum of money borrowed from a lender to finance a property purchase. Calculation:Purchase Price - Down Payment
Loan amount:
| $959,200 |
|---|---|
Loan to Value Ratio (LTV)Loan amount divided by the market value of the property. Calculation:Loan Amount / Market Value
Loan to value ratio:
| 80.0% |
Loan TypeThe type of loan (e.g., fixed, adjustable).
Loan type:
| Amortizing |
TermThe loan repayment period in years.
Term:
| 30 years |
Interest RateThe percentage a lender charges on the borrowed amount of a loan, determining the cost of borrowing money.
Interest rate:
| 6.625% |
Principal & Interest (PI)The principal is the portion of the loan payment that reduces the loan balance. The interest is the lender's charge for borrowing money. Calculation:(P * r * (1 + r) ** n) / ((1 + r) ** n - 1) Where:
P = Loan amount (principal)
Principal & interest:
| $6,142 |
Property TaxesAnnual taxes levied by local governments on real estate properties. These taxes fund public services like schools, roads, and emergency services.
Property tax:
| $1,255 |
InsuranceThe costs for insurance coverage to protect against financial losses due to risks like fire, natural disasters, theft, liability, or tenant-related damages. Calculation:Assumes 7% of gross rental income, unless insurance rates are specified.
Insurance:
| $322 |
Private Mortgage Insurance (PMI)A fee that borrowers pay when they take out a conventional loan with a loan-to-value (LTV) ratio above 80%.
Private mortgage insurance (PMI):
| $0 |
Monthly PaymentThe fixed amount a borrower pays each month to repay a loan. It typically includes principal and interest (P&I) and may also cover property taxes, insurance, HOA fees, and PMI if escrowed. Monthly payment:
| $7,719 |
Operating Income
| % Rent | Monthly | Yearly | |
|---|---|---|---|
Gross RentThe total rental income received from tenants before deducting any expenses. Includes base rent, late fees, pet fees, parking fees, and other recurring charges.
Gross rent:
| $4,600 | $55,200 | |
Vacancy LossExpected loss of rent due to vacancies.
Vacancy loss:
(6%)
| 6% | -$276 | -$3,312 |
Operating IncomeGross rental income minus vacancy loss. Calculation:Gross rent - Vacancy loss
Operating income:
| $4,324 | $51,888 |
Operating Expenses
| % Rent | Monthly | Yearly | |
|---|---|---|---|
Property TaxesAnnual taxes levied by local governments on real estate properties. These taxes fund public services like schools, roads, and emergency services. | 27% | -$1,255 | -$15,055 |
InsuranceThe costs for insurance coverage to protect against financial losses due to risks like fire, natural disasters, theft, liability, or tenant-related damages. Calculation:Assumes 7% of gross rental income, unless insurance rates are specified. | 7% | -$322 | -$3,864 |
Property ManagementThe costs associated with hiring a property manager to handle the day-to-day operations of a rental property. Includes management fees, leasing fes, eviction fees, etc. Calculation:Assumes 8% of gross rental income. | 8% | -$368 | -$4,416 |
Repairs & MaintenanceOngoing costs for routine upkeep and minor fixes needed to keep a property in good working condition. Calculation:Assumes 5% of gross rental income. Varies by property age and condition. | 5% | -$230 | -$2,760 |
Capital ExpensesLarge, infrequent costs for major improvements or replacements, like a new roof, HVAC system, or appliances. Calculation:Assumes 5% of gross rental income. Varies by property age. | 5% | -$230 | -$2,760 |
HOA FeesRegular dues paid to a Homeowners Association for community maintenance, amenities, and management. Similar fees include: Condo Association Fees, Co-op Maintenance Fees, etc. | n/a | n/a | n/a |
Operating ExpensesRecurring costs required to maintain and manage a rental property, including property taxes, insurance, maintenance, repairs, utilities (if paid by the owner), property management fees, and other day-to-day expenses. Calculation:Insurance + Property Taxes + Property Management + Repairs & Maintenance + Capital Expenditures + HOA Fees | 52% | -$2,405 | -$28,855 |
Cash Flow
| Monthly | Yearly | |
|---|---|---|
Net Operating Income (NOI)The income generated from a property after deducting all operating expenses but before deducting mortgage payments, taxes, and capital expenditures. Calculation:Gross Operating Income - Operating Expenses
Net operating income:
| $1,919 | $23,028 |
Mortgage PaymentThe fixed amount a borrower pays each month to repay a loan. It typically includes principal and interest (P&I) and may also cover property taxes, insurance, HOA fees, and PMI if escrowed. | -$6,142 | -$73,704 |
Cash FlowNet Operating Income (NOI) minus mortgage payments. Calculation:NOI - Mortgage Payments | $4,223 | $50,676 |