$899,000
Investment Summary
- Monthly Cash Flow
- -$2,790
- Cap Rate
- 2.4%
- Cash-on-Cash Return
- -16.2%
- Debt Coverage Ratio
- 0.39
- Internal Rate of Return (5 years)
- -11.7%
Cash Flow
Net Operating Income (NOI) minus mortgage payments.
Calculation:
NOI - Mortgage Payments
Cap Rate (Market Value)
Capitalization Rate is a rate of return that compares the yearly Net Operating Income (NOI) to the market value.
Calculation:
NOI / Market Value
Cash-on-Cash Return (CoC)
Annual Cash Flow / Cash Invested
Calculation:
Annual cash flow divided by initial cash invested.
Debt Coverage Ratio (DCR)
Net Operating Income (NOI) divided by total debt payments.
Calculation:
NOI / Total Debt Payments
Internal Rate of Return (IRR)
A metric for assessing profitability over time. IRR is the discount rate at which the net present value (NPV) of all future cash flows (positive and negative) from an investment equals zero — including both periodic cash flow (such as rent) and a projected sale at the end of the holding period. It represents the expected annualized return, accounting for income, expenses, and the recovery of capital through a future sale.
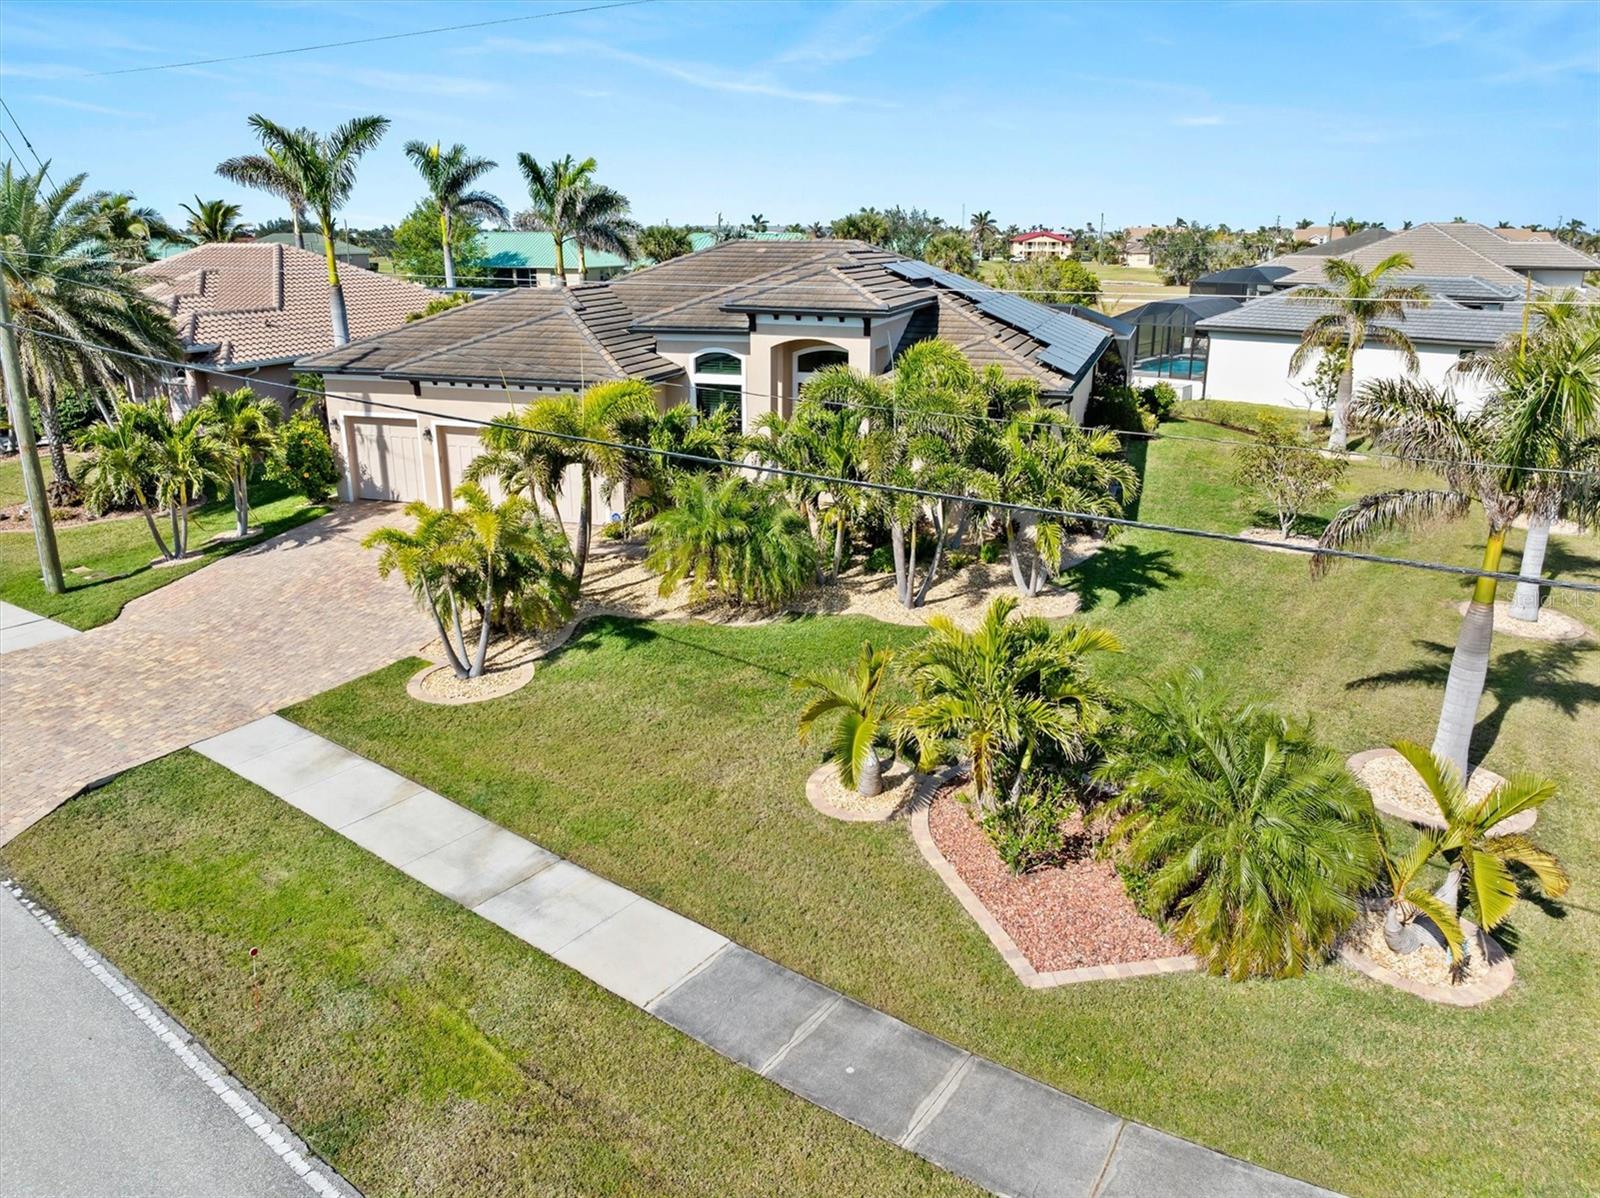
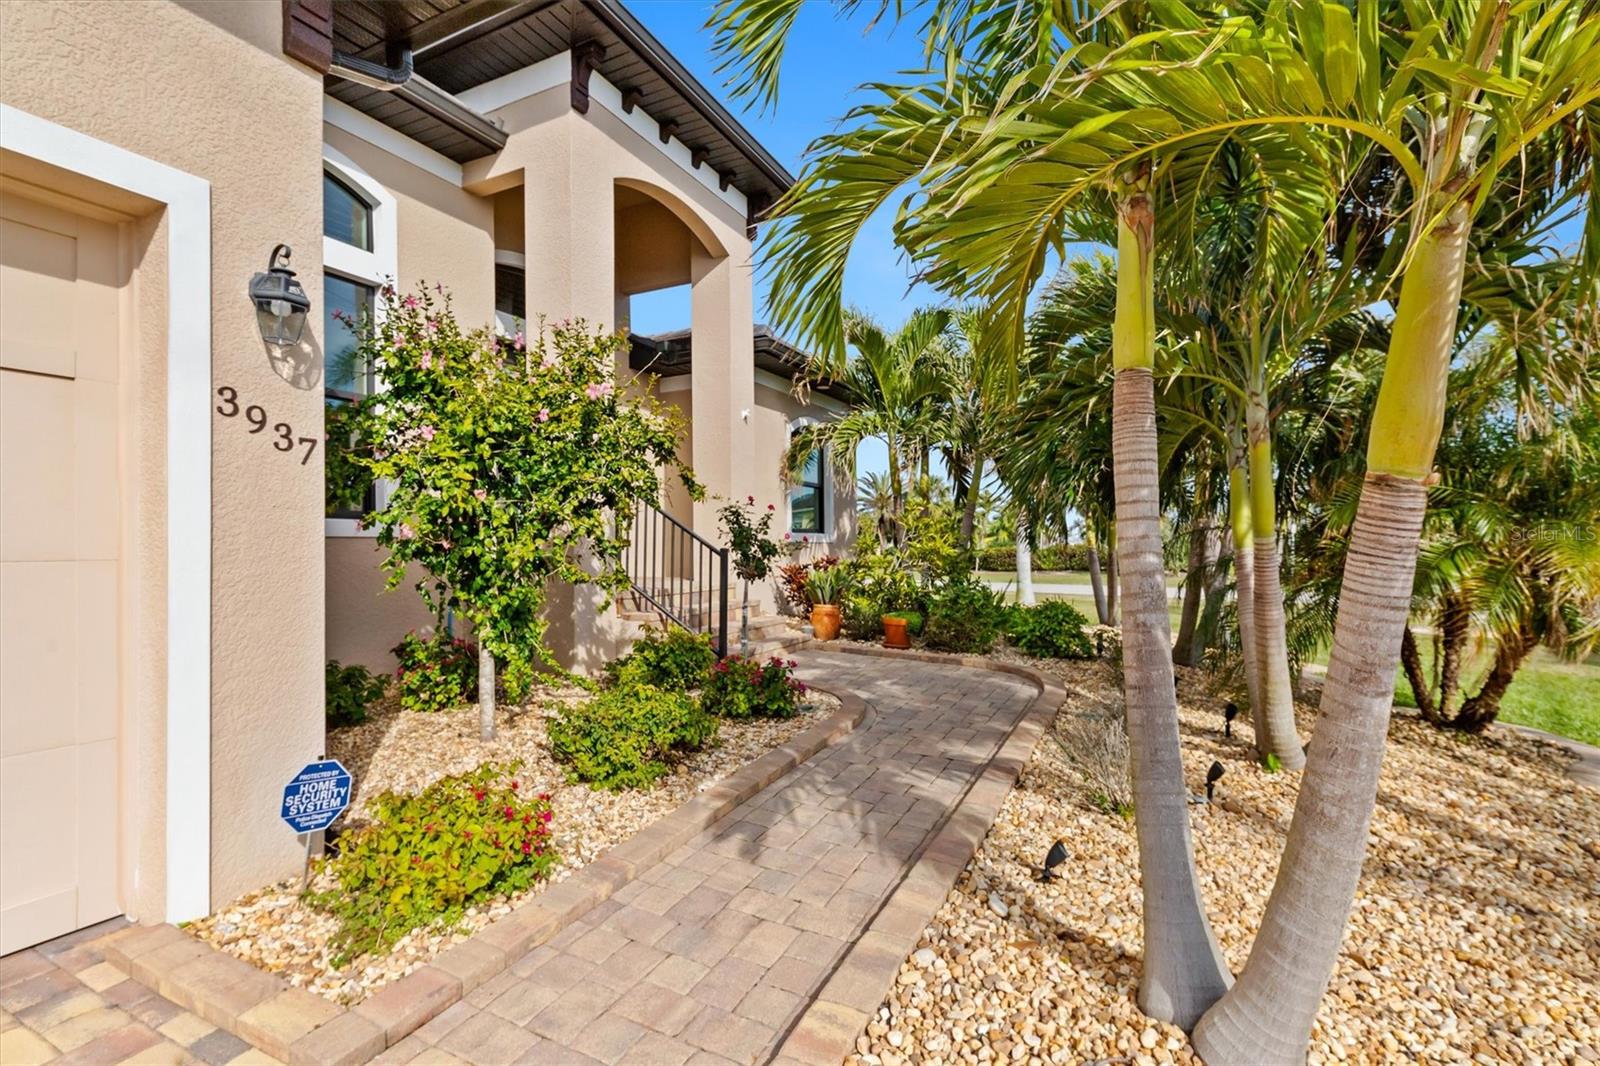
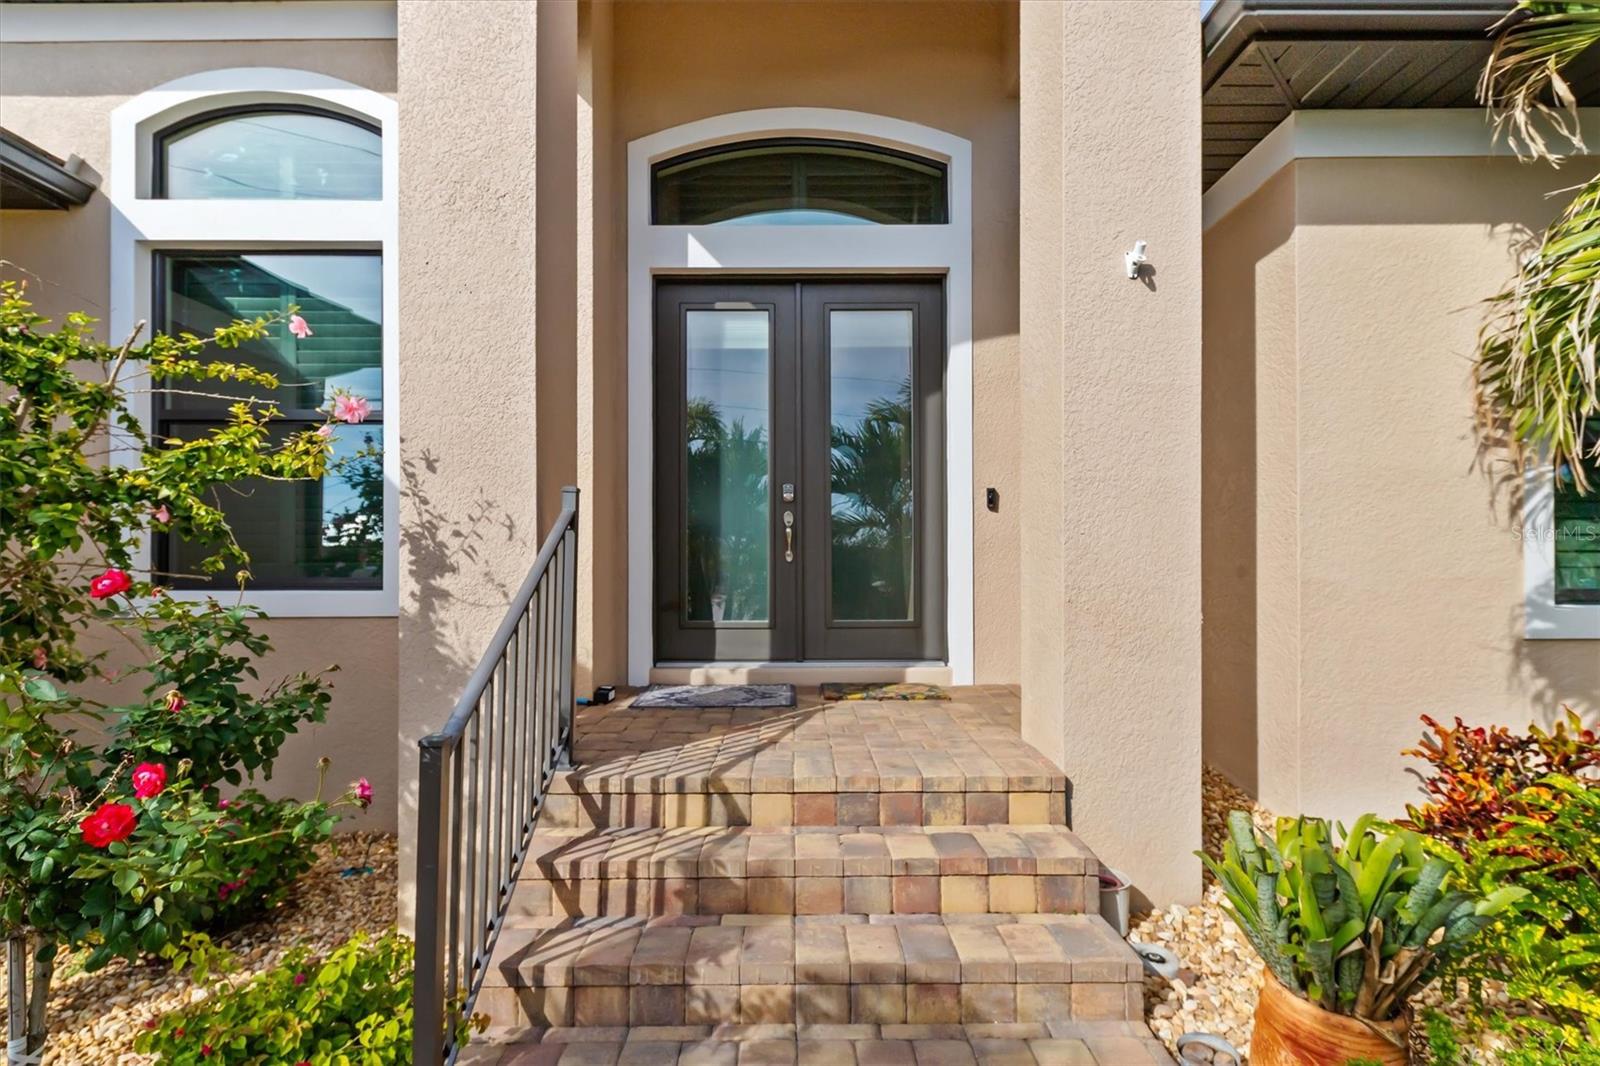
Property Description
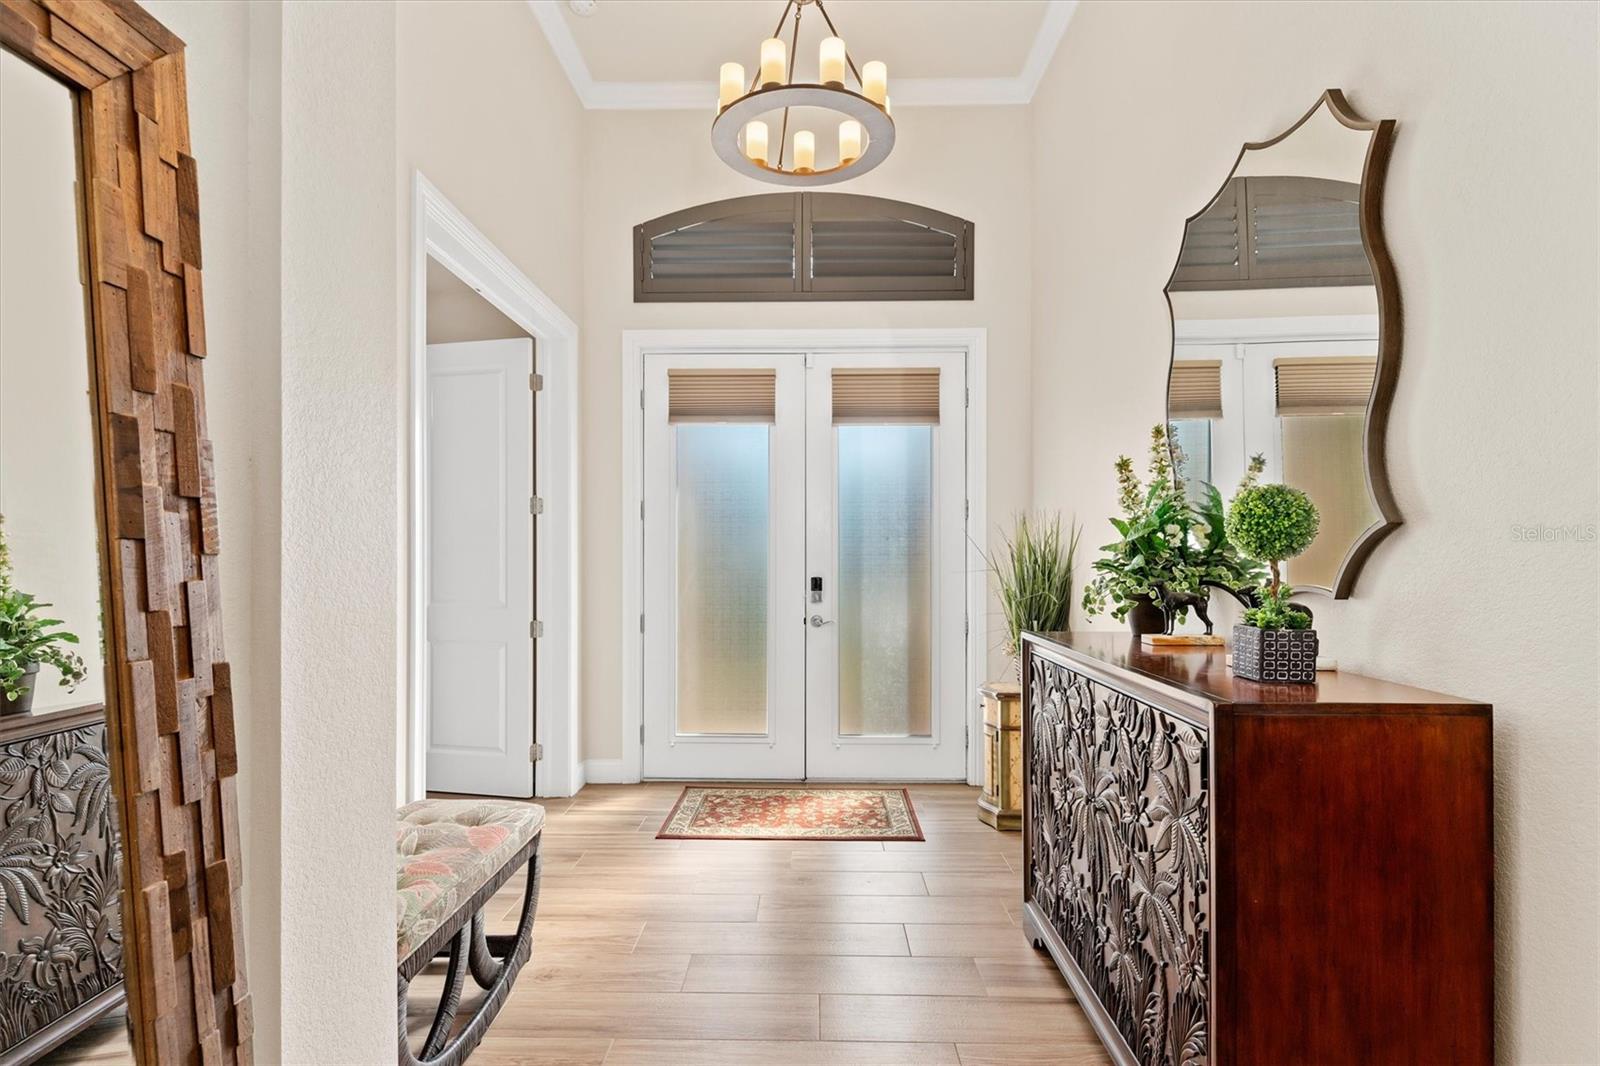
Discover the perfect blend of luxury, comfort, and Florida living in this custom-built 3-bedroom, 3-bathroom, 3-car garage pool home with an office, ideally situated in the sought-after Punta Gorda Isles community. Overlooking the 14th hole of St. Andrew’s Golf Course, this home sits on an oversized corner lot, offering breathtaking views and a peaceful ambiance. The home entrance is located off Suzi St., though it carries a Bal Harbor Blvd. address. A brick-paved, expanded 30-foot driveway leads to a 3-car garage, designed to city maximum limits with a 24-foot width through the covert and right-of-way. Lush landscaping, highlighted by numerous trees and bushes beyond the builder’s original city requirements, is beautifully enhanced with paver-surrounded garden beds finished with 1-1/2” brown and red stone. Landscape lighting in the front yard adds to the home's striking curb appeal. Inside, the thoughtfully designed layout features an expansive great room with double tray ceilings, wood-grain tile flooring, and a wall of sliders that open to the lanai, creating an effortless connection between indoor and outdoor spaces. The gourmet kitchen is a chef’s dream, complete with granite countertops, solid wood cabinetry with crown molding, a center island with prep sink and storage, high-end stainless steel appliances, and a cozy breakfast nook offering stunning golf course and backyard views through a panoramic window. A formal dining room provides the perfect space for entertaining, while the dedicated office/den offers a private retreat. The primary suite is a peaceful escape, featuring tray ceilings with crown molding, custom walk-in closets, plush carpeting, and private access to the pool area. The en-suite bath is elegantly designed with dual granite-topped vanities and a spacious Roman-style walk-in shower. Guests will appreciate two well-appointed bedrooms and two additional bathrooms, one with direct pool access. Step outside to an incredible outdoor living space featuring a 60-foot heated saltwater lap pool with custom tile and marked measurement lines for serious swimmers. A large Hayward pool heat pump ensures year-round comfort. The lanai is finished with a stunning wood ceiling and includes a convenient outdoor sink. An additional water faucet in the backyard adds ease for gardening and maintenance. The 3-car garage is designed for function and comfort, featuring an epoxy-coated floor, insulated ceiling, and a dedicated split A/C unit for climate control. A whole-house solar system helps maintain a lower energy bill. For added convenience, a 12,500-watt portable generator is connected via an outdoor outlet to the main electrical panel (available for purchase outside of sale). Located just minutes from Fishermen’s Village, historic downtown Punta Gorda, Charlotte Harbor, and the new Sunseeker Resort, this home is surrounded by top-rated restaurants, boutique shopping, and entertainment. For outdoor enthusiasts, enjoy world-class boating, fishing, sailing, and pristine Gulf beaches, all just a short drive away. Golfers will love the proximity to championship courses, making this home an ideal retreat for those seeking the ultimate Florida lifestyle.
Build Your Team
Quickly find investor-friendly professionals who can help you succeed in real estate investing at any stage of the investing journey.


Agents
Match with investor-friendly agents who can help you find, analyze, and close your next deal


Lenders
Get the best funding…find investor-friendly lenders who specialize in your deal strategy


Property Managers
Transition to passive investing. Find a trusted property management partnership that lasts.


Tax Pros & Accountants
Taxes and financial reporting made easy—find experts to create tax savings strategies, file taxes, and more
Location
Property Details
Parking
- Description: Driveway
- Details: Driveway, Attached
- Garage Spaces: 3
- Spaces Total: 0
Bedroom Information
- # of Bedrooms: 3
Bathroom Information
- # of Baths (Full): 3
- # of Baths (Total): 3.0
Interior Features
- # of Rooms: 8
- # of Stories: 1
Exterior Features
- Exterior Walls Materials: Stucco
- Foundation: Slab
- Roof Material: Tile
- Pool: Yes
Land Information
- Land Use: Residential
- Land Use Subtype: Single Family Residential
Lot Information
- Parcel ID: 412224326003
- Lot Size: 16125 sqft
Property Information
- Property Type: Single Family Residence
- Style: Florida, Ranch
- Year Built: 2019
Tax Information
- Annual Tax: $7,201
Utilities
- Water & Sewer: Public
- Heating: Central, Electric
- Cooling: Central Air
Location
- County: Charlotte
Listing Details
Investment Summary
- Monthly Cash Flow
- -$2,790
- Cap Rate
- 2.4%
- Cash-on-Cash Return
- -16.2%
- Debt Coverage Ratio
- 0.39
- Internal Rate of Return (5 years)
- -11.7%
Cash Flow
Net Operating Income (NOI) minus mortgage payments.
Calculation:
NOI - Mortgage Payments
Cap Rate (Market Value)
Capitalization Rate is a rate of return that compares the yearly Net Operating Income (NOI) to the market value.
Calculation:
NOI / Market Value
Cash-on-Cash Return (CoC)
Annual Cash Flow / Cash Invested
Calculation:
Annual cash flow divided by initial cash invested.
Debt Coverage Ratio (DCR)
Net Operating Income (NOI) divided by total debt payments.
Calculation:
NOI / Total Debt Payments
Internal Rate of Return (IRR)
A metric for assessing profitability over time. IRR is the discount rate at which the net present value (NPV) of all future cash flows (positive and negative) from an investment equals zero — including both periodic cash flow (such as rent) and a projected sale at the end of the holding period. It represents the expected annualized return, accounting for income, expenses, and the recovery of capital through a future sale.
Purchase Details
Purchase PriceThe price paid for the property. Purchase price:
| $899,000 |
|---|---|
Amount FinancedThe amount of the purchase financed through a loan. Amount financed:
| -$719,200 |
Down paymentThe initial payment made towards the purchase. Down payment:
| $179,800 |
Closing CostsFees and expenses associated with purchasing a property, typically ranging from 2% to 5% of the home’s purchase price, paid at the end of a home purchase to cover services like lending, title transfer, and taxes. Closing costs:
| $26,970 |
Rehab CostsCosts incurred to repair or improve the property, including: roof, flooring, exterior siding, kitchen, exterior paint, bathrooms, etc. Rehab costs:
| $0 |
Initial Cash InvestedThe total initial cash invested in the property. Calculation:Down payment + Buying costs + Rehab costs Initial cash invested:
| $206,770 |
Square Feet (SQFT)The total square footage of the property. Square feet:
| 2,302 |
Cost Per Square FootCost per square foot of the property. Calculation:Purchase Price / Square Feet Cost per square foot:
| $391 |
Monthly Rent Per Square FootMonthly rent divided by the number of square feet. This ratio helps investors compare rental income efficiency across properties, markets, and unit sizes Calculation:Monthly Rent / Square Feet Monthly rent per square foot:
| $1.52 |
Financing Details
Loan AmountThe total sum of money borrowed from a lender to finance a property purchase. Calculation:Purchase Price - Down Payment
Loan amount:
| $719,200 |
|---|---|
Loan to Value Ratio (LTV)Loan amount divided by the market value of the property. Calculation:Loan Amount / Market Value
Loan to value ratio:
| 80.0% |
Loan TypeThe type of loan (e.g., fixed, adjustable).
Loan type:
| Amortizing |
TermThe loan repayment period in years.
Term:
| 30 years |
Interest RateThe percentage a lender charges on the borrowed amount of a loan, determining the cost of borrowing money.
Interest rate:
| 6.625% |
Principal & Interest (PI)The principal is the portion of the loan payment that reduces the loan balance. The interest is the lender's charge for borrowing money. Calculation:(P * r * (1 + r) ** n) / ((1 + r) ** n - 1) Where:
P = Loan amount (principal)
Principal & interest:
| $4,605 |
Property TaxesAnnual taxes levied by local governments on real estate properties. These taxes fund public services like schools, roads, and emergency services.
Property tax:
| $600 |
InsuranceThe costs for insurance coverage to protect against financial losses due to risks like fire, natural disasters, theft, liability, or tenant-related damages. Calculation:Assumes 7% of gross rental income, unless insurance rates are specified.
Insurance:
| $245 |
Private Mortgage Insurance (PMI)A fee that borrowers pay when they take out a conventional loan with a loan-to-value (LTV) ratio above 80%.
Private mortgage insurance (PMI):
| $0 |
Monthly PaymentThe fixed amount a borrower pays each month to repay a loan. It typically includes principal and interest (P&I) and may also cover property taxes, insurance, HOA fees, and PMI if escrowed. Monthly payment:
| $5,450 |
Operating Income
| % Rent | Monthly | Yearly | |
|---|---|---|---|
Gross RentThe total rental income received from tenants before deducting any expenses. Includes base rent, late fees, pet fees, parking fees, and other recurring charges.
Gross rent:
| $3,500 | $42,000 | |
Vacancy LossExpected loss of rent due to vacancies.
Vacancy loss:
(6%)
| 6% | -$210 | -$2,520 |
Operating IncomeGross rental income minus vacancy loss. Calculation:Gross rent - Vacancy loss
Operating income:
| $3,290 | $39,480 |
Operating Expenses
| % Rent | Monthly | Yearly | |
|---|---|---|---|
Property TaxesAnnual taxes levied by local governments on real estate properties. These taxes fund public services like schools, roads, and emergency services. | 17% | -$600 | -$7,202 |
InsuranceThe costs for insurance coverage to protect against financial losses due to risks like fire, natural disasters, theft, liability, or tenant-related damages. Calculation:Assumes 7% of gross rental income, unless insurance rates are specified. | 7% | -$245 | -$2,940 |
Property ManagementThe costs associated with hiring a property manager to handle the day-to-day operations of a rental property. Includes management fees, leasing fes, eviction fees, etc. Calculation:Assumes 8% of gross rental income. | 8% | -$280 | -$3,360 |
Repairs & MaintenanceOngoing costs for routine upkeep and minor fixes needed to keep a property in good working condition. Calculation:Assumes 5% of gross rental income. Varies by property age and condition. | 5% | -$175 | -$2,100 |
Capital ExpensesLarge, infrequent costs for major improvements or replacements, like a new roof, HVAC system, or appliances. Calculation:Assumes 5% of gross rental income. Varies by property age. | 5% | -$175 | -$2,100 |
HOA FeesRegular dues paid to a Homeowners Association for community maintenance, amenities, and management. Similar fees include: Condo Association Fees, Co-op Maintenance Fees, etc. | n/a | n/a | n/a |
Operating ExpensesRecurring costs required to maintain and manage a rental property, including property taxes, insurance, maintenance, repairs, utilities (if paid by the owner), property management fees, and other day-to-day expenses. Calculation:Insurance + Property Taxes + Property Management + Repairs & Maintenance + Capital Expenditures + HOA Fees | 42% | -$1,475 | -$17,702 |
Cash Flow
| Monthly | Yearly | |
|---|---|---|
Net Operating Income (NOI)The income generated from a property after deducting all operating expenses but before deducting mortgage payments, taxes, and capital expenditures. Calculation:Gross Operating Income - Operating Expenses
Net operating income:
| $1,815 | $21,780 |
Mortgage PaymentThe fixed amount a borrower pays each month to repay a loan. It typically includes principal and interest (P&I) and may also cover property taxes, insurance, HOA fees, and PMI if escrowed. | -$4,605 | -$55,260 |
Cash FlowNet Operating Income (NOI) minus mortgage payments. Calculation:NOI - Mortgage Payments | $2,790 | $33,480 |