$700,000
Investment Summary
- Monthly Cash Flow
- -$2,042
- Cap Rate
- 2.8%
- Cash-on-Cash Return
- -15.2%
- Debt Coverage Ratio
- 0.44
- Internal Rate of Return (5 years)
- -10.7%
Cash Flow
Net Operating Income (NOI) minus mortgage payments.
Calculation:
NOI - Mortgage Payments
Cap Rate (Market Value)
Capitalization Rate is a rate of return that compares the yearly Net Operating Income (NOI) to the market value.
Calculation:
NOI / Market Value
Cash-on-Cash Return (CoC)
Annual Cash Flow / Cash Invested
Calculation:
Annual cash flow divided by initial cash invested.
Debt Coverage Ratio (DCR)
Net Operating Income (NOI) divided by total debt payments.
Calculation:
NOI / Total Debt Payments
Internal Rate of Return (IRR)
A metric for assessing profitability over time. IRR is the discount rate at which the net present value (NPV) of all future cash flows (positive and negative) from an investment equals zero — including both periodic cash flow (such as rent) and a projected sale at the end of the holding period. It represents the expected annualized return, accounting for income, expenses, and the recovery of capital through a future sale.
Property Description
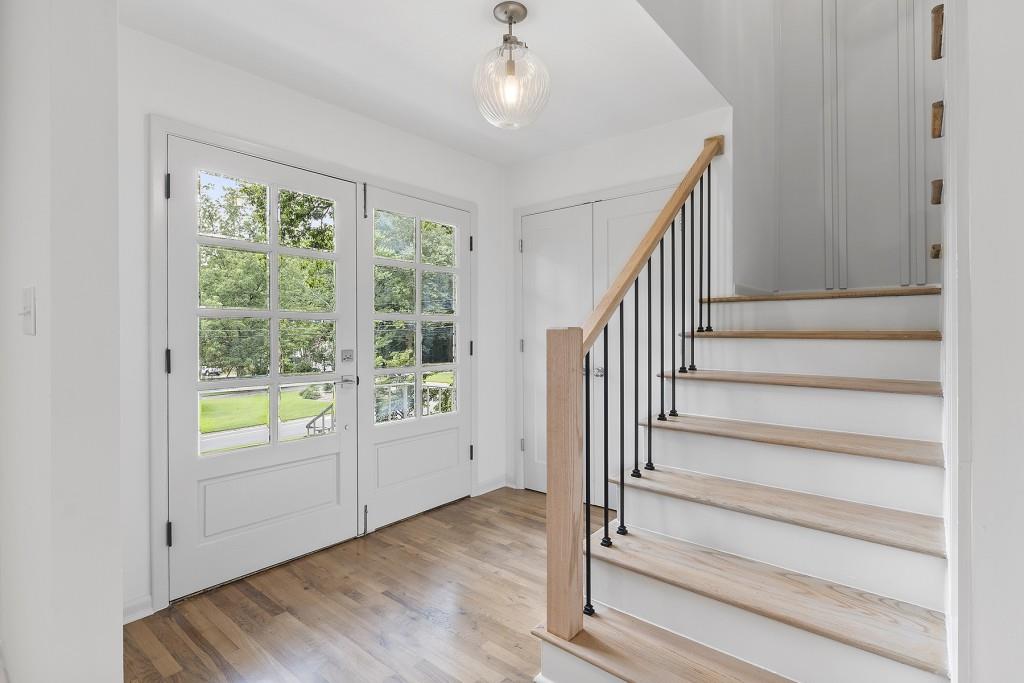
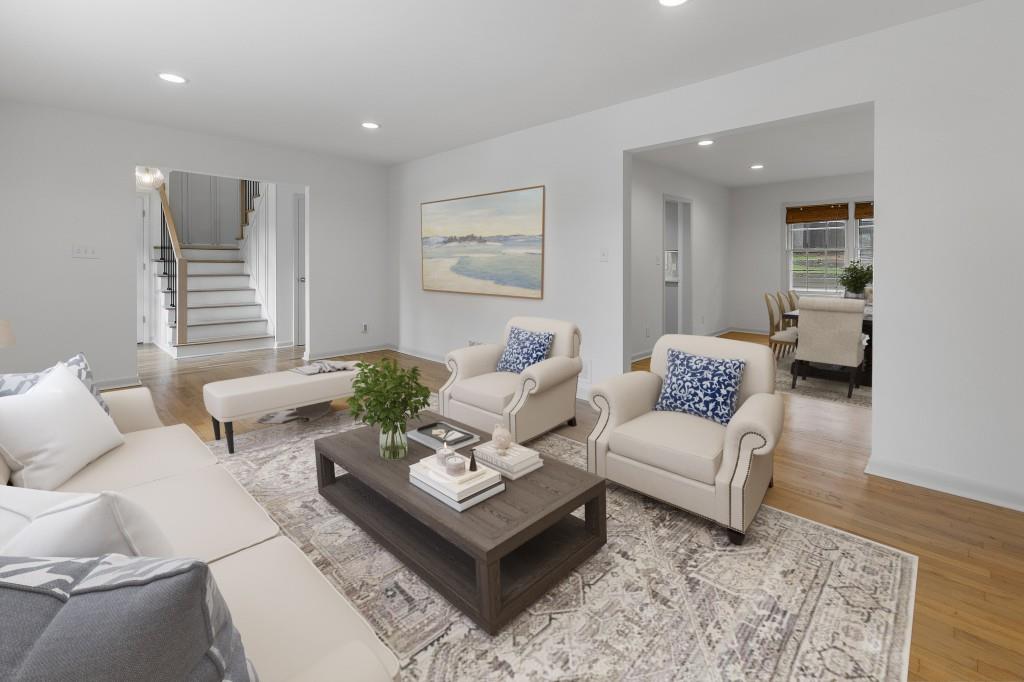
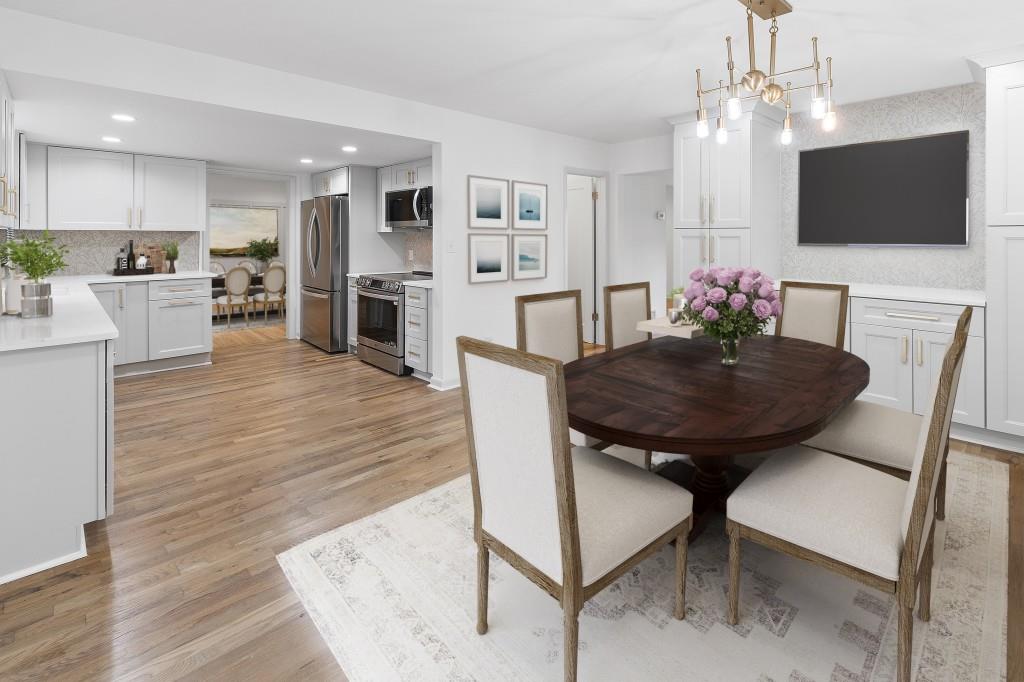
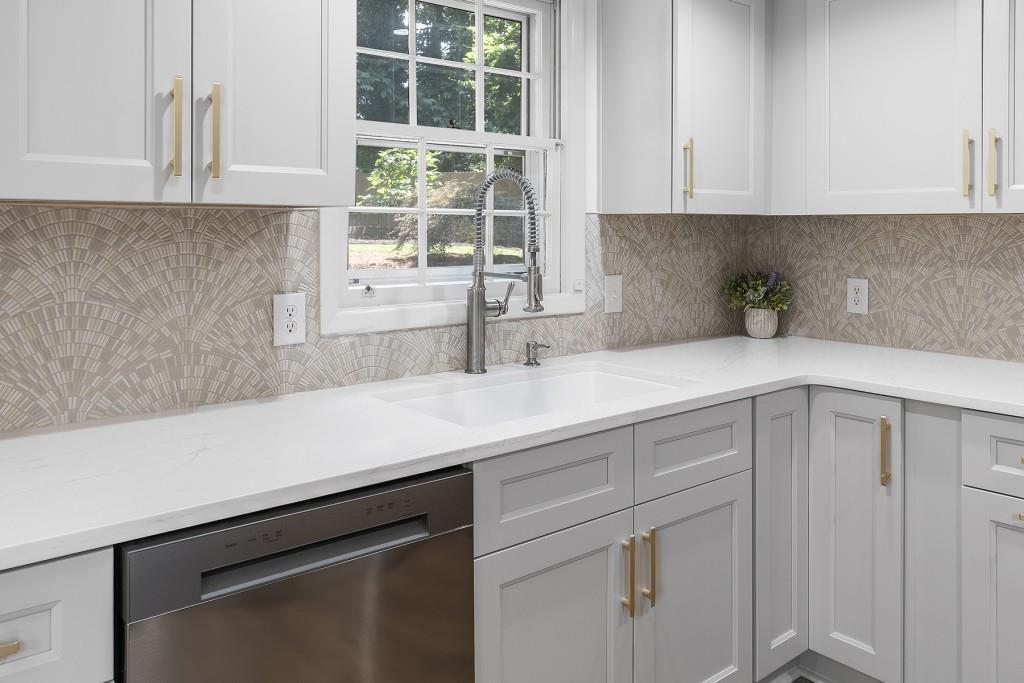
Brick Traditional in Huntley Hills Priced Below Appraised Value! Progressive vibes meet casual elegance in Chamblee with one of the only few traditional floorplans in the neighborhood! One of the most exquisitely updated homes in sought-after Huntley Hills with surely one of the most desirable lots and locations. Picturesque front elevation with lovely French beveled glass front doors off the brick porch. Naturally flowing floorplan and bespoke design mingle beautifully to craft the city home you have been dreaming of! The openness with dedicated spaces pair to make this property ideal both for entertaining as well as everyday living. This four bedroom, two full and one partial bathroom residence exudes an open, airy feel with an abundance of natural light flooding through the blinds and striking architectural details! The main level showcases a custom embellished foyer and two-story stairwell, bright living room, dedicated dining room with picture-frame molding, and the luxurious kitchen. This breathtaking kitchen sparkles with soft-close escada cabinetry, quartz counters, intricate fan-detail backsplash, and stainless-steel appliances. Take the opportunity to dine in your eating room with views of the far stretching, private oasis awaiting beyond its double sliding glass doors, or choose to dine alfresco on your covered patio or cabana. Enjoy walking upstairs to your primary oasis as you climb alongside the custom feature walls and handcrafted white oak and metal railings. The oversized primary suite, beautifully appointed with a custom feature wall, offers double closets, wiring for mounted tv, updated ensuite, and overlooks the gorgeous backyard. Also upstairs, you will discover three more generous secondary bedrooms with ample storage space and another full bathroom with the most stunning sconces. While indoors, you will appreciate the many designer upgrades and finishes, stunning Progressive Lighting and Kohler fixtures, custom rails, and hardwoods throughout. The two-car garage on kitchen level, with its brand-new garage door and system, and private backyard access, provides all the storage and ease one can desire. The backyard is truly a showstopping treat! Designed by a local landscape architect, this wonderment boasts a covered patio, covered cabana with Trex decking, and slate chip permeable paved courtyard with fire pit. Rock and timber planter walls with built-in floating benches terrace to the verdant sodded lawn and playset. Already prepared for an outdoor television on the patio, this secluded backyard with privacy fence is ideal for a peaceful retreat, entertaining, active play, and throwing the ball to a pup or two. Located right around the corner from the Huntley Hills Swim and Tennis Club. Proximity to local shopping, dining, neighborhood park, schools, trails, and all Downtown Chamblee has to offer! This genuinely impressive property will surpass all your expectations. Welcome home to 3981 Longview Drive!
Build Your Team
Quickly find investor-friendly professionals who can help you succeed in real estate investing at any stage of the investing journey.


Agents
Match with investor-friendly agents who can help you find, analyze, and close your next deal


Lenders
Get the best funding…find investor-friendly lenders who specialize in your deal strategy


Property Managers
Transition to passive investing. Find a trusted property management partnership that lasts.


Tax Pros & Accountants
Taxes and financial reporting made easy—find experts to create tax savings strategies, file taxes, and more
Location
Property Details
Parking
- Description: Garage, Garage Faces Front, Kitchen Level, Parking Pad
- Details: Garage Faces Front, Kitchen Level, Parking Pad
- Garage Spaces: 0
- Spaces Total: 0
Bedroom Information
- # of Bedrooms: 4
Bathroom Information
- # of Baths (Full): 2
- # of Baths (Partial): 1
- # of Baths (Total): 3.0
Interior Features
- # of Stories: 2
- Basement Description: Crawl Space
Exterior Features
- Exterior Walls Materials: Brick
- Foundation: Concrete Perimeter, Pillar/Post/Pier
- Roof Material: Composition, Shingle
Land Information
- Land Use: Residential
- Land Use Subtype: Single Family Residential
Lot Information
- Parcel ID: 1832417006
- Lot Size: 0 sqft
Property Information
- Property Type: Single Family Residence
- Style: Traditional
- Year Built: 1964
Tax Information
- Annual Tax: $9,622
Utilities
- Water & Sewer: Public
- Heating: Central, Forced Air
- Cooling: Ceiling Fan(s), Central Air
Location
- County: De Kalb
Listing Details
Investment Summary
- Monthly Cash Flow
- -$2,042
- Cap Rate
- 2.8%
- Cash-on-Cash Return
- -15.2%
- Debt Coverage Ratio
- 0.44
- Internal Rate of Return (5 years)
- -10.7%
Cash Flow
Net Operating Income (NOI) minus mortgage payments.
Calculation:
NOI - Mortgage Payments
Cap Rate (Market Value)
Capitalization Rate is a rate of return that compares the yearly Net Operating Income (NOI) to the market value.
Calculation:
NOI / Market Value
Cash-on-Cash Return (CoC)
Annual Cash Flow / Cash Invested
Calculation:
Annual cash flow divided by initial cash invested.
Debt Coverage Ratio (DCR)
Net Operating Income (NOI) divided by total debt payments.
Calculation:
NOI / Total Debt Payments
Internal Rate of Return (IRR)
A metric for assessing profitability over time. IRR is the discount rate at which the net present value (NPV) of all future cash flows (positive and negative) from an investment equals zero — including both periodic cash flow (such as rent) and a projected sale at the end of the holding period. It represents the expected annualized return, accounting for income, expenses, and the recovery of capital through a future sale.
Purchase Details
Purchase PriceThe price paid for the property. Purchase price:
| $700,000 |
|---|---|
Amount FinancedThe amount of the purchase financed through a loan. Amount financed:
| -$560,000 |
Down paymentThe initial payment made towards the purchase. Down payment:
| $140,000 |
Closing CostsFees and expenses associated with purchasing a property, typically ranging from 2% to 5% of the home’s purchase price, paid at the end of a home purchase to cover services like lending, title transfer, and taxes. Closing costs:
| $21,000 |
Rehab CostsCosts incurred to repair or improve the property, including: roof, flooring, exterior siding, kitchen, exterior paint, bathrooms, etc. Rehab costs:
| $0 |
Initial Cash InvestedThe total initial cash invested in the property. Calculation:Down payment + Buying costs + Rehab costs Initial cash invested:
| $161,000 |
Square Feet (SQFT)The total square footage of the property. Square feet:
| 2,173 |
Cost Per Square FootCost per square foot of the property. Calculation:Purchase Price / Square Feet Cost per square foot:
| $322 |
Monthly Rent Per Square FootMonthly rent divided by the number of square feet. This ratio helps investors compare rental income efficiency across properties, markets, and unit sizes Calculation:Monthly Rent / Square Feet Monthly rent per square foot:
| $1.61 |
Financing Details
Loan AmountThe total sum of money borrowed from a lender to finance a property purchase. Calculation:Purchase Price - Down Payment
Loan amount:
| $560,000 |
|---|---|
Loan to Value Ratio (LTV)Loan amount divided by the market value of the property. Calculation:Loan Amount / Market Value
Loan to value ratio:
| 80.0% |
Loan TypeThe type of loan (e.g., fixed, adjustable).
Loan type:
| Amortizing |
TermThe loan repayment period in years.
Term:
| 30 years |
Interest RateThe percentage a lender charges on the borrowed amount of a loan, determining the cost of borrowing money.
Interest rate:
| 6.810% |
Principal & Interest (PI)The principal is the portion of the loan payment that reduces the loan balance. The interest is the lender's charge for borrowing money. Calculation:(P * r * (1 + r) ** n) / ((1 + r) ** n - 1) Where:
P = Loan amount (principal)
Principal & interest:
| $3,655 |
Property TaxesAnnual taxes levied by local governments on real estate properties. These taxes fund public services like schools, roads, and emergency services.
Property tax:
| $802 |
InsuranceThe costs for insurance coverage to protect against financial losses due to risks like fire, natural disasters, theft, liability, or tenant-related damages. Calculation:Assumes 7% of gross rental income, unless insurance rates are specified.
Insurance:
| $245 |
Private Mortgage Insurance (PMI)A fee that borrowers pay when they take out a conventional loan with a loan-to-value (LTV) ratio above 80%.
Private mortgage insurance (PMI):
| $0 |
Monthly PaymentThe fixed amount a borrower pays each month to repay a loan. It typically includes principal and interest (P&I) and may also cover property taxes, insurance, HOA fees, and PMI if escrowed. Monthly payment:
| $4,702 |
Operating Income
| % Rent | Monthly | Yearly | |
|---|---|---|---|
Gross RentThe total rental income received from tenants before deducting any expenses. Includes base rent, late fees, pet fees, parking fees, and other recurring charges.
Gross rent:
| $3,500 | $42,000 | |
Vacancy LossExpected loss of rent due to vacancies.
Vacancy loss:
(6%)
| 6% | -$210 | -$2,520 |
Operating IncomeGross rental income minus vacancy loss. Calculation:Gross rent - Vacancy loss
Operating income:
| $3,290 | $39,480 |
Operating Expenses
| % Rent | Monthly | Yearly | |
|---|---|---|---|
Property TaxesAnnual taxes levied by local governments on real estate properties. These taxes fund public services like schools, roads, and emergency services. | 23% | -$802 | -$9,622 |
InsuranceThe costs for insurance coverage to protect against financial losses due to risks like fire, natural disasters, theft, liability, or tenant-related damages. Calculation:Assumes 7% of gross rental income, unless insurance rates are specified. | 7% | -$245 | -$2,940 |
Property ManagementThe costs associated with hiring a property manager to handle the day-to-day operations of a rental property. Includes management fees, leasing fes, eviction fees, etc. Calculation:Assumes 8% of gross rental income. | 8% | -$280 | -$3,360 |
Repairs & MaintenanceOngoing costs for routine upkeep and minor fixes needed to keep a property in good working condition. Calculation:Assumes 5% of gross rental income. Varies by property age and condition. | 5% | -$175 | -$2,100 |
Capital ExpensesLarge, infrequent costs for major improvements or replacements, like a new roof, HVAC system, or appliances. Calculation:Assumes 5% of gross rental income. Varies by property age. | 5% | -$175 | -$2,100 |
HOA FeesRegular dues paid to a Homeowners Association for community maintenance, amenities, and management. Similar fees include: Condo Association Fees, Co-op Maintenance Fees, etc. | n/a | n/a | n/a |
Operating ExpensesRecurring costs required to maintain and manage a rental property, including property taxes, insurance, maintenance, repairs, utilities (if paid by the owner), property management fees, and other day-to-day expenses. Calculation:Insurance + Property Taxes + Property Management + Repairs & Maintenance + Capital Expenditures + HOA Fees | 48% | -$1,677 | -$20,122 |
Cash Flow
| Monthly | Yearly | |
|---|---|---|
Net Operating Income (NOI)The income generated from a property after deducting all operating expenses but before deducting mortgage payments, taxes, and capital expenditures. Calculation:Gross Operating Income - Operating Expenses
Net operating income:
| $1,613 | $19,356 |
Mortgage PaymentThe fixed amount a borrower pays each month to repay a loan. It typically includes principal and interest (P&I) and may also cover property taxes, insurance, HOA fees, and PMI if escrowed. | -$3,655 | -$43,860 |
Cash FlowNet Operating Income (NOI) minus mortgage payments. Calculation:NOI - Mortgage Payments | $2,042 | $24,504 |