
$685,000
Investment Summary
- Monthly Cash Flow
- -$1,787
- Cap Rate
- 3.0%
- Cash-on-Cash Return
- -13.6%
- Debt Coverage Ratio
- 0.49
- Internal Rate of Return (5 years)
- -9.2%
Cash Flow
Net Operating Income (NOI) minus mortgage payments.
Calculation:
NOI - Mortgage Payments
Cap Rate (Market Value)
Capitalization Rate is a rate of return that compares the yearly Net Operating Income (NOI) to the market value.
Calculation:
NOI / Market Value
Cash-on-Cash Return (CoC)
Annual Cash Flow / Cash Invested
Calculation:
Annual cash flow divided by initial cash invested.
Debt Coverage Ratio (DCR)
Net Operating Income (NOI) divided by total debt payments.
Calculation:
NOI / Total Debt Payments
Internal Rate of Return (IRR)
A metric for assessing profitability over time. IRR is the discount rate at which the net present value (NPV) of all future cash flows (positive and negative) from an investment equals zero — including both periodic cash flow (such as rent) and a projected sale at the end of the holding period. It represents the expected annualized return, accounting for income, expenses, and the recovery of capital through a future sale.
Property Description
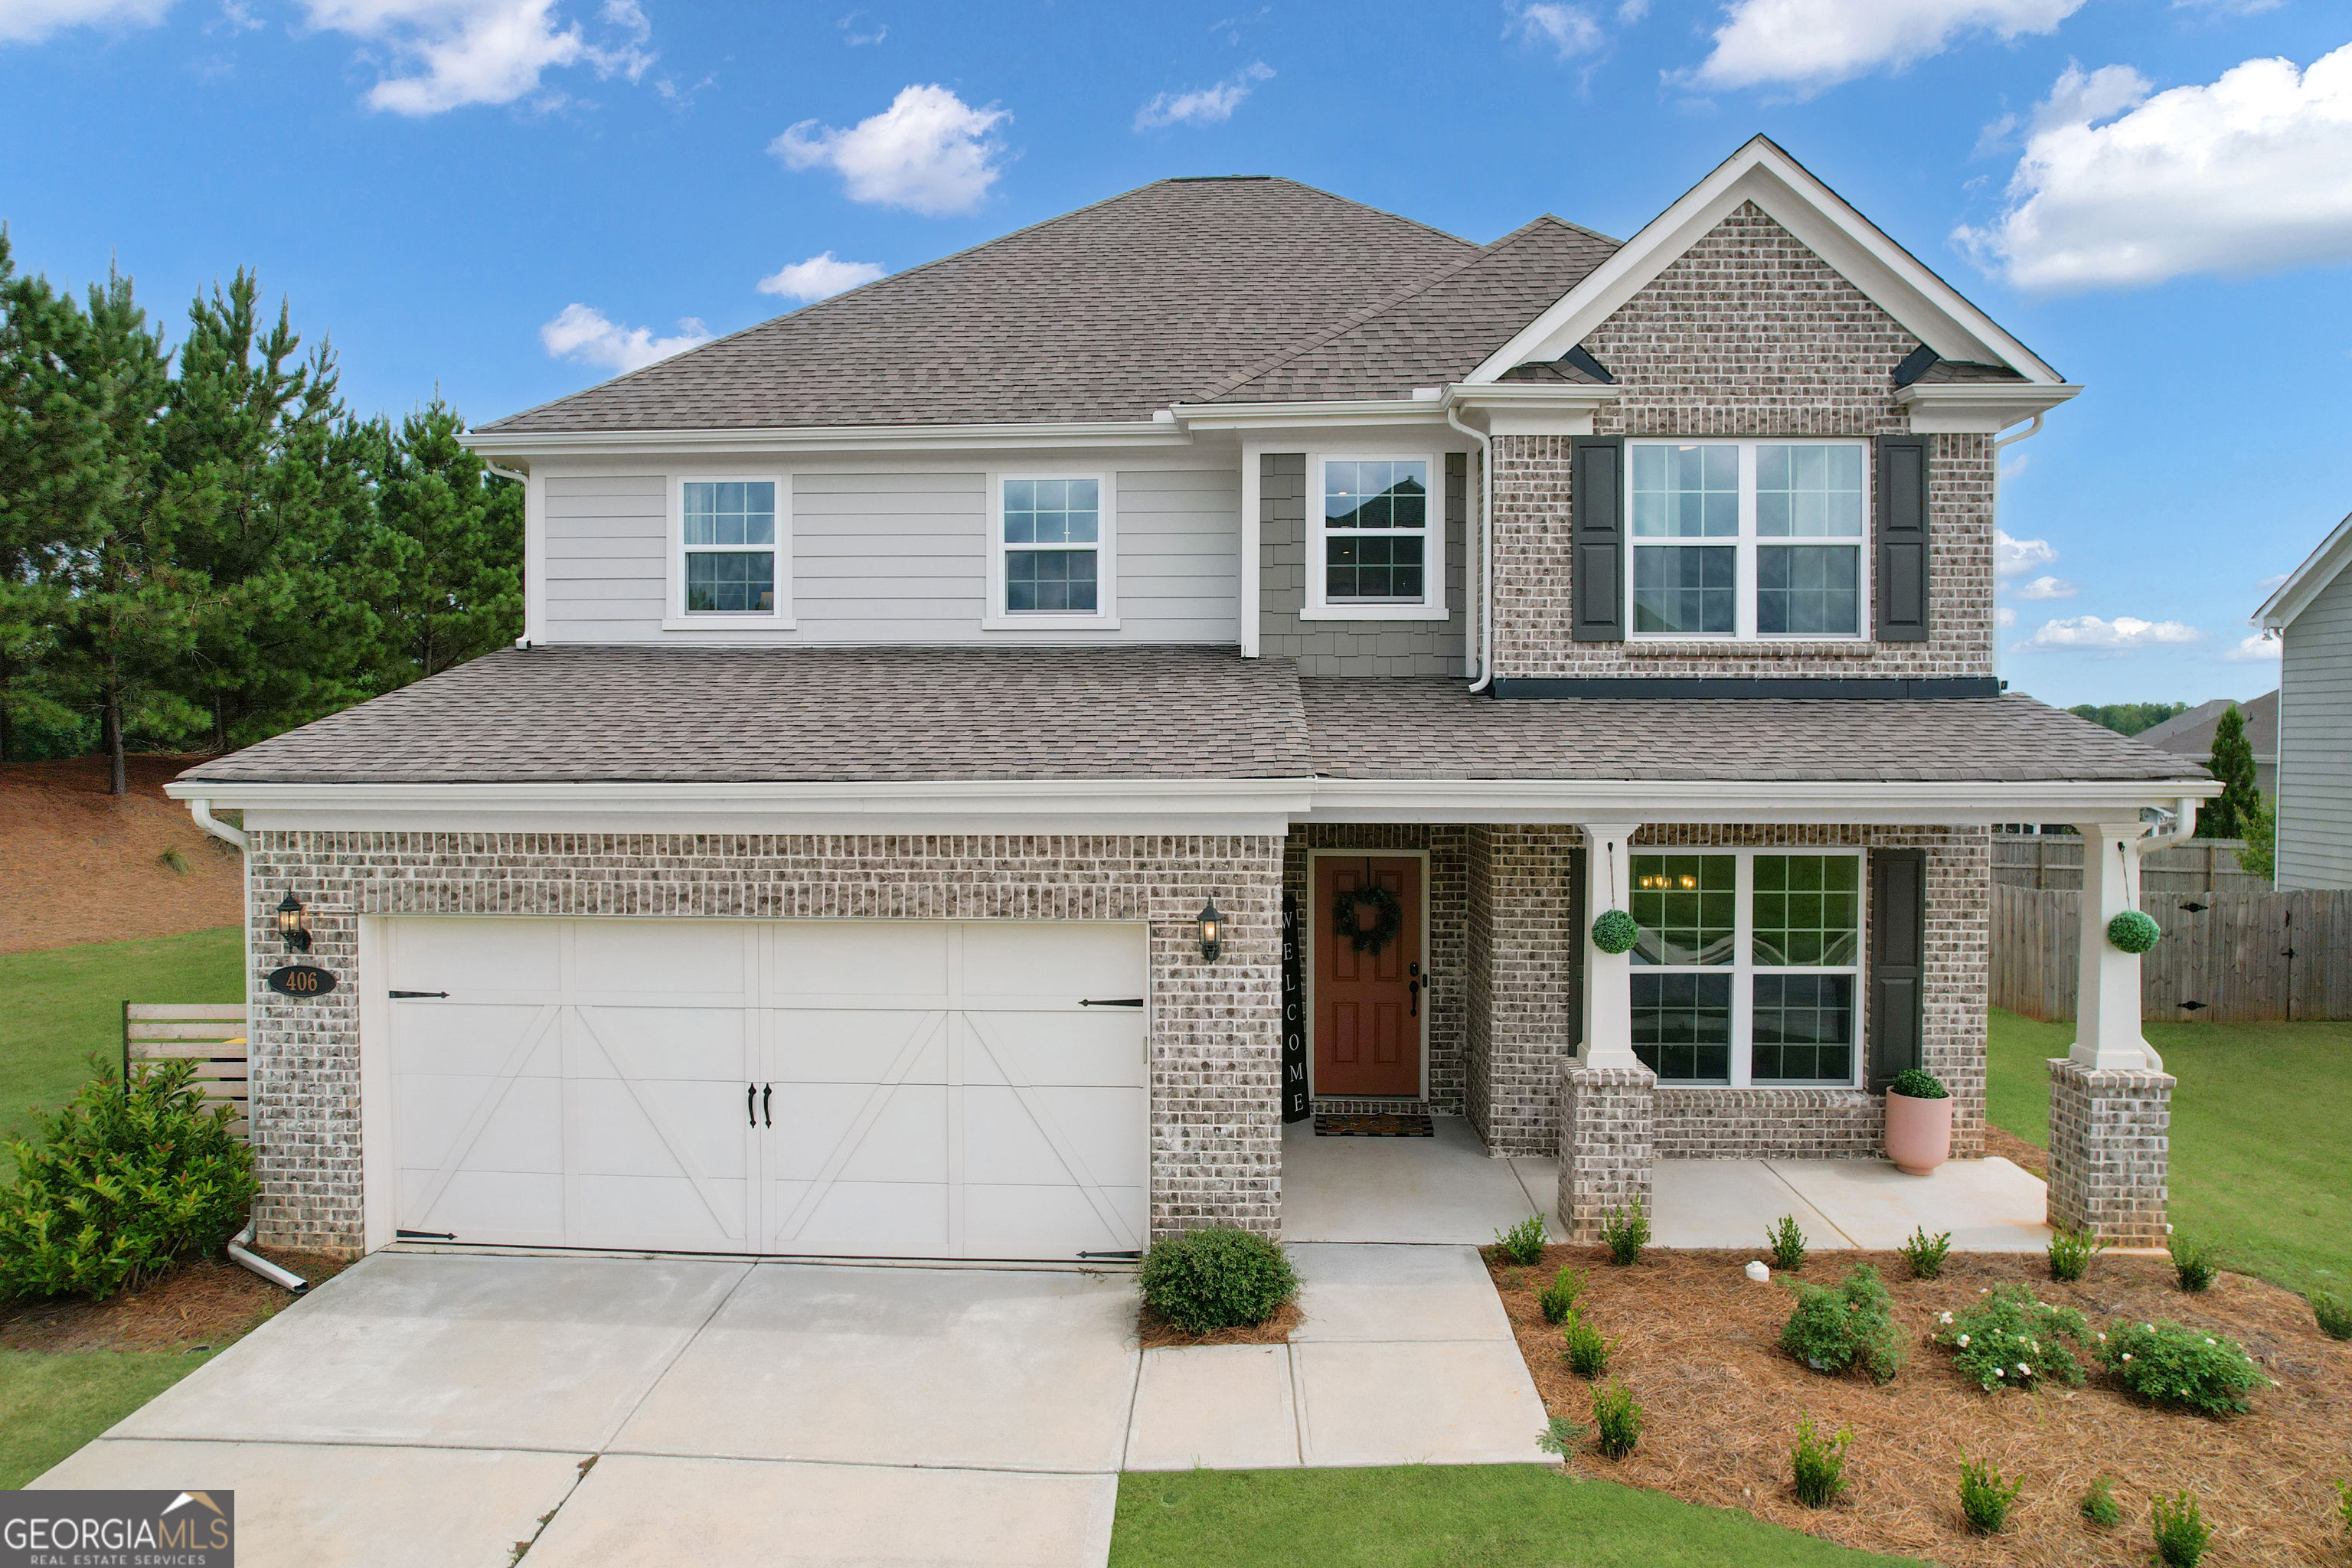
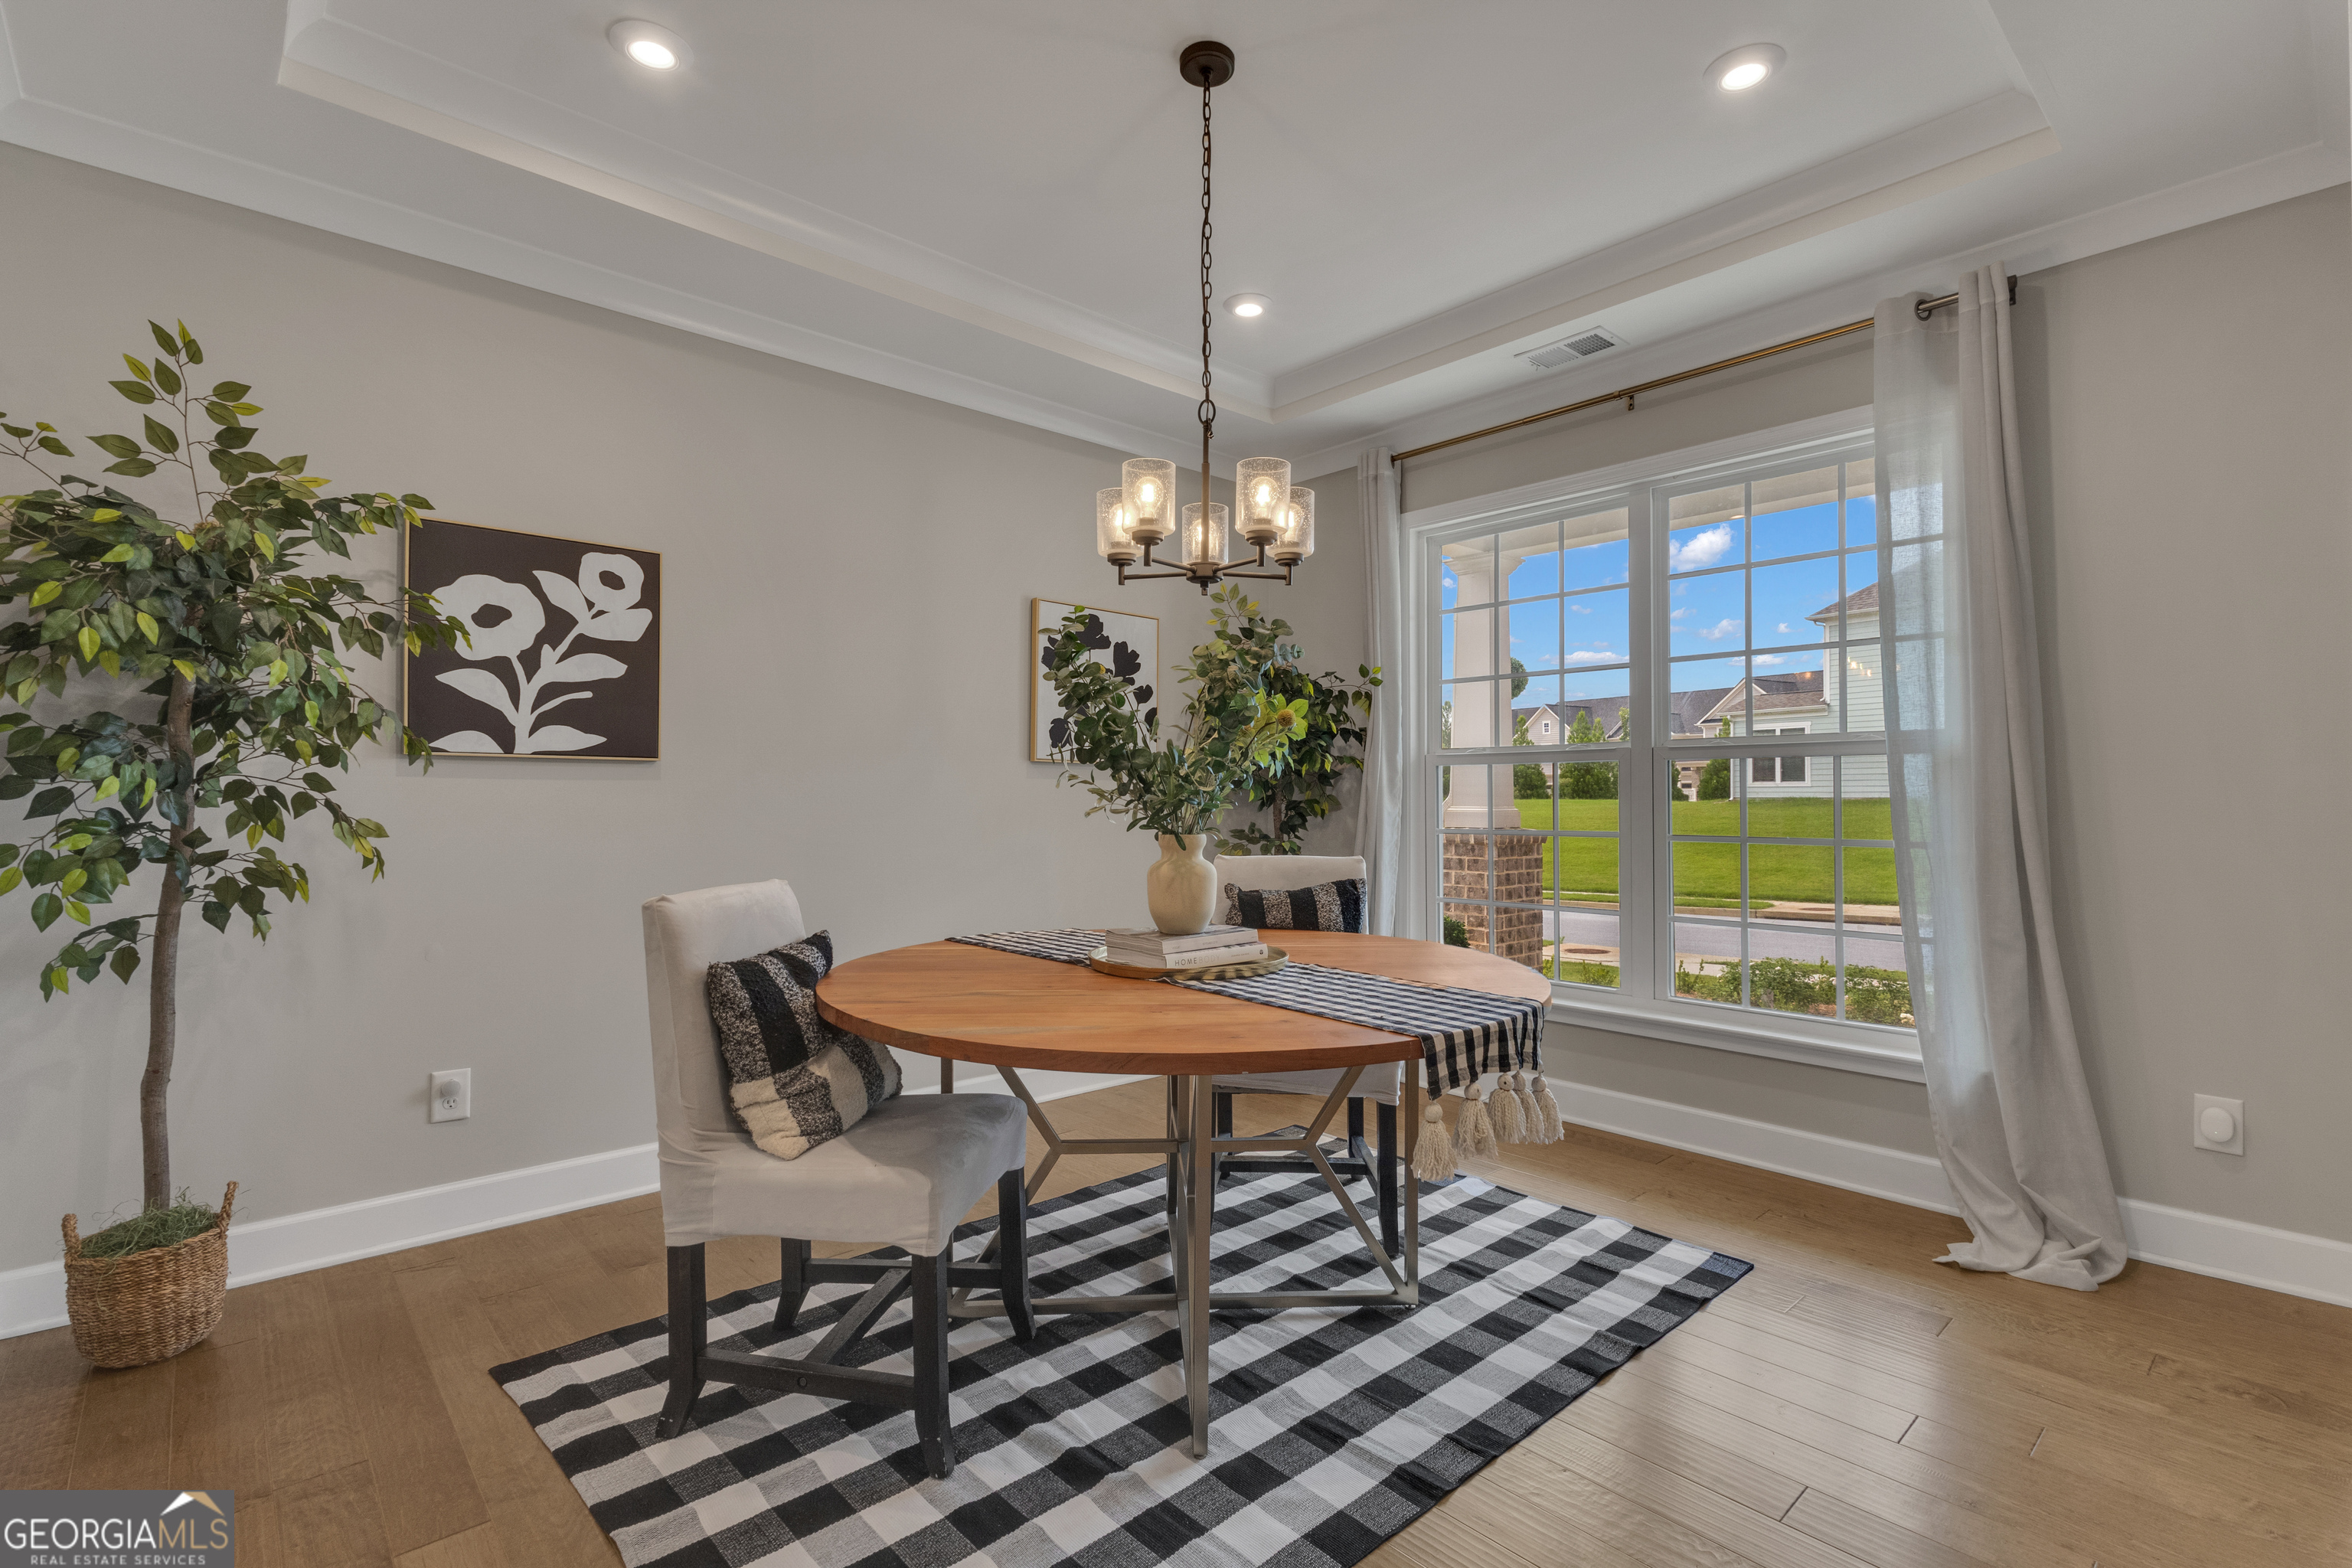
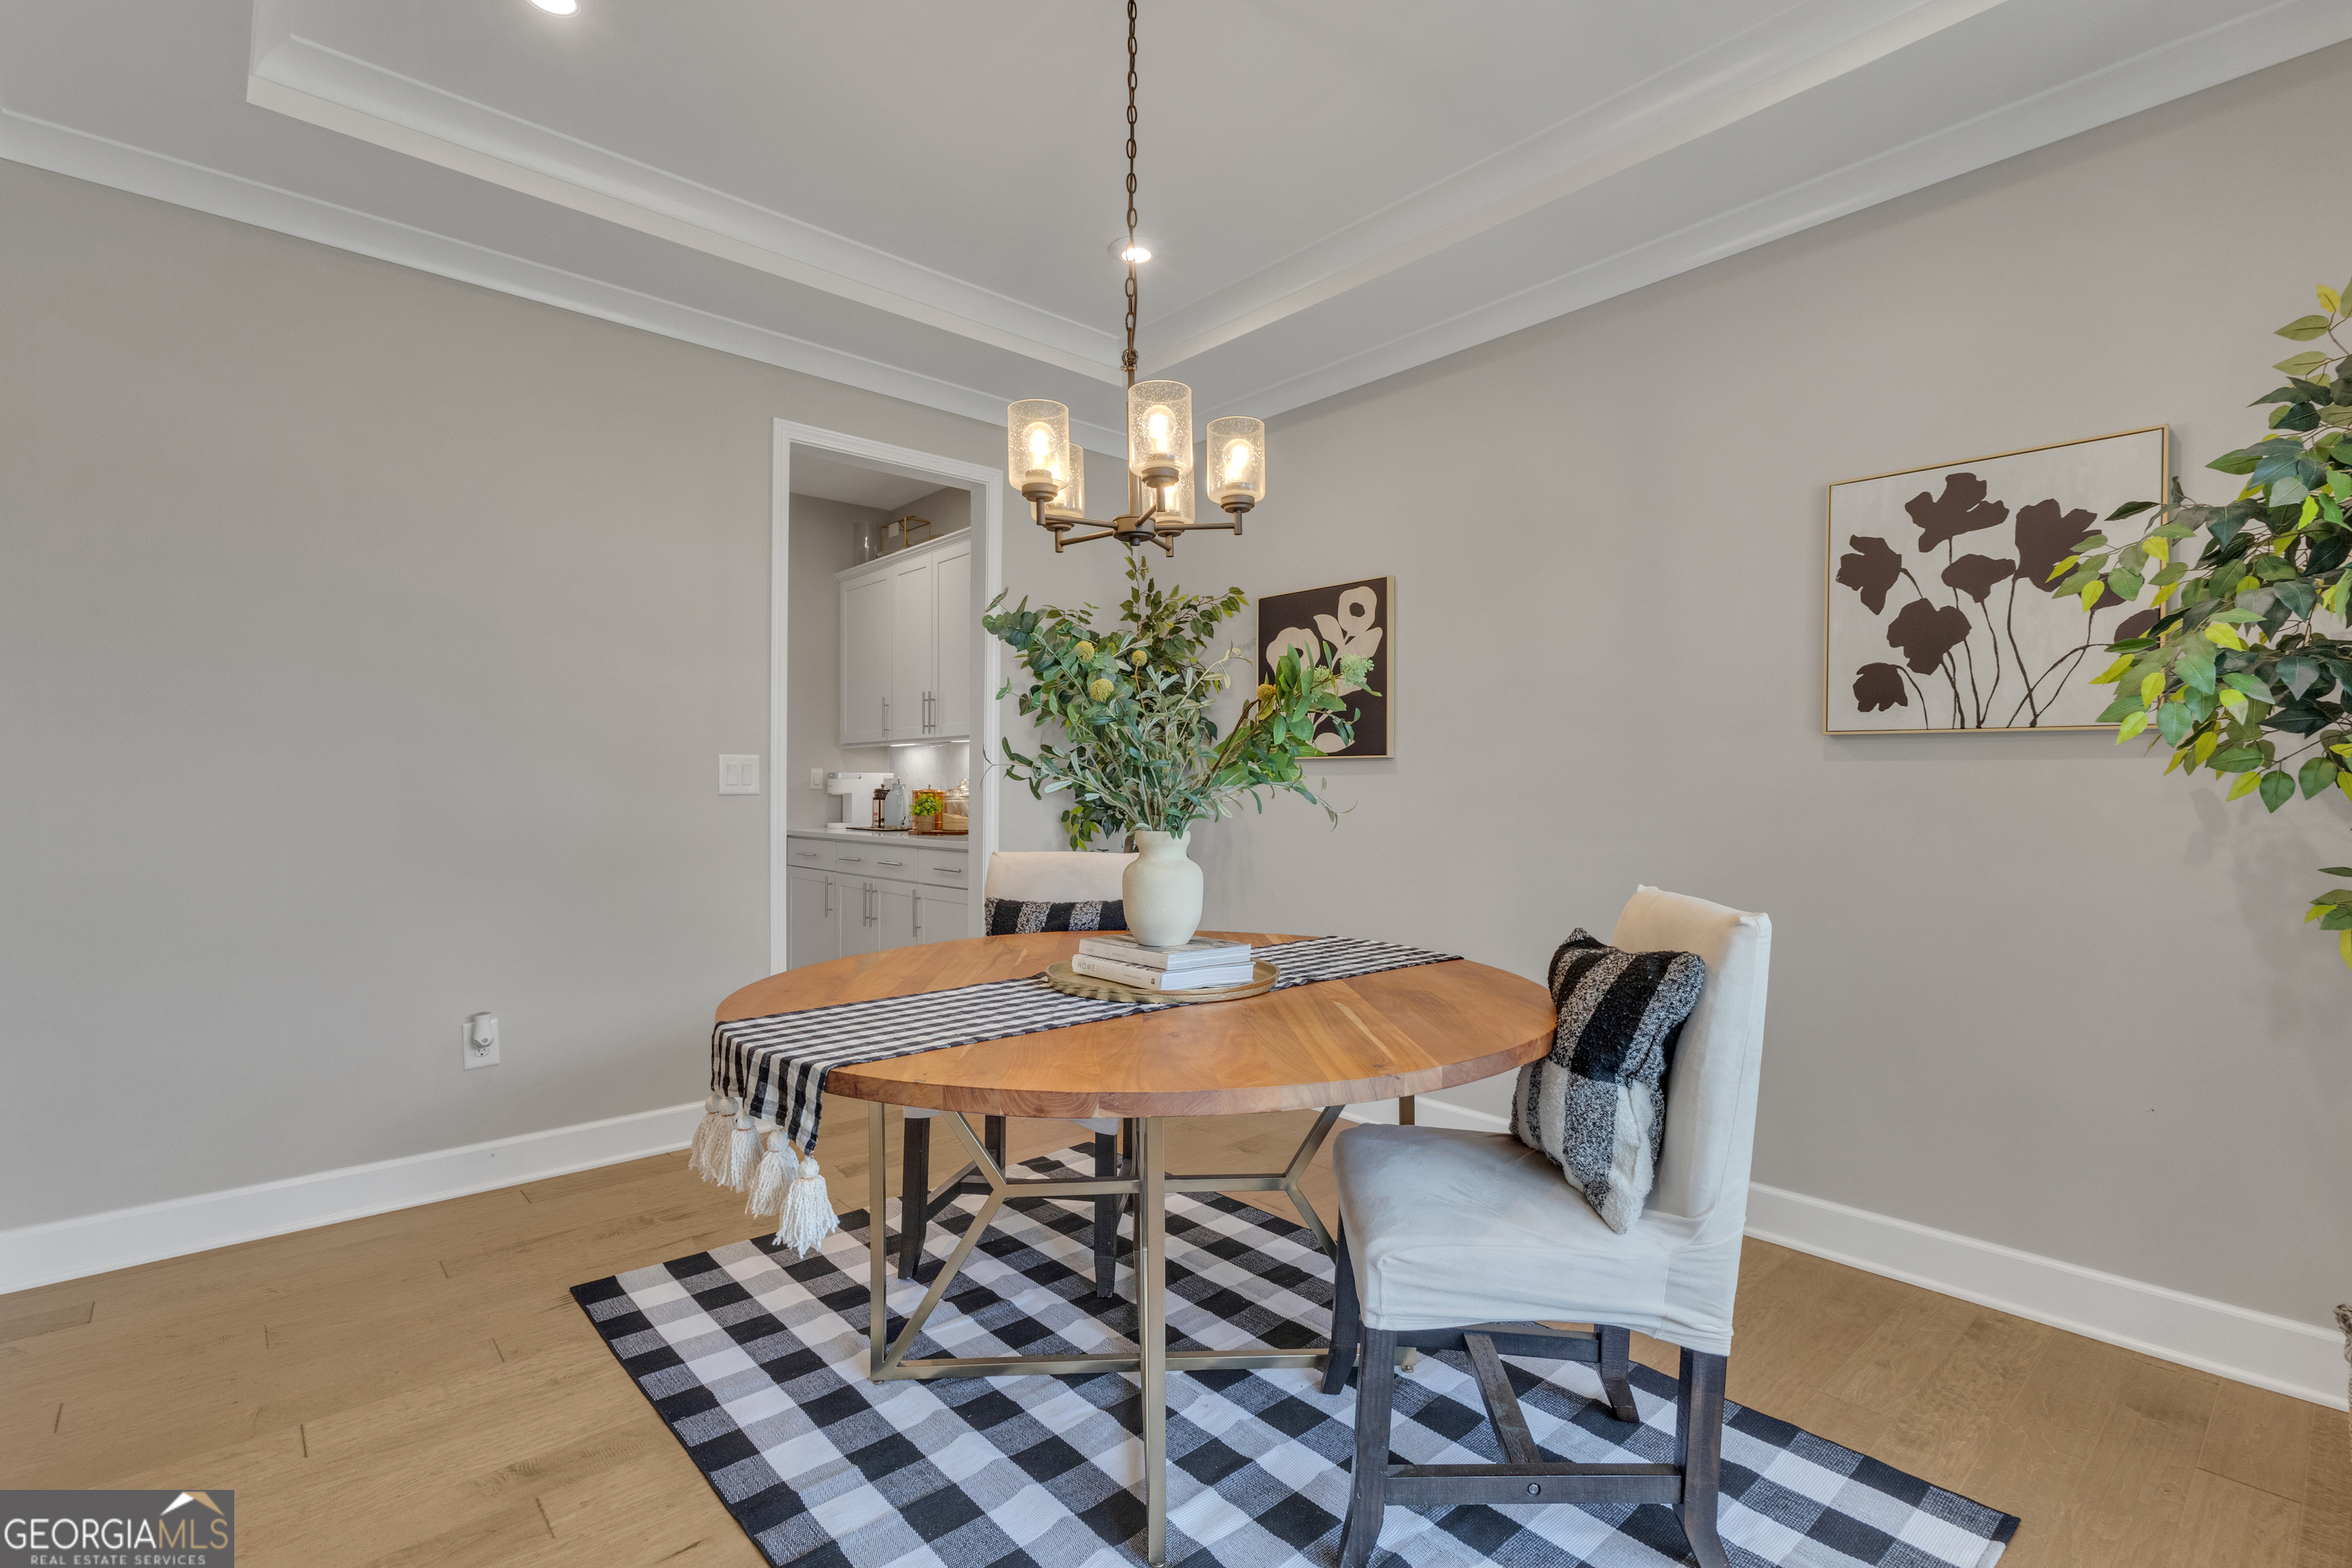
Warning: This Peachtree City home may cause sudden urges to host dinner parties, buy a golf cart, and never leave. From the moment you arrive at 406 Daker Dr, its timeless curb appeal invites you in-nestled on a corner lot with a welcoming front porch perfect for morning coffee or evening conversations. Step through the front door into a bright, open foyer where elegant crown molding, recessed lighting, and a trey ceiling in the dining room set the tone for refined living. The heart of the home unfolds in the gourmet kitchen, where quartz countertops, a tile backsplash, and white Aristokraft cabinetry meet Whirlpool stainless steel appliances, a 5-burner gas cooktop, vented hood, Blanco farmhouse sink, and a stylish coffee bar. A large island with seating seamlessly connects to the spacious family room, creating a perfect hub for entertaining. Tucked nearby, a butler's pantry and walk-in pantry ensure you'll never run out of storage space. Off the main living area, a sunroom floods the space with natural light, offering space for morning yoga and or a cozy space for a morning cup of coffee with gorgeous views of the backyard. A main-level guest suite with a full bath provides comfort and privacy for visitors, while a built-in office nook and mudroom/shoe station off the two-car garage add daily convenience. Upstairs, a loft-style bonus space greets you at the landing, offering the perfect spot for a reading nook, media space, or play area. The serene primary suite is a private retreat with a cozy sitting area, his-and-her walk-in closets, and a spa-inspired bath featuring a tile surround shower, soaking tub, and dual vanities. Three additional bedrooms-with walk-in closets-share a beautifully appointed bath with double vanity and tile floors. A laundry room with storage cabinetry and space for a folding station makes household chores a little more enjoyable. Outside, a patio awaits for summer barbecues or quiet evenings under the stars with a movie screen/firepit. The spacious backyard offers killer sunset views with lots of potential for gardening, a future pool or backyard gatherings. Beyond the home, Everton offers resort-style living with two swimming pools, a splash pad, open-air cabanas, tennis and pickleball courts, playgrounds, and meandering walking trails. With over 100 miles of golf cart paths connecting, you to Peachtree City's charm, you're just minutes from The Avenue's boutiques and dining, Trilith Studios, Lake McIntosh Park, and world-class golf. The convenience extends to being 20 minutes from Piedmont Hospital and just 30 minutes from Hartsfield-Jackson International Airport. With the upcoming U.S. Soccer Federation Headquarters nearby, the area's future is as bright as its present. 406 Daker Dr is more than a home-it's a lifestyle where elegance, comfort, and community meet.
Build Your Team
Quickly find investor-friendly professionals who can help you succeed in real estate investing at any stage of the investing journey.


Agents
Match with investor-friendly agents who can help you find, analyze, and close your next deal


Lenders
Get the best funding…find investor-friendly lenders who specialize in your deal strategy


Property Managers
Transition to passive investing. Find a trusted property management partnership that lasts.


Tax Pros & Accountants
Taxes and financial reporting made easy—find experts to create tax savings strategies, file taxes, and more
Location
Property Details
Parking
- Details: Garage, Garage Door Opener, Kitchen Level
- Garage Spaces: 2
- Spaces Total: 2
Bedroom Information
- # of Bedrooms: 5
Bathroom Information
- # of Baths (Full): 3
- # of Baths (Total): 3.0
Interior Features
- # of Stories: 2
- Basement Description: None
Exterior Features
- Exterior Walls Materials: Stucco
- Foundation: Slab
- Roof Material: Composition
HOA
- Has HOA: Yes
- HOA Fee: $1,236/annually
Land Information
- Land Use: Residential
- Land Use Subtype: Single Family Residential
Lot Information
- Parcel ID: 074626004
- Lot Size: 0 sqft
Property Information
- Property Type: Single Family Residence
- Style: Traditional
- Year Built: 2020
Tax Information
- Annual Tax: $7,079
Utilities
- Water & Sewer: Public
- Heating: Heat Pump, Central, Electric
- Cooling: Ceiling Fan(s), Central Air, Electric, Gas, Heat Pump, Whole House Fan
Location
- County: Fayette
Listing Details
Investment Summary
- Monthly Cash Flow
- -$1,787
- Cap Rate
- 3.0%
- Cash-on-Cash Return
- -13.6%
- Debt Coverage Ratio
- 0.49
- Internal Rate of Return (5 years)
- -9.2%
Cash Flow
Net Operating Income (NOI) minus mortgage payments.
Calculation:
NOI - Mortgage Payments
Cap Rate (Market Value)
Capitalization Rate is a rate of return that compares the yearly Net Operating Income (NOI) to the market value.
Calculation:
NOI / Market Value
Cash-on-Cash Return (CoC)
Annual Cash Flow / Cash Invested
Calculation:
Annual cash flow divided by initial cash invested.
Debt Coverage Ratio (DCR)
Net Operating Income (NOI) divided by total debt payments.
Calculation:
NOI / Total Debt Payments
Internal Rate of Return (IRR)
A metric for assessing profitability over time. IRR is the discount rate at which the net present value (NPV) of all future cash flows (positive and negative) from an investment equals zero — including both periodic cash flow (such as rent) and a projected sale at the end of the holding period. It represents the expected annualized return, accounting for income, expenses, and the recovery of capital through a future sale.
Purchase Details
Purchase PriceThe price paid for the property. Purchase price:
| $685,000 |
|---|---|
Amount FinancedThe amount of the purchase financed through a loan. Amount financed:
| -$548,000 |
Down paymentThe initial payment made towards the purchase. Down payment:
| $137,000 |
Closing CostsFees and expenses associated with purchasing a property, typically ranging from 2% to 5% of the home’s purchase price, paid at the end of a home purchase to cover services like lending, title transfer, and taxes. Closing costs:
| $20,550 |
Rehab CostsCosts incurred to repair or improve the property, including: roof, flooring, exterior siding, kitchen, exterior paint, bathrooms, etc. Rehab costs:
| $0 |
Initial Cash InvestedThe total initial cash invested in the property. Calculation:Down payment + Buying costs + Rehab costs Initial cash invested:
| $157,550 |
Square Feet (SQFT)The total square footage of the property. Square feet:
| 3,101 |
Cost Per Square FootCost per square foot of the property. Calculation:Purchase Price / Square Feet Cost per square foot:
| $221 |
Monthly Rent Per Square FootMonthly rent divided by the number of square feet. This ratio helps investors compare rental income efficiency across properties, markets, and unit sizes Calculation:Monthly Rent / Square Feet Monthly rent per square foot:
| $1.13 |
Financing Details
Loan AmountThe total sum of money borrowed from a lender to finance a property purchase. Calculation:Purchase Price - Down Payment
Loan amount:
| $548,000 |
|---|---|
Loan to Value Ratio (LTV)Loan amount divided by the market value of the property. Calculation:Loan Amount / Market Value
Loan to value ratio:
| 80.0% |
Loan TypeThe type of loan (e.g., fixed, adjustable).
Loan type:
| Amortizing |
TermThe loan repayment period in years.
Term:
| 30 years |
Interest RateThe percentage a lender charges on the borrowed amount of a loan, determining the cost of borrowing money.
Interest rate:
| 6.625% |
Principal & Interest (PI)The principal is the portion of the loan payment that reduces the loan balance. The interest is the lender's charge for borrowing money. Calculation:(P * r * (1 + r) ** n) / ((1 + r) ** n - 1) Where:
P = Loan amount (principal)
Principal & interest:
| $3,509 |
Property TaxesAnnual taxes levied by local governments on real estate properties. These taxes fund public services like schools, roads, and emergency services.
Property tax:
| $590 |
InsuranceThe costs for insurance coverage to protect against financial losses due to risks like fire, natural disasters, theft, liability, or tenant-related damages. Calculation:Assumes 7% of gross rental income, unless insurance rates are specified.
Insurance:
| $245 |
Private Mortgage Insurance (PMI)A fee that borrowers pay when they take out a conventional loan with a loan-to-value (LTV) ratio above 80%.
Private mortgage insurance (PMI):
| $0 |
Monthly PaymentThe fixed amount a borrower pays each month to repay a loan. It typically includes principal and interest (P&I) and may also cover property taxes, insurance, HOA fees, and PMI if escrowed. Monthly payment:
| $4,344 |
Operating Income
| % Rent | Monthly | Yearly | |
|---|---|---|---|
Gross RentThe total rental income received from tenants before deducting any expenses. Includes base rent, late fees, pet fees, parking fees, and other recurring charges.
Gross rent:
| $3,500 | $42,000 | |
Vacancy LossExpected loss of rent due to vacancies.
Vacancy loss:
(6%)
| 6% | -$210 | -$2,520 |
Operating IncomeGross rental income minus vacancy loss. Calculation:Gross rent - Vacancy loss
Operating income:
| $3,290 | $39,480 |
Operating Expenses
| % Rent | Monthly | Yearly | |
|---|---|---|---|
Property TaxesAnnual taxes levied by local governments on real estate properties. These taxes fund public services like schools, roads, and emergency services. | 17% | -$590 | -$7,080 |
InsuranceThe costs for insurance coverage to protect against financial losses due to risks like fire, natural disasters, theft, liability, or tenant-related damages. Calculation:Assumes 7% of gross rental income, unless insurance rates are specified. | 7% | -$245 | -$2,940 |
Property ManagementThe costs associated with hiring a property manager to handle the day-to-day operations of a rental property. Includes management fees, leasing fes, eviction fees, etc. Calculation:Assumes 8% of gross rental income. | 8% | -$280 | -$3,360 |
Repairs & MaintenanceOngoing costs for routine upkeep and minor fixes needed to keep a property in good working condition. Calculation:Assumes 5% of gross rental income. Varies by property age and condition. | 5% | -$175 | -$2,100 |
Capital ExpensesLarge, infrequent costs for major improvements or replacements, like a new roof, HVAC system, or appliances. Calculation:Assumes 5% of gross rental income. Varies by property age. | 5% | -$175 | -$2,100 |
HOA FeesRegular dues paid to a Homeowners Association for community maintenance, amenities, and management. Similar fees include: Condo Association Fees, Co-op Maintenance Fees, etc. | 3% | -$103 | -$1,236 |
Operating ExpensesRecurring costs required to maintain and manage a rental property, including property taxes, insurance, maintenance, repairs, utilities (if paid by the owner), property management fees, and other day-to-day expenses. Calculation:Insurance + Property Taxes + Property Management + Repairs & Maintenance + Capital Expenditures + HOA Fees | 45% | -$1,568 | -$18,816 |
Cash Flow
| Monthly | Yearly | |
|---|---|---|
Net Operating Income (NOI)The income generated from a property after deducting all operating expenses but before deducting mortgage payments, taxes, and capital expenditures. Calculation:Gross Operating Income - Operating Expenses
Net operating income:
| $1,722 | $20,664 |
Mortgage PaymentThe fixed amount a borrower pays each month to repay a loan. It typically includes principal and interest (P&I) and may also cover property taxes, insurance, HOA fees, and PMI if escrowed. | -$3,509 | -$42,108 |
Cash FlowNet Operating Income (NOI) minus mortgage payments. Calculation:NOI - Mortgage Payments | $1,787 | $21,444 |