
$999,900
Investment Summary
- Monthly Cash Flow
- -$2,374
- Cap Rate
- 3.3%
- Cash-on-Cash Return
- -12.4%
- Debt Coverage Ratio
- 0.54
- Internal Rate of Return (5 years)
- -8.0%
Cash Flow
Net Operating Income (NOI) minus mortgage payments.
Calculation:
NOI - Mortgage Payments
Cap Rate (Market Value)
Capitalization Rate is a rate of return that compares the yearly Net Operating Income (NOI) to the market value.
Calculation:
NOI / Market Value
Cash-on-Cash Return (CoC)
Annual Cash Flow / Cash Invested
Calculation:
Annual cash flow divided by initial cash invested.
Debt Coverage Ratio (DCR)
Net Operating Income (NOI) divided by total debt payments.
Calculation:
NOI / Total Debt Payments
Internal Rate of Return (IRR)
A metric for assessing profitability over time. IRR is the discount rate at which the net present value (NPV) of all future cash flows (positive and negative) from an investment equals zero — including both periodic cash flow (such as rent) and a projected sale at the end of the holding period. It represents the expected annualized return, accounting for income, expenses, and the recovery of capital through a future sale.
Property Description
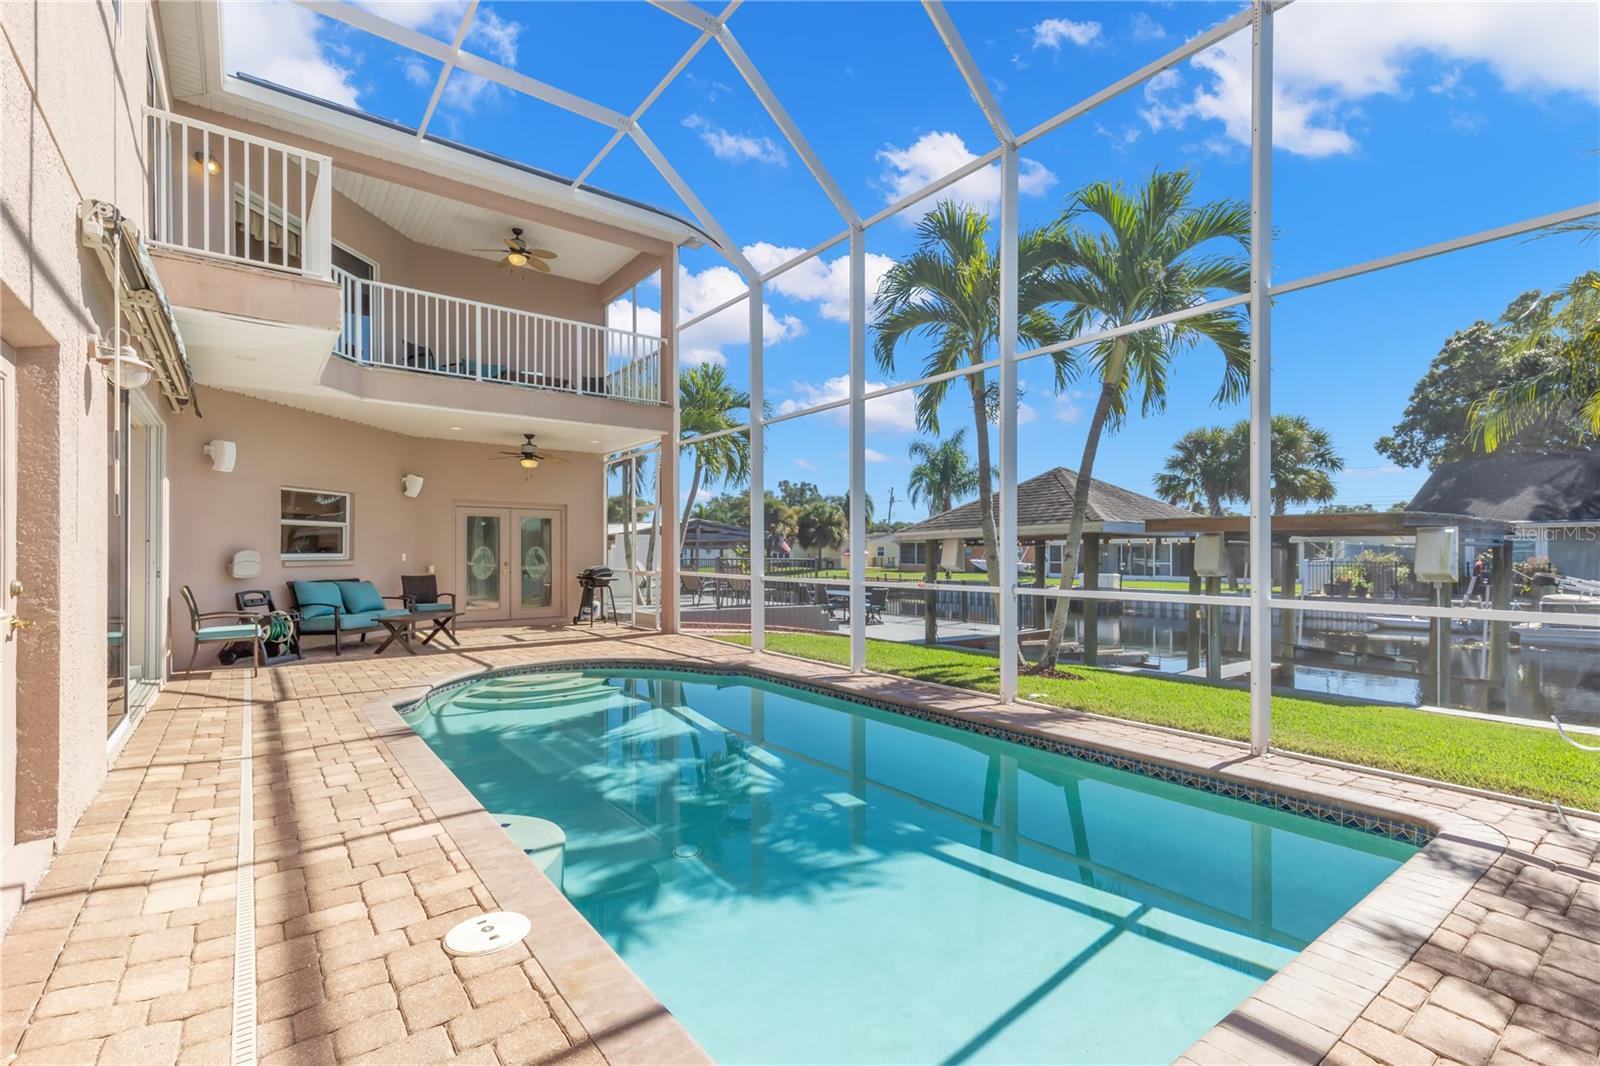
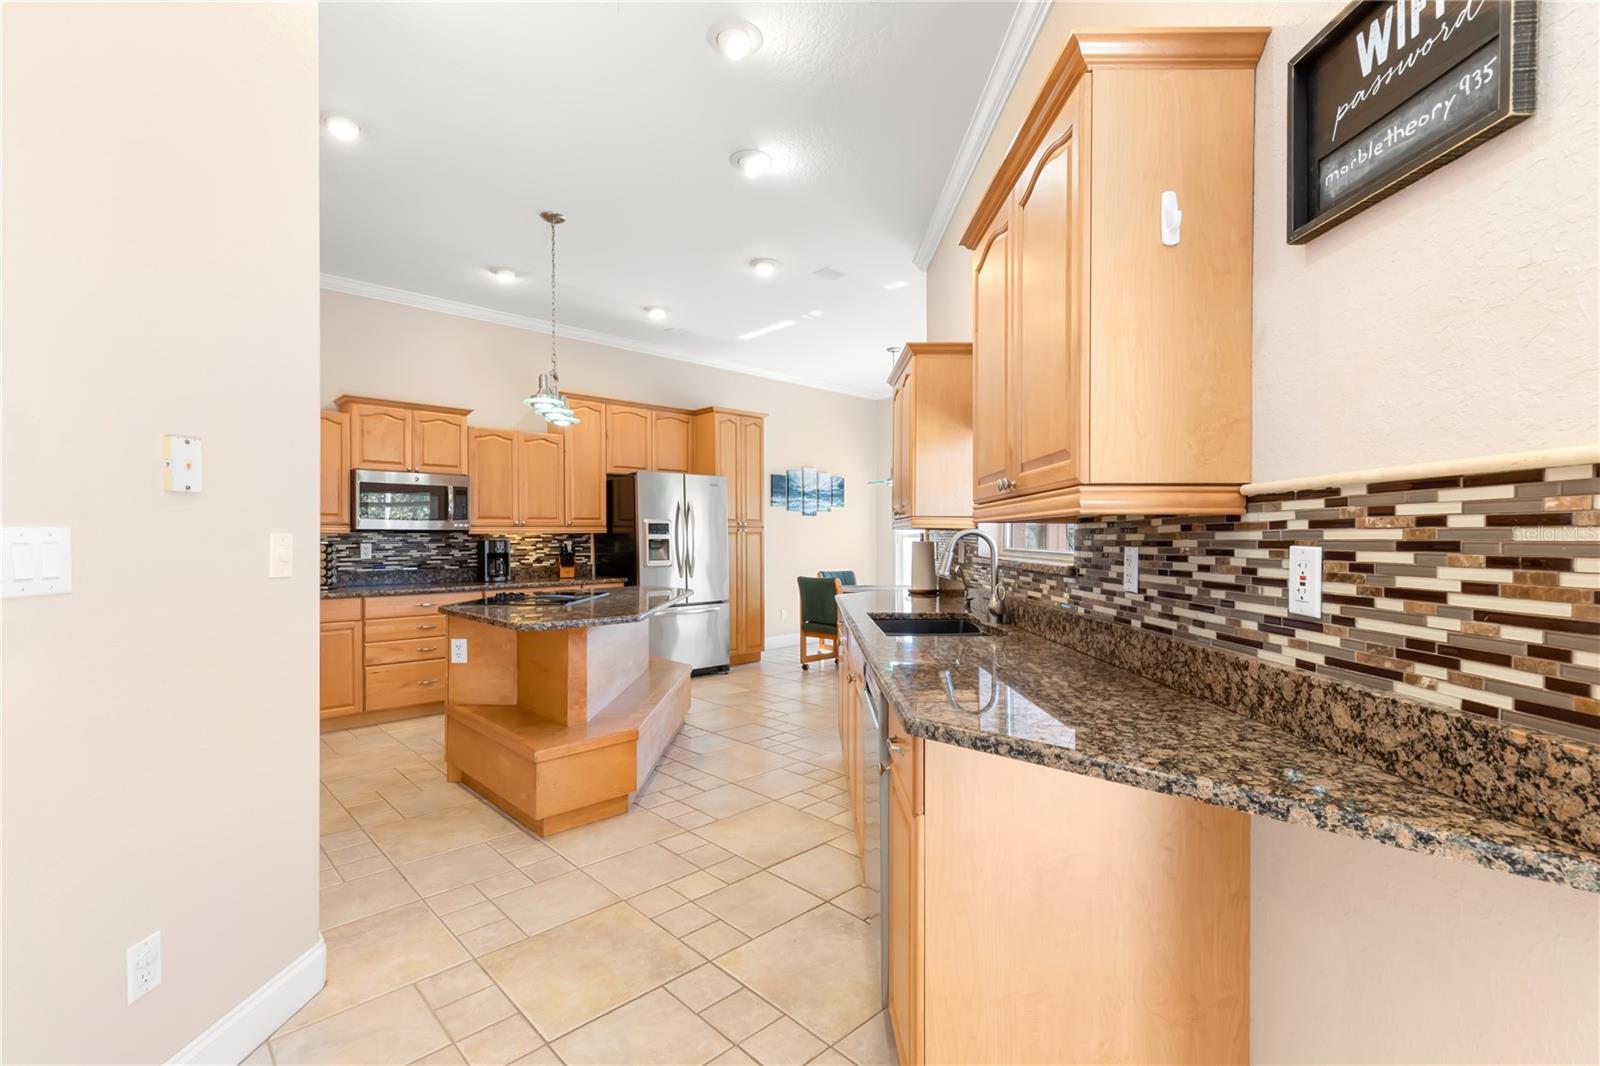
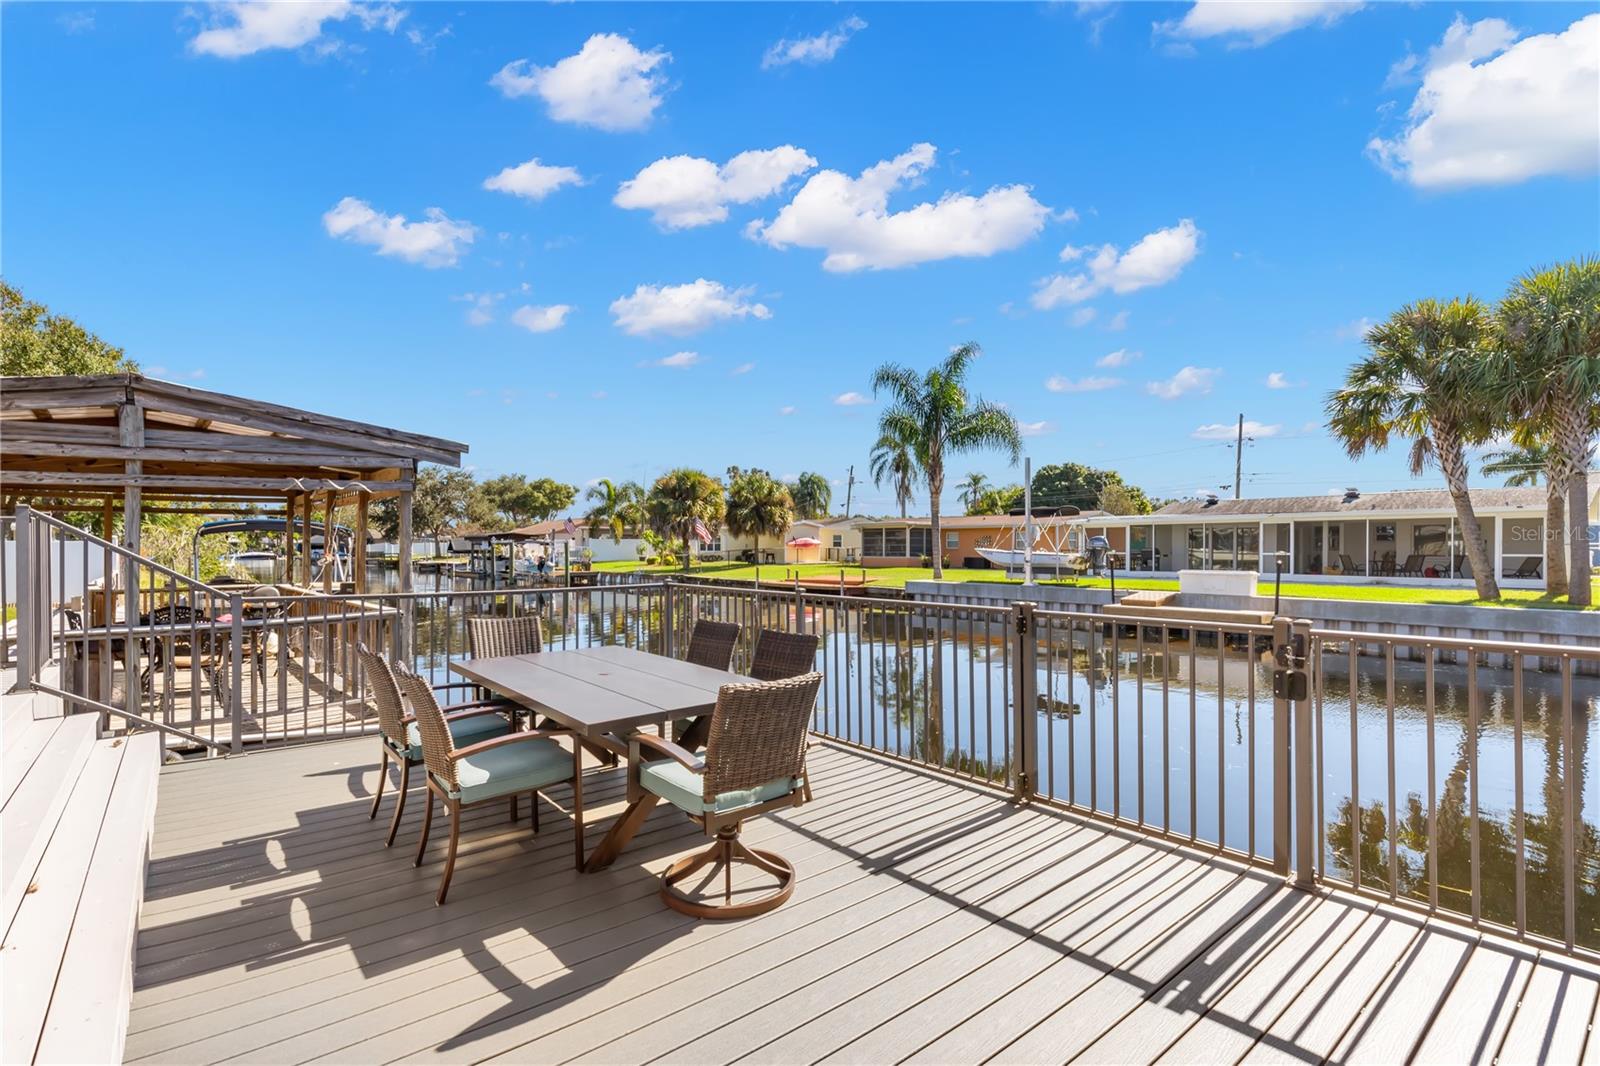
This stunning, custom-built waterfront home with a pool boasts 5 bedrooms and 3 bathrooms, meeting the needs of even the most particular home buyer. Situated on a broad, easily navigable canal leading to the spring-fed Lake Tarpon, this residence features a covered boat lift and a tandem jet ski lift. The chef's kitchen is equipped with luxurious maple wood cabinets, stainless-steel GE Profile appliances, including a double oven, and is finished with top-tier level 3 granite on the countertops and island. Adjacent to the kitchen, the inviting family room includes a fireplace set against a stone accent wall and a built-in surround sound system. The ground level also offers a game room with a bar, a convenient guest/pool bathroom, a fifth bedroom with a desk setup suitable for an office, and a spacious formal dining room. Ascending the classic wooden staircase, you'll find an open loft with hardwood flooring leading to three additional bedrooms, a laundry room, a secondary bathroom, and the master suite. The master suite features a walk-in California closet, a garden tub, a separate shower, dual vanities with granite tops, and sliding doors to a balcony overlooking the pool and waterway. The home's construction is robust, with block and stucco reinforced by 50 pilings and enhanced 2X6 framing on the second story. The clear pool has been updated to a saltwater system and includes a new heat pump. The property is enclosed with a fence, and the seawall is made of durable corrugated vinyl. The expansive dock, featuring an aluminum bar fence, serves as an extra space for outdoor entertainment. A large two-car garage includes a 220-volt electric car charging station, and the home is energy self-sufficient with a comprehensive solar panel array on the roof. The garage additionally has an entryway into the home through a climate-controlled extra-large utility room. The water heater comes with its own solar panel on the roof, complemented by a Kinetico whole-home water filtration system. This distinctive home is ideally situated near world-renowned beaches, excellent shopping, two airports, top-tier schools, Tampa, historic St. Petersburg, and the pristine springs and wilderness of the Nature Coast. Lake Tarpon, the largest lake in the tri-county area, provides exceptional fishing, boating, jet skiing, tubing, and lakefront dining that's boat-accessible, along with a slalom course for water sports aficionados. The lake's non-susceptibility to coastal flooding translates into highly affordable flood insurance for this property. Having functioned as both a family home and a profitable short-term rental (commanding $450-$579 a night depending on the season as a 4-bedroom Airbnb), this property offers a unique opportunity to acquire a splendid, secure waterfront residence. This solid home stayed high and dry during the storms and sustained zero damage! Buyer's agents are welcome.
Build Your Team
Quickly find investor-friendly professionals who can help you succeed in real estate investing at any stage of the investing journey.


Agents
Match with investor-friendly agents who can help you find, analyze, and close your next deal


Lenders
Get the best funding…find investor-friendly lenders who specialize in your deal strategy


Property Managers
Transition to passive investing. Find a trusted property management partnership that lasts.


Tax Pros & Accountants
Taxes and financial reporting made easy—find experts to create tax savings strategies, file taxes, and more
Location
Property Details
Parking
- Description: Electric Vehicle Charging Station(s), Garage Door Opener
- Details: Electric Vehicle Charging Station(s), Garage Door Opener, Attached
- Garage Spaces: 2
- Spaces Total: 0
Bedroom Information
- # of Bedrooms: 5
Bathroom Information
- # of Baths (Full): 2
- # of Baths (Partial): 1
- # of Baths (Total): 3.0
Interior Features
- # of Rooms: 10
- # of Stories: 2
- Fireplace: Yes
Exterior Features
- Exterior Walls Materials: Stucco
- Foundation: Slab
- Roof Type: Gable
- Roof Material: Shingle
- Pool: Yes
Land Information
- Land Use: Residential
- Land Use Subtype: Single Family Residential
Lot Information
- Parcel ID: 302716485460000410
- Lot Size: 6247 sqft
Property Information
- Property Type: Single Family Residence
- Year Built: 2005
Tax Information
- Annual Tax: $14,217
Utilities
- Water & Sewer: Public
- Heating: Central, Heat Pump
- Cooling: Central Air
Location
- County: Pinellas
Listing Details
Investment Summary
- Monthly Cash Flow
- -$2,374
- Cap Rate
- 3.3%
- Cash-on-Cash Return
- -12.4%
- Debt Coverage Ratio
- 0.54
- Internal Rate of Return (5 years)
- -8.0%
Cash Flow
Net Operating Income (NOI) minus mortgage payments.
Calculation:
NOI - Mortgage Payments
Cap Rate (Market Value)
Capitalization Rate is a rate of return that compares the yearly Net Operating Income (NOI) to the market value.
Calculation:
NOI / Market Value
Cash-on-Cash Return (CoC)
Annual Cash Flow / Cash Invested
Calculation:
Annual cash flow divided by initial cash invested.
Debt Coverage Ratio (DCR)
Net Operating Income (NOI) divided by total debt payments.
Calculation:
NOI / Total Debt Payments
Internal Rate of Return (IRR)
A metric for assessing profitability over time. IRR is the discount rate at which the net present value (NPV) of all future cash flows (positive and negative) from an investment equals zero — including both periodic cash flow (such as rent) and a projected sale at the end of the holding period. It represents the expected annualized return, accounting for income, expenses, and the recovery of capital through a future sale.
Purchase Details
Purchase PriceThe price paid for the property. Purchase price:
| $999,900 |
|---|---|
Amount FinancedThe amount of the purchase financed through a loan. Amount financed:
| -$799,920 |
Down paymentThe initial payment made towards the purchase. Down payment:
| $199,980 |
Closing CostsFees and expenses associated with purchasing a property, typically ranging from 2% to 5% of the home’s purchase price, paid at the end of a home purchase to cover services like lending, title transfer, and taxes. Closing costs:
| $29,997 |
Rehab CostsCosts incurred to repair or improve the property, including: roof, flooring, exterior siding, kitchen, exterior paint, bathrooms, etc. Rehab costs:
| $0 |
Initial Cash InvestedThe total initial cash invested in the property. Calculation:Down payment + Buying costs + Rehab costs Initial cash invested:
| $229,977 |
Square Feet (SQFT)The total square footage of the property. Square feet:
| 3,280 |
Cost Per Square FootCost per square foot of the property. Calculation:Purchase Price / Square Feet Cost per square foot:
| $305 |
Monthly Rent Per Square FootMonthly rent divided by the number of square feet. This ratio helps investors compare rental income efficiency across properties, markets, and unit sizes Calculation:Monthly Rent / Square Feet Monthly rent per square foot:
| $1.74 |
Financing Details
Loan AmountThe total sum of money borrowed from a lender to finance a property purchase. Calculation:Purchase Price - Down Payment
Loan amount:
| $799,920 |
|---|---|
Loan to Value Ratio (LTV)Loan amount divided by the market value of the property. Calculation:Loan Amount / Market Value
Loan to value ratio:
| 80.0% |
Loan TypeThe type of loan (e.g., fixed, adjustable).
Loan type:
| Amortizing |
TermThe loan repayment period in years.
Term:
| 30 years |
Interest RateThe percentage a lender charges on the borrowed amount of a loan, determining the cost of borrowing money.
Interest rate:
| 6.625% |
Principal & Interest (PI)The principal is the portion of the loan payment that reduces the loan balance. The interest is the lender's charge for borrowing money. Calculation:(P * r * (1 + r) ** n) / ((1 + r) ** n - 1) Where:
P = Loan amount (principal)
Principal & interest:
| $5,122 |
Property TaxesAnnual taxes levied by local governments on real estate properties. These taxes fund public services like schools, roads, and emergency services.
Property tax:
| $1,185 |
InsuranceThe costs for insurance coverage to protect against financial losses due to risks like fire, natural disasters, theft, liability, or tenant-related damages. Calculation:Assumes 7% of gross rental income, unless insurance rates are specified.
Insurance:
| $399 |
Private Mortgage Insurance (PMI)A fee that borrowers pay when they take out a conventional loan with a loan-to-value (LTV) ratio above 80%.
Private mortgage insurance (PMI):
| $0 |
Monthly PaymentThe fixed amount a borrower pays each month to repay a loan. It typically includes principal and interest (P&I) and may also cover property taxes, insurance, HOA fees, and PMI if escrowed. Monthly payment:
| $6,706 |
Operating Income
| % Rent | Monthly | Yearly | |
|---|---|---|---|
Gross RentThe total rental income received from tenants before deducting any expenses. Includes base rent, late fees, pet fees, parking fees, and other recurring charges.
Gross rent:
| $5,700 | $68,400 | |
Vacancy LossExpected loss of rent due to vacancies.
Vacancy loss:
(6%)
| 6% | -$342 | -$4,104 |
Operating IncomeGross rental income minus vacancy loss. Calculation:Gross rent - Vacancy loss
Operating income:
| $5,358 | $64,296 |
Operating Expenses
| % Rent | Monthly | Yearly | |
|---|---|---|---|
Property TaxesAnnual taxes levied by local governments on real estate properties. These taxes fund public services like schools, roads, and emergency services. | 21% | -$1,185 | -$14,217 |
InsuranceThe costs for insurance coverage to protect against financial losses due to risks like fire, natural disasters, theft, liability, or tenant-related damages. Calculation:Assumes 7% of gross rental income, unless insurance rates are specified. | 7% | -$399 | -$4,788 |
Property ManagementThe costs associated with hiring a property manager to handle the day-to-day operations of a rental property. Includes management fees, leasing fes, eviction fees, etc. Calculation:Assumes 8% of gross rental income. | 8% | -$456 | -$5,472 |
Repairs & MaintenanceOngoing costs for routine upkeep and minor fixes needed to keep a property in good working condition. Calculation:Assumes 5% of gross rental income. Varies by property age and condition. | 5% | -$285 | -$3,420 |
Capital ExpensesLarge, infrequent costs for major improvements or replacements, like a new roof, HVAC system, or appliances. Calculation:Assumes 5% of gross rental income. Varies by property age. | 5% | -$285 | -$3,420 |
HOA FeesRegular dues paid to a Homeowners Association for community maintenance, amenities, and management. Similar fees include: Condo Association Fees, Co-op Maintenance Fees, etc. | n/a | n/a | n/a |
Operating ExpensesRecurring costs required to maintain and manage a rental property, including property taxes, insurance, maintenance, repairs, utilities (if paid by the owner), property management fees, and other day-to-day expenses. Calculation:Insurance + Property Taxes + Property Management + Repairs & Maintenance + Capital Expenditures + HOA Fees | 46% | -$2,610 | -$31,317 |
Cash Flow
| Monthly | Yearly | |
|---|---|---|
Net Operating Income (NOI)The income generated from a property after deducting all operating expenses but before deducting mortgage payments, taxes, and capital expenditures. Calculation:Gross Operating Income - Operating Expenses
Net operating income:
| $2,748 | $32,976 |
Mortgage PaymentThe fixed amount a borrower pays each month to repay a loan. It typically includes principal and interest (P&I) and may also cover property taxes, insurance, HOA fees, and PMI if escrowed. | -$5,122 | -$61,464 |
Cash FlowNet Operating Income (NOI) minus mortgage payments. Calculation:NOI - Mortgage Payments | $2,374 | $28,488 |