$650,000
Investment Summary
- Monthly Cash Flow
- -$1,406
- Cap Rate
- 3.7%
- Cash-on-Cash Return
- -11.3%
- Debt Coverage Ratio
- 0.59
- Internal Rate of Return (5 years)
- -6.9%
Cash Flow
Net Operating Income (NOI) minus mortgage payments.
Calculation:
NOI - Mortgage Payments
Cap Rate (Market Value)
Capitalization Rate is a rate of return that compares the yearly Net Operating Income (NOI) to the market value.
Calculation:
NOI / Market Value
Cash-on-Cash Return (CoC)
Annual Cash Flow / Cash Invested
Calculation:
Annual cash flow divided by initial cash invested.
Debt Coverage Ratio (DCR)
Net Operating Income (NOI) divided by total debt payments.
Calculation:
NOI / Total Debt Payments
Internal Rate of Return (IRR)
A metric for assessing profitability over time. IRR is the discount rate at which the net present value (NPV) of all future cash flows (positive and negative) from an investment equals zero — including both periodic cash flow (such as rent) and a projected sale at the end of the holding period. It represents the expected annualized return, accounting for income, expenses, and the recovery of capital through a future sale.
Property Description
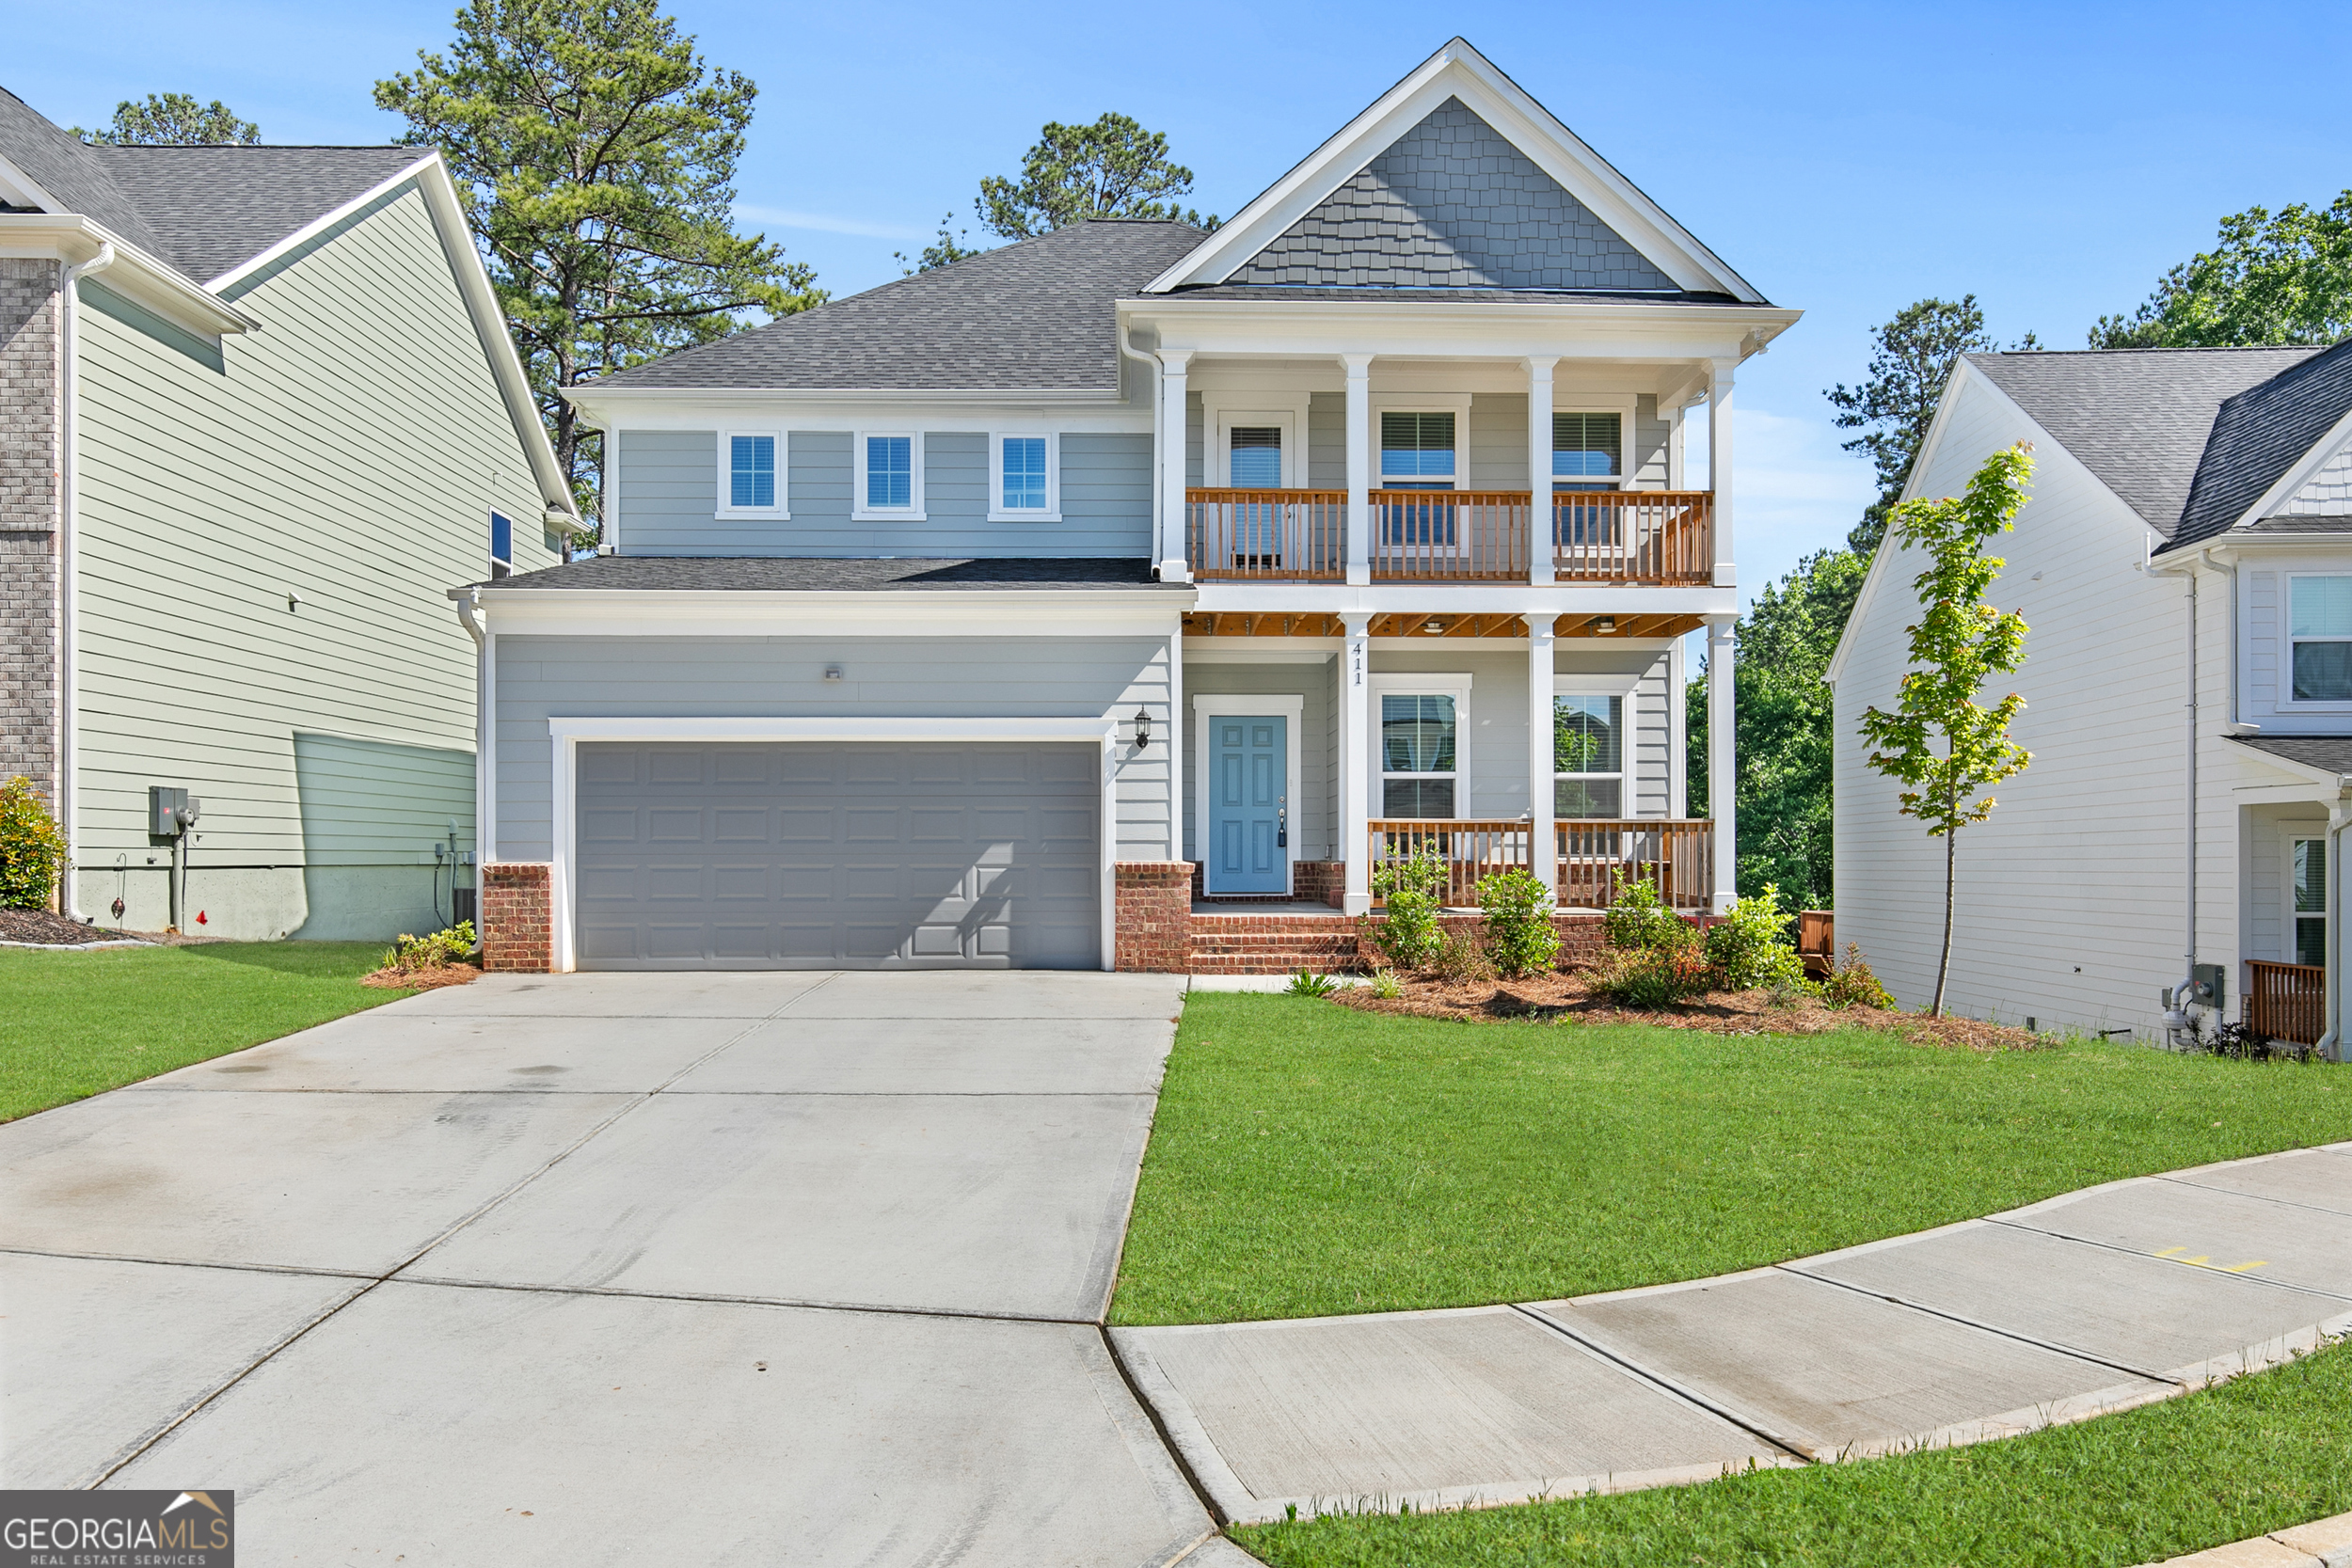
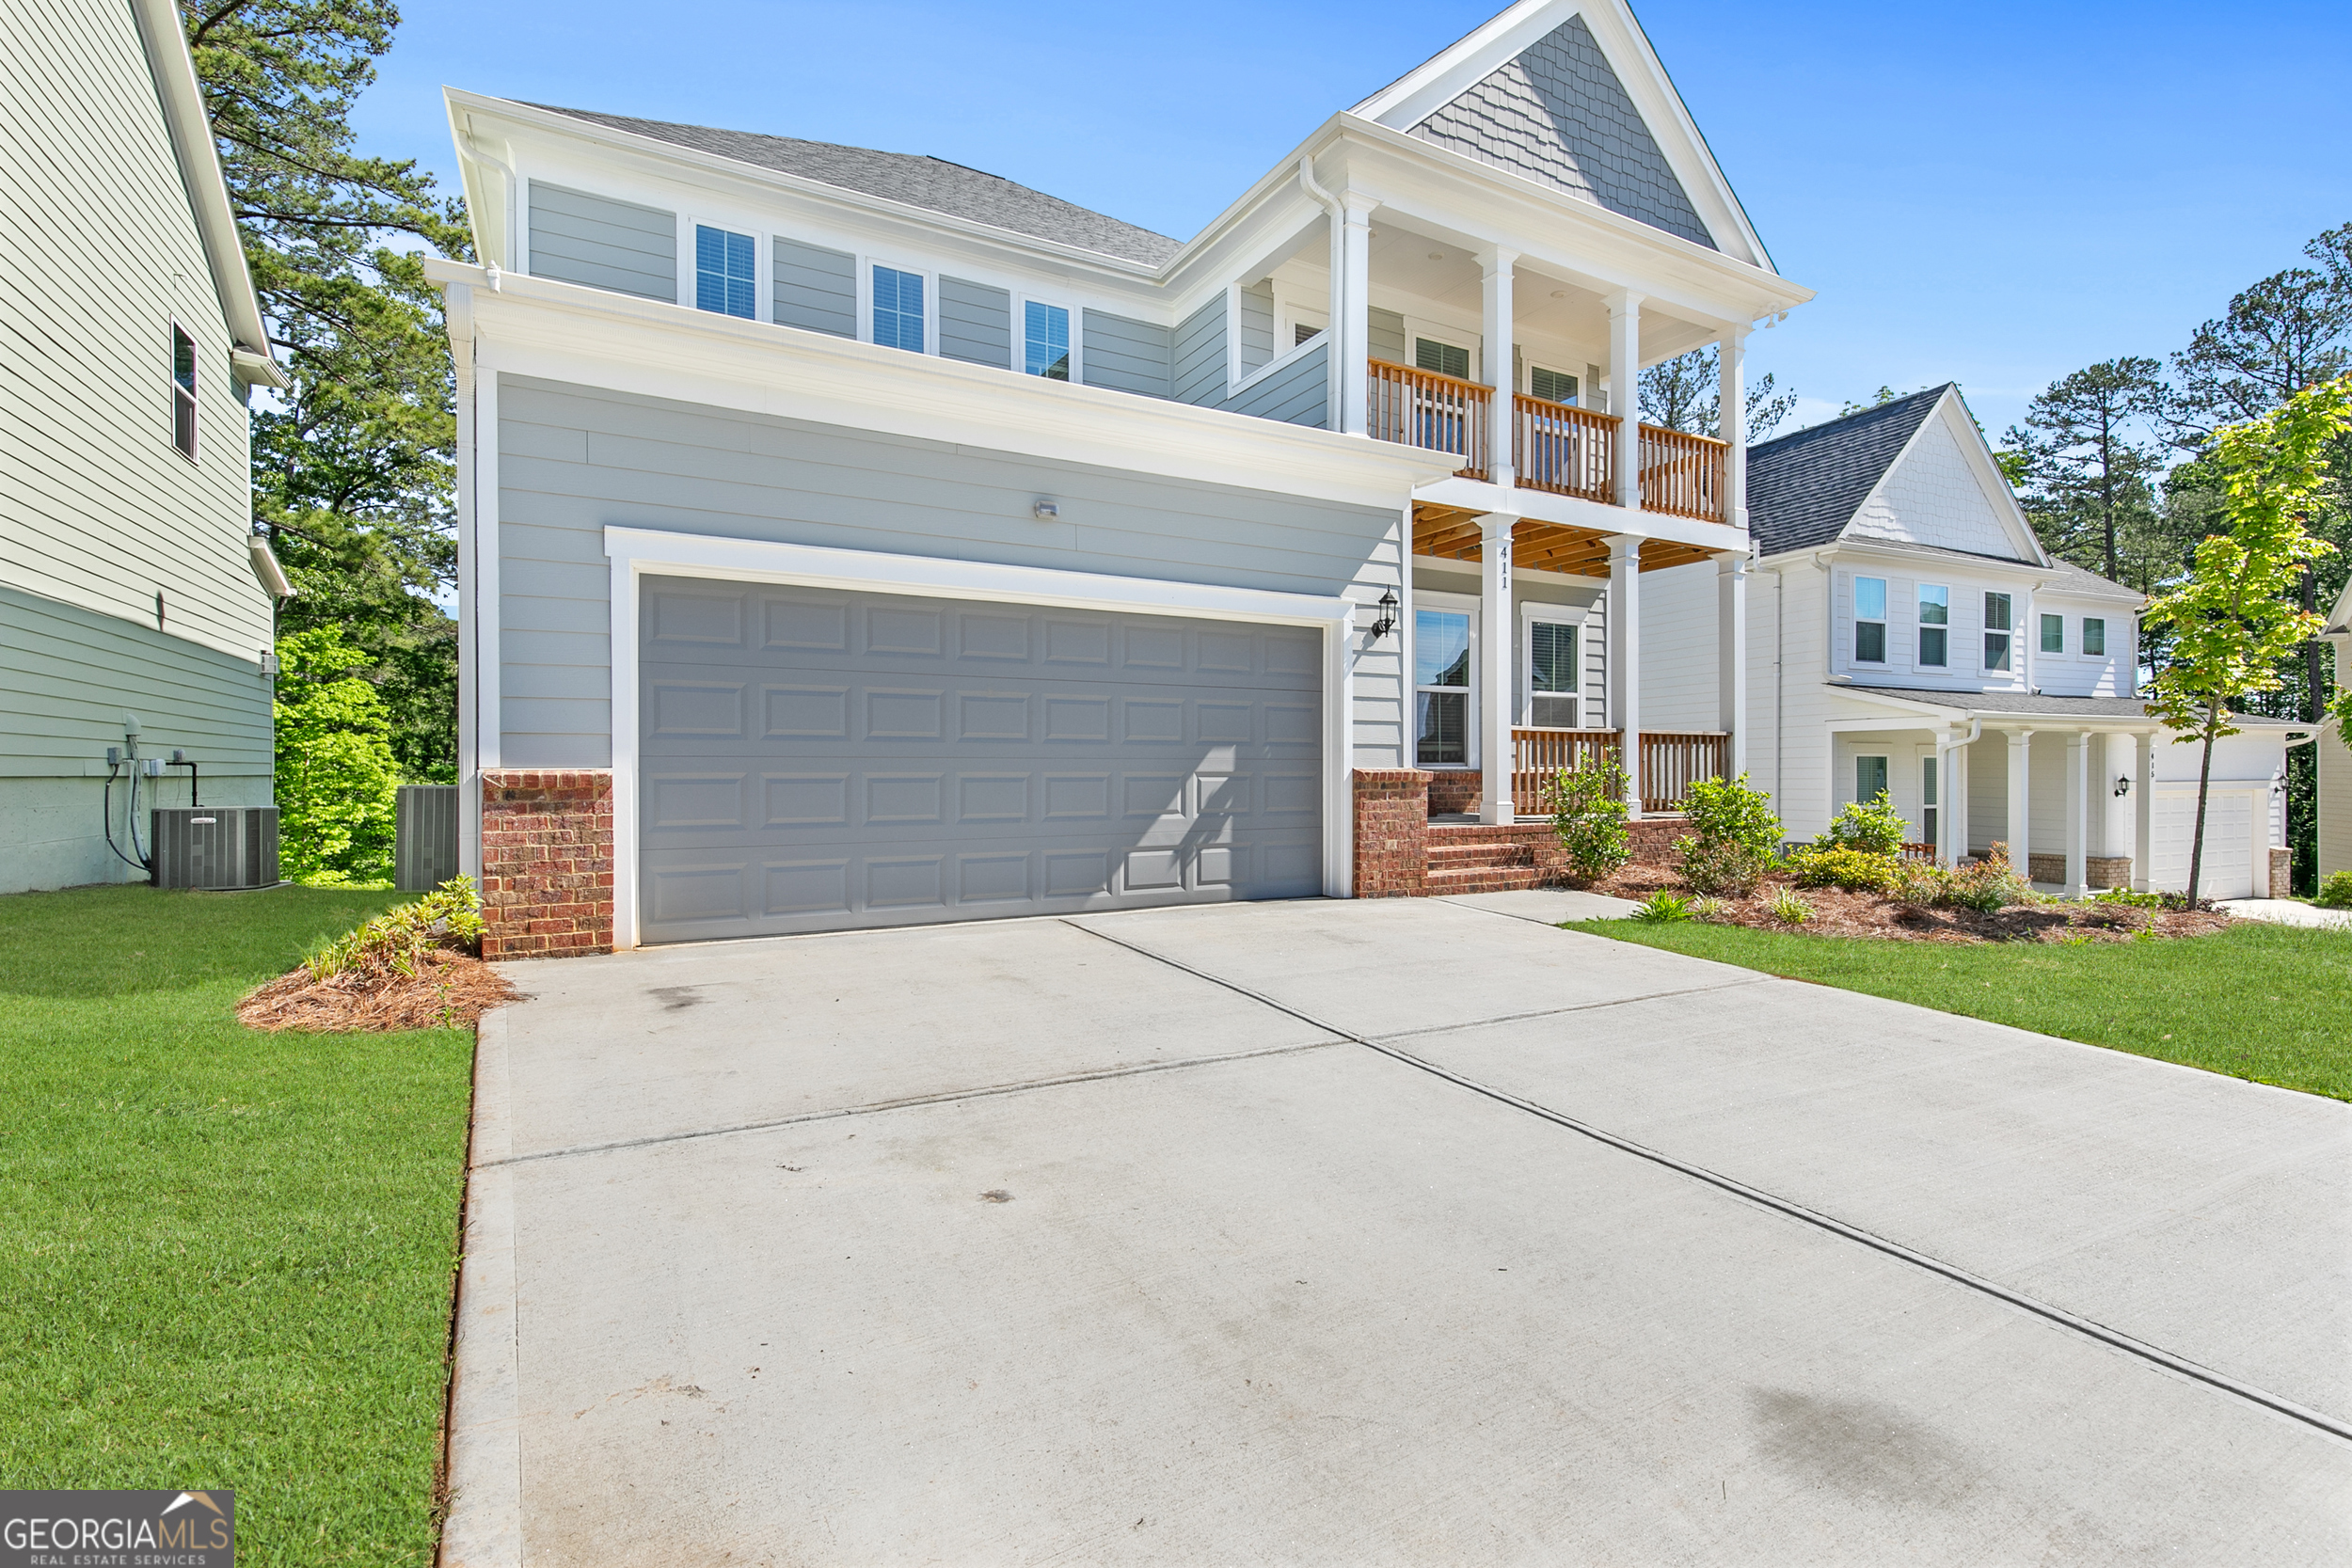
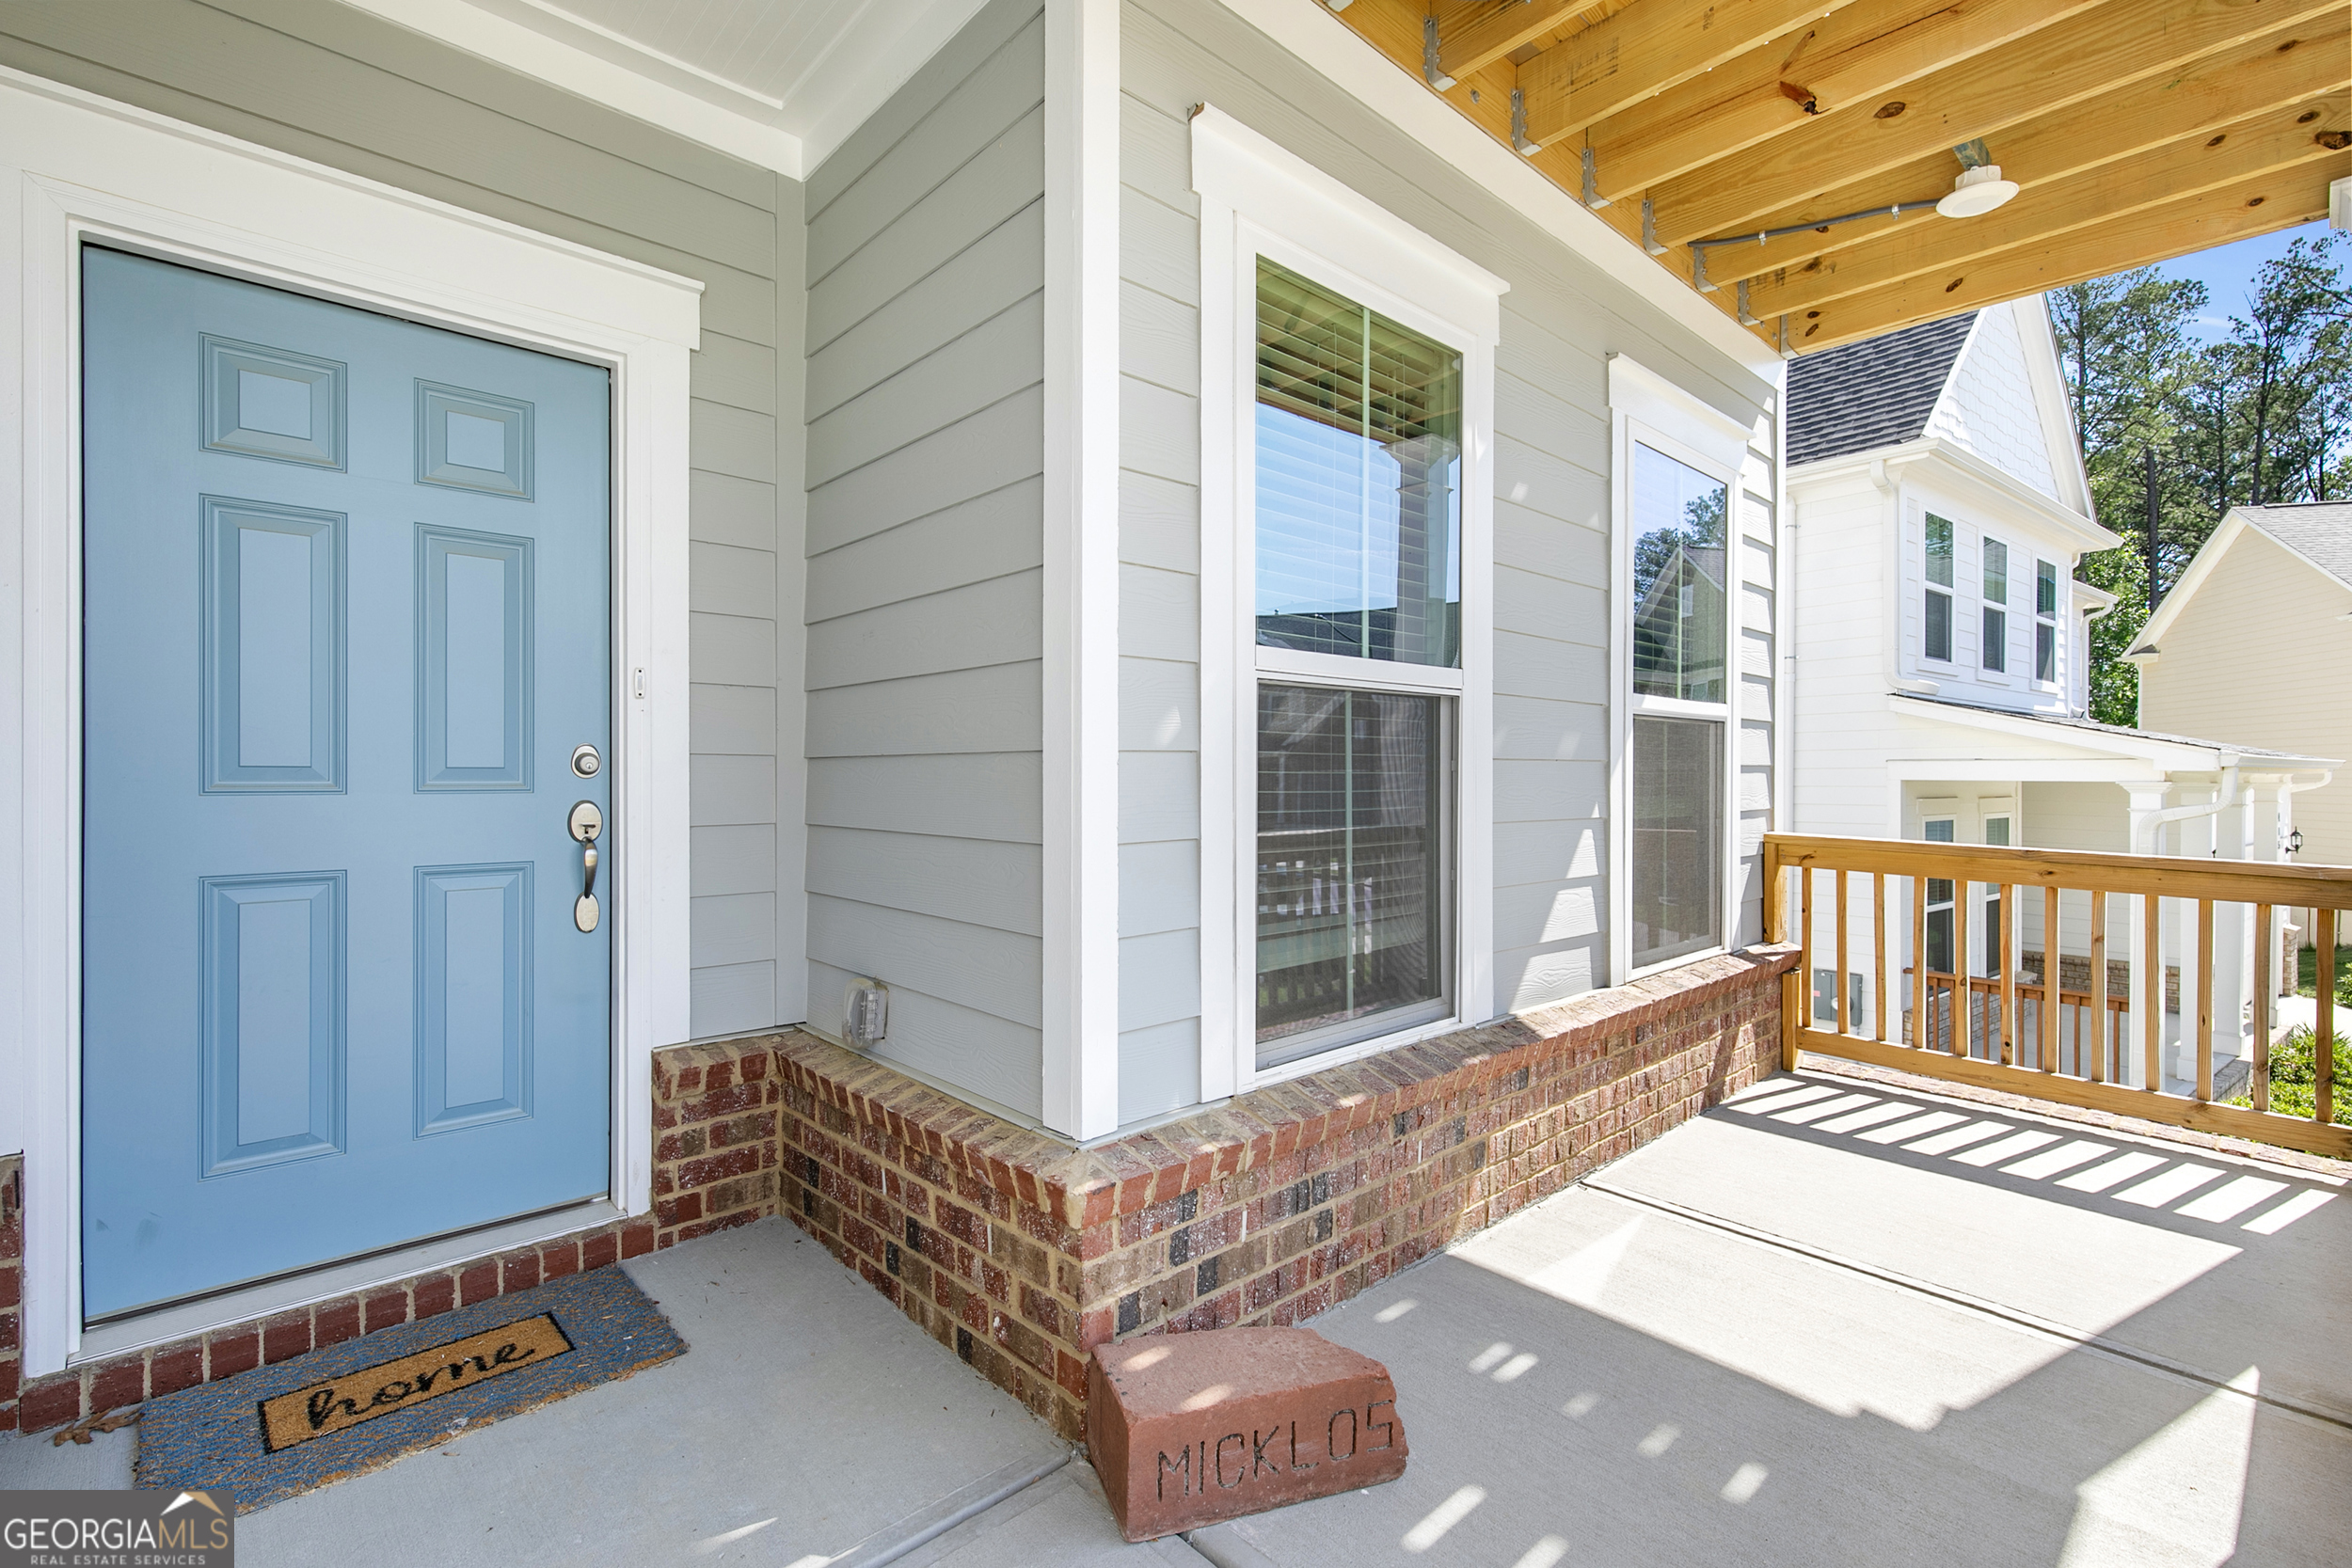
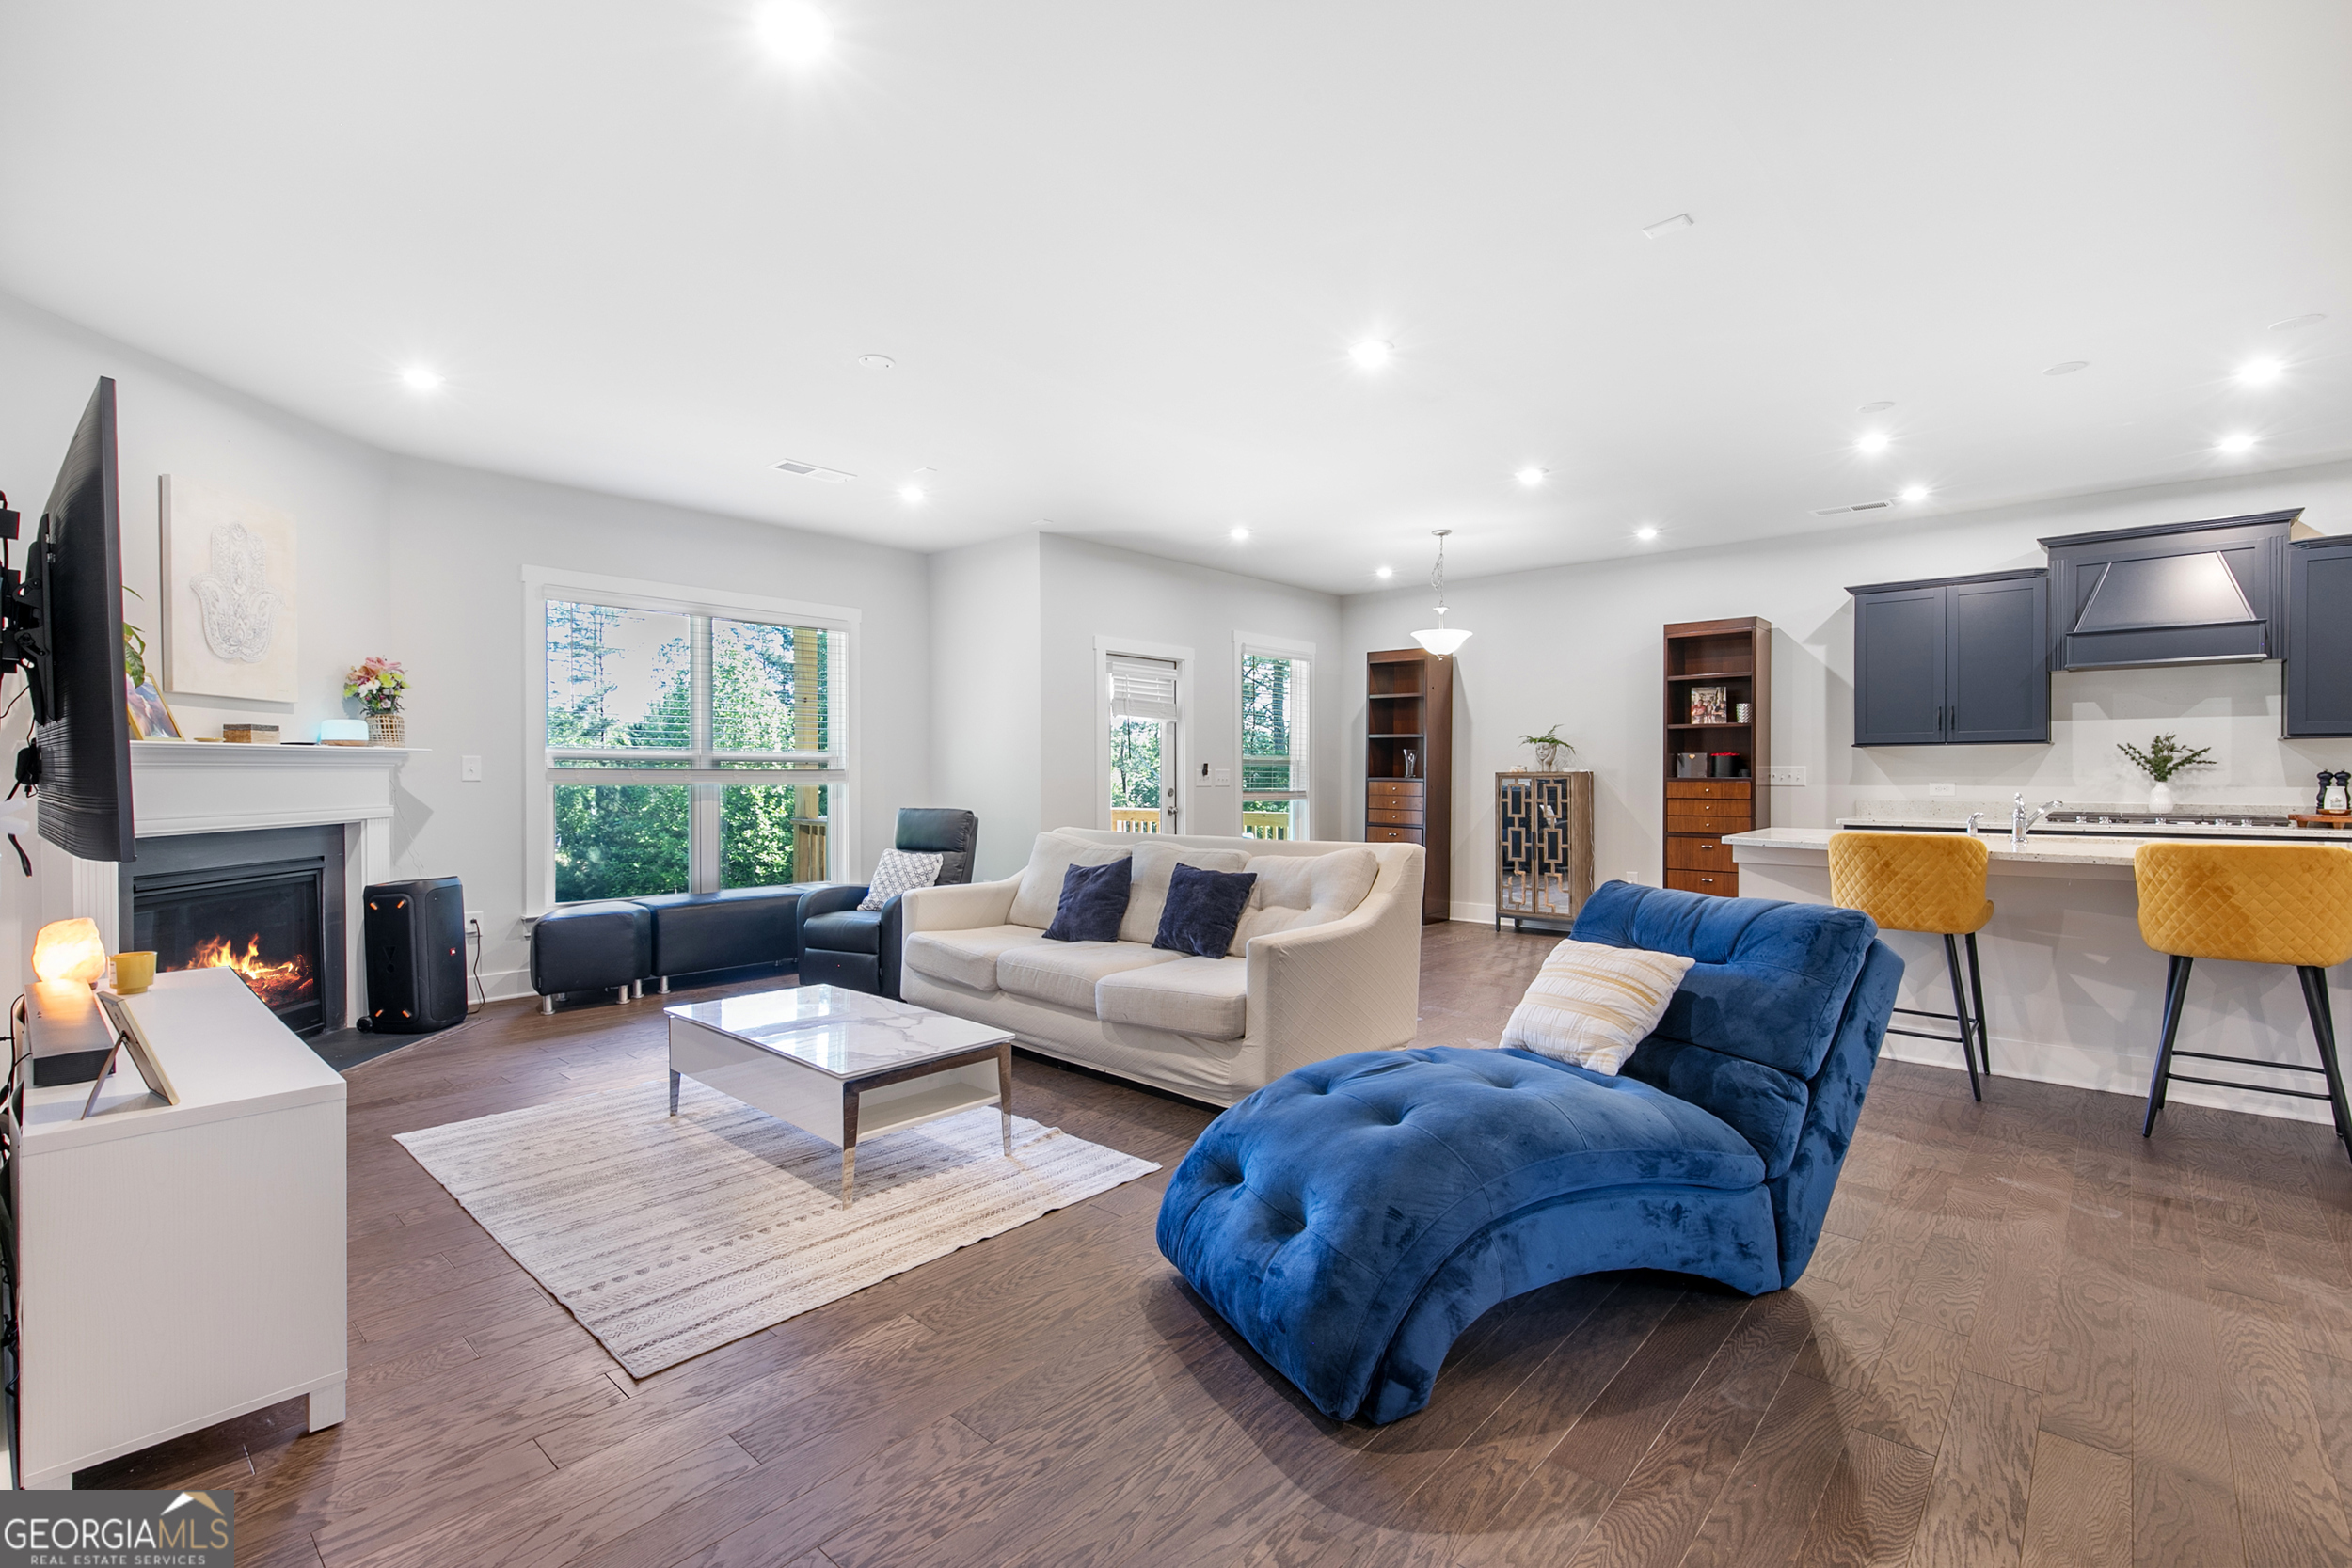
Experience unparalleled luxury and meticulous craftsmanship in this exquisite Craftsman-style residence, a masterpiece built in 2024 and situated on an exclusive lot within the prestigious Creek at Arthur Hills community. Boasting 5 bedrooms and 5 baths, this home is a sanctuary of tranquility, backing onto a serene treeline and a private pond with water views from your home, offering both seclusion and convenience mere minutes from top-tier amenities in the Cedarcrest community and just minutes to Lake Allatoona and the highly sought after LakePoint Sports Complex. From the inviting covered front porch to the dual balconies and expansive covered lanai, every outdoor space is designed for relaxation and entertaining with views to make you feel like you are resort living. Step inside to discover a sunlit, open-concept floor plan enriched by extensive builder and owner upgrades, including a 4-foot living room extension, garage extension, and extended driveway for enhanced curb appeal. The gourmet kitchen is a focal point, showcasing upgraded solid wood cabinetry with soft-close features, upgraded granite countertops, a sizable island, and top-of-the-line KitchenAid appliances. You will love the built in wastebasket and the upgraded hood vent that creates a masterpiece Chef's kitchen. Adjacent, the family room features a cozy gas fireplace and is equipped with in house speaker wiring ready for your entertainment dreams extending seamlessly to the lanai and owner's suite for ideal music symmetry throughout. Upstairs, the owner's retreat offers a private sitting area, elegant tray ceilings, and a spa-inspired ensuite with premium finishes and a wonderful rainshower. A main-level guest suite with a full bath ensures comfort for visitors or multi-generational living.Additional interior highlights include rich hardwood floors, Craftsman-style stair accents with wood treads, upgraded recessed lighting, advanced Ethernet and WiFi capabilities, pre-wired speaker locations, and a full unfinished basement awaiting personalized touches that you can walk out to the backyard and fish in your pond. Outside, the fully epoxied garage includes amenities like a dedicated outlet for additional refrigeration, while a professional irrigation system simplifies lawn maintenance. Community perks such as a pool, playground, and cabana enhance the resort-style living experience. This isn't just a home; it's a lifestyle upgrade, distinguished by over $200,000 in builder upgrades, making it a true standout in the neighborhood. Discover unparalleled comfort and luxury in this one-of-a-kind residence, where every detail reflects a commitment to superior quality and design. Level driveway with 1 step into the home and a perfect cul-de-sac lot. Top rated schools in a highly sought after area offering plenty of shopping, dining and supermarkets. Home is also for rent for $3,000.00
Build Your Team
Quickly find investor-friendly professionals who can help you succeed in real estate investing at any stage of the investing journey.


Agents
Match with investor-friendly agents who can help you find, analyze, and close your next deal


Lenders
Get the best funding…find investor-friendly lenders who specialize in your deal strategy


Property Managers
Transition to passive investing. Find a trusted property management partnership that lasts.


Tax Pros & Accountants
Taxes and financial reporting made easy—find experts to create tax savings strategies, file taxes, and more
Location
Property Details
Parking
- Description: Garage Door Opener, Attached, Garage
- Details: Attached, Garage, Garage Door Opener
- Garage Spaces: 2
- Spaces Total: 2
Bedroom Information
- # of Bedrooms: 5
Bathroom Information
- # of Baths (Full): 5
- # of Baths (Total): 0.0
Interior Features
- # of Stories: 2
- Basement: Yes
- Basement Description: Bath/Stubbed, Exterior Entry, Interior Entry
- Fireplace: Yes
Exterior Features
- Exterior Walls Materials: Fiber cement siding (Hardi-board/Hardi-plank
- Foundation: Slab
- Roof Type: Gable or Hip
- Roof Material: Composition
HOA
- Has HOA: Yes
- Association: CMA Communities
- HOA Fee: $725/annually
Land Information
- Land Use: Residential
- Land Use Subtype: Single Family Residential
Lot Information
- Parcel ID: 031.3.4.079.0000
- Lot Size: 0 sqft
Property Information
- Property Type: Single Family Residence
- Style: Brick 3 Side, Craftsman
- Year Built: 2023
Tax Information
- Annual Tax: $1,797
Utilities
- Water & Sewer: Public
- Heating: Central, Natural Gas
- Cooling: Central Air
Location
- County: Paulding
Investment Summary
- Monthly Cash Flow
- -$1,406
- Cap Rate
- 3.7%
- Cash-on-Cash Return
- -11.3%
- Debt Coverage Ratio
- 0.59
- Internal Rate of Return (5 years)
- -6.9%
Cash Flow
Net Operating Income (NOI) minus mortgage payments.
Calculation:
NOI - Mortgage Payments
Cap Rate (Market Value)
Capitalization Rate is a rate of return that compares the yearly Net Operating Income (NOI) to the market value.
Calculation:
NOI / Market Value
Cash-on-Cash Return (CoC)
Annual Cash Flow / Cash Invested
Calculation:
Annual cash flow divided by initial cash invested.
Debt Coverage Ratio (DCR)
Net Operating Income (NOI) divided by total debt payments.
Calculation:
NOI / Total Debt Payments
Internal Rate of Return (IRR)
A metric for assessing profitability over time. IRR is the discount rate at which the net present value (NPV) of all future cash flows (positive and negative) from an investment equals zero — including both periodic cash flow (such as rent) and a projected sale at the end of the holding period. It represents the expected annualized return, accounting for income, expenses, and the recovery of capital through a future sale.
Purchase Details
Purchase PriceThe price paid for the property. Purchase price:
| $650,000 |
|---|---|
Amount FinancedThe amount of the purchase financed through a loan. Amount financed:
| -$520,000 |
Down paymentThe initial payment made towards the purchase. Down payment:
| $130,000 |
Closing CostsFees and expenses associated with purchasing a property, typically ranging from 2% to 5% of the home’s purchase price, paid at the end of a home purchase to cover services like lending, title transfer, and taxes. Closing costs:
| $19,500 |
Rehab CostsCosts incurred to repair or improve the property, including: roof, flooring, exterior siding, kitchen, exterior paint, bathrooms, etc. Rehab costs:
| $0 |
Initial Cash InvestedThe total initial cash invested in the property. Calculation:Down payment + Buying costs + Rehab costs Initial cash invested:
| $149,500 |
Square Feet (SQFT)The total square footage of the property. Square feet:
| 3,180 |
Cost Per Square FootCost per square foot of the property. Calculation:Purchase Price / Square Feet Cost per square foot:
| $204 |
Monthly Rent Per Square FootMonthly rent divided by the number of square feet. This ratio helps investors compare rental income efficiency across properties, markets, and unit sizes Calculation:Monthly Rent / Square Feet Monthly rent per square foot:
| $1.01 |
Financing Details
Loan AmountThe total sum of money borrowed from a lender to finance a property purchase. Calculation:Purchase Price - Down Payment
Loan amount:
| $520,000 |
|---|---|
Loan to Value Ratio (LTV)Loan amount divided by the market value of the property. Calculation:Loan Amount / Market Value
Loan to value ratio:
| 80.0% |
Loan TypeThe type of loan (e.g., fixed, adjustable).
Loan type:
| Amortizing |
TermThe loan repayment period in years.
Term:
| 30 years |
Interest RateThe percentage a lender charges on the borrowed amount of a loan, determining the cost of borrowing money.
Interest rate:
| 6.840% |
Principal & Interest (PI)The principal is the portion of the loan payment that reduces the loan balance. The interest is the lender's charge for borrowing money. Calculation:(P * r * (1 + r) ** n) / ((1 + r) ** n - 1) Where:
P = Loan amount (principal)
Principal & interest:
| $3,404 |
Property TaxesAnnual taxes levied by local governments on real estate properties. These taxes fund public services like schools, roads, and emergency services.
Property tax:
| $150 |
InsuranceThe costs for insurance coverage to protect against financial losses due to risks like fire, natural disasters, theft, liability, or tenant-related damages. Calculation:Assumes 7% of gross rental income, unless insurance rates are specified.
Insurance:
| $224 |
Private Mortgage Insurance (PMI)A fee that borrowers pay when they take out a conventional loan with a loan-to-value (LTV) ratio above 80%.
Private mortgage insurance (PMI):
| $0 |
Monthly PaymentThe fixed amount a borrower pays each month to repay a loan. It typically includes principal and interest (P&I) and may also cover property taxes, insurance, HOA fees, and PMI if escrowed. Monthly payment:
| $3,778 |
Operating Income
| % Rent | Monthly | Yearly | |
|---|---|---|---|
Gross RentThe total rental income received from tenants before deducting any expenses. Includes base rent, late fees, pet fees, parking fees, and other recurring charges.
Gross rent:
| $3,200 | $38,400 | |
Vacancy LossExpected loss of rent due to vacancies.
Vacancy loss:
(6%)
| 6% | -$192 | -$2,304 |
Operating IncomeGross rental income minus vacancy loss. Calculation:Gross rent - Vacancy loss
Operating income:
| $3,008 | $36,096 |
Operating Expenses
| % Rent | Monthly | Yearly | |
|---|---|---|---|
Property TaxesAnnual taxes levied by local governments on real estate properties. These taxes fund public services like schools, roads, and emergency services. | 5% | -$150 | -$1,797 |
InsuranceThe costs for insurance coverage to protect against financial losses due to risks like fire, natural disasters, theft, liability, or tenant-related damages. Calculation:Assumes 7% of gross rental income, unless insurance rates are specified. | 7% | -$224 | -$2,688 |
Property ManagementThe costs associated with hiring a property manager to handle the day-to-day operations of a rental property. Includes management fees, leasing fes, eviction fees, etc. Calculation:Assumes 8% of gross rental income. | 8% | -$256 | -$3,072 |
Repairs & MaintenanceOngoing costs for routine upkeep and minor fixes needed to keep a property in good working condition. Calculation:Assumes 5% of gross rental income. Varies by property age and condition. | 5% | -$160 | -$1,920 |
Capital ExpensesLarge, infrequent costs for major improvements or replacements, like a new roof, HVAC system, or appliances. Calculation:Assumes 5% of gross rental income. Varies by property age. | 5% | -$160 | -$1,920 |
HOA FeesRegular dues paid to a Homeowners Association for community maintenance, amenities, and management. Similar fees include: Condo Association Fees, Co-op Maintenance Fees, etc. | 2% | -$60 | -$720 |
Operating ExpensesRecurring costs required to maintain and manage a rental property, including property taxes, insurance, maintenance, repairs, utilities (if paid by the owner), property management fees, and other day-to-day expenses. Calculation:Insurance + Property Taxes + Property Management + Repairs & Maintenance + Capital Expenditures + HOA Fees | 32% | -$1,010 | -$12,117 |
Cash Flow
| Monthly | Yearly | |
|---|---|---|
Net Operating Income (NOI)The income generated from a property after deducting all operating expenses but before deducting mortgage payments, taxes, and capital expenditures. Calculation:Gross Operating Income - Operating Expenses
Net operating income:
| $1,998 | $23,976 |
Mortgage PaymentThe fixed amount a borrower pays each month to repay a loan. It typically includes principal and interest (P&I) and may also cover property taxes, insurance, HOA fees, and PMI if escrowed. | -$3,404 | -$40,848 |
Cash FlowNet Operating Income (NOI) minus mortgage payments. Calculation:NOI - Mortgage Payments | $1,406 | $16,872 |