$699,000
Investment Summary
- Monthly Cash Flow
- -$2,840
- Cap Rate
- 1.4%
- Cash-on-Cash Return
- -21.2%
- Debt Coverage Ratio
- 0.22
- Internal Rate of Return (5 years)
- -16.5%
Cash Flow
Net Operating Income (NOI) minus mortgage payments.
Calculation:
NOI - Mortgage Payments
Cap Rate (Market Value)
Capitalization Rate is a rate of return that compares the yearly Net Operating Income (NOI) to the market value.
Calculation:
NOI / Market Value
Cash-on-Cash Return (CoC)
Annual Cash Flow / Cash Invested
Calculation:
Annual cash flow divided by initial cash invested.
Debt Coverage Ratio (DCR)
Net Operating Income (NOI) divided by total debt payments.
Calculation:
NOI / Total Debt Payments
Internal Rate of Return (IRR)
A metric for assessing profitability over time. IRR is the discount rate at which the net present value (NPV) of all future cash flows (positive and negative) from an investment equals zero — including both periodic cash flow (such as rent) and a projected sale at the end of the holding period. It represents the expected annualized return, accounting for income, expenses, and the recovery of capital through a future sale.
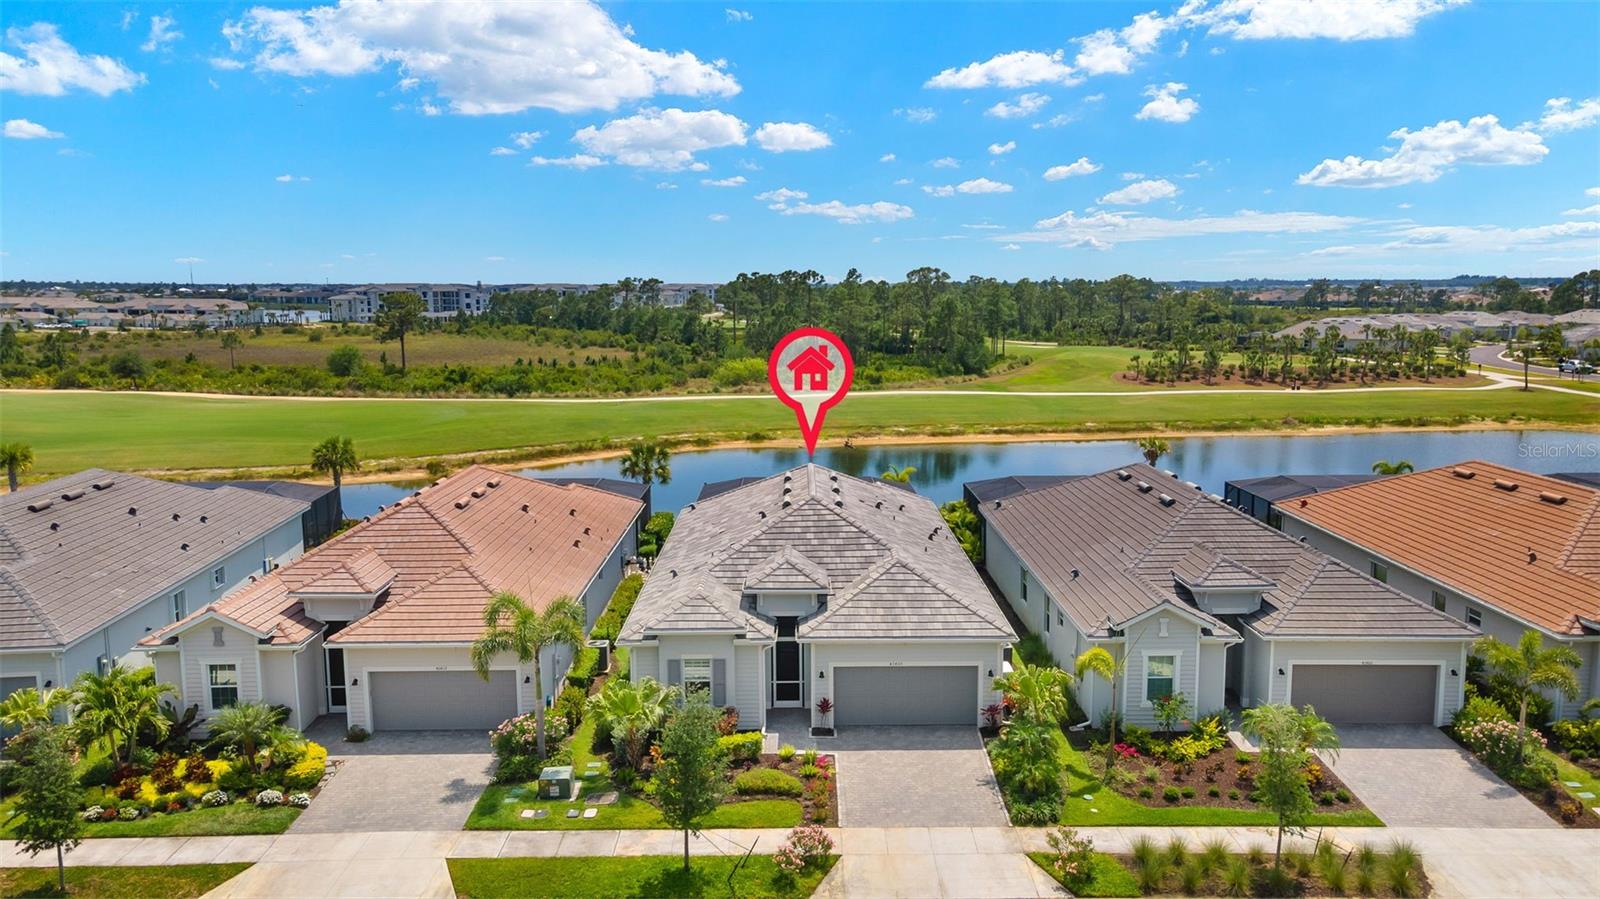
Property Description
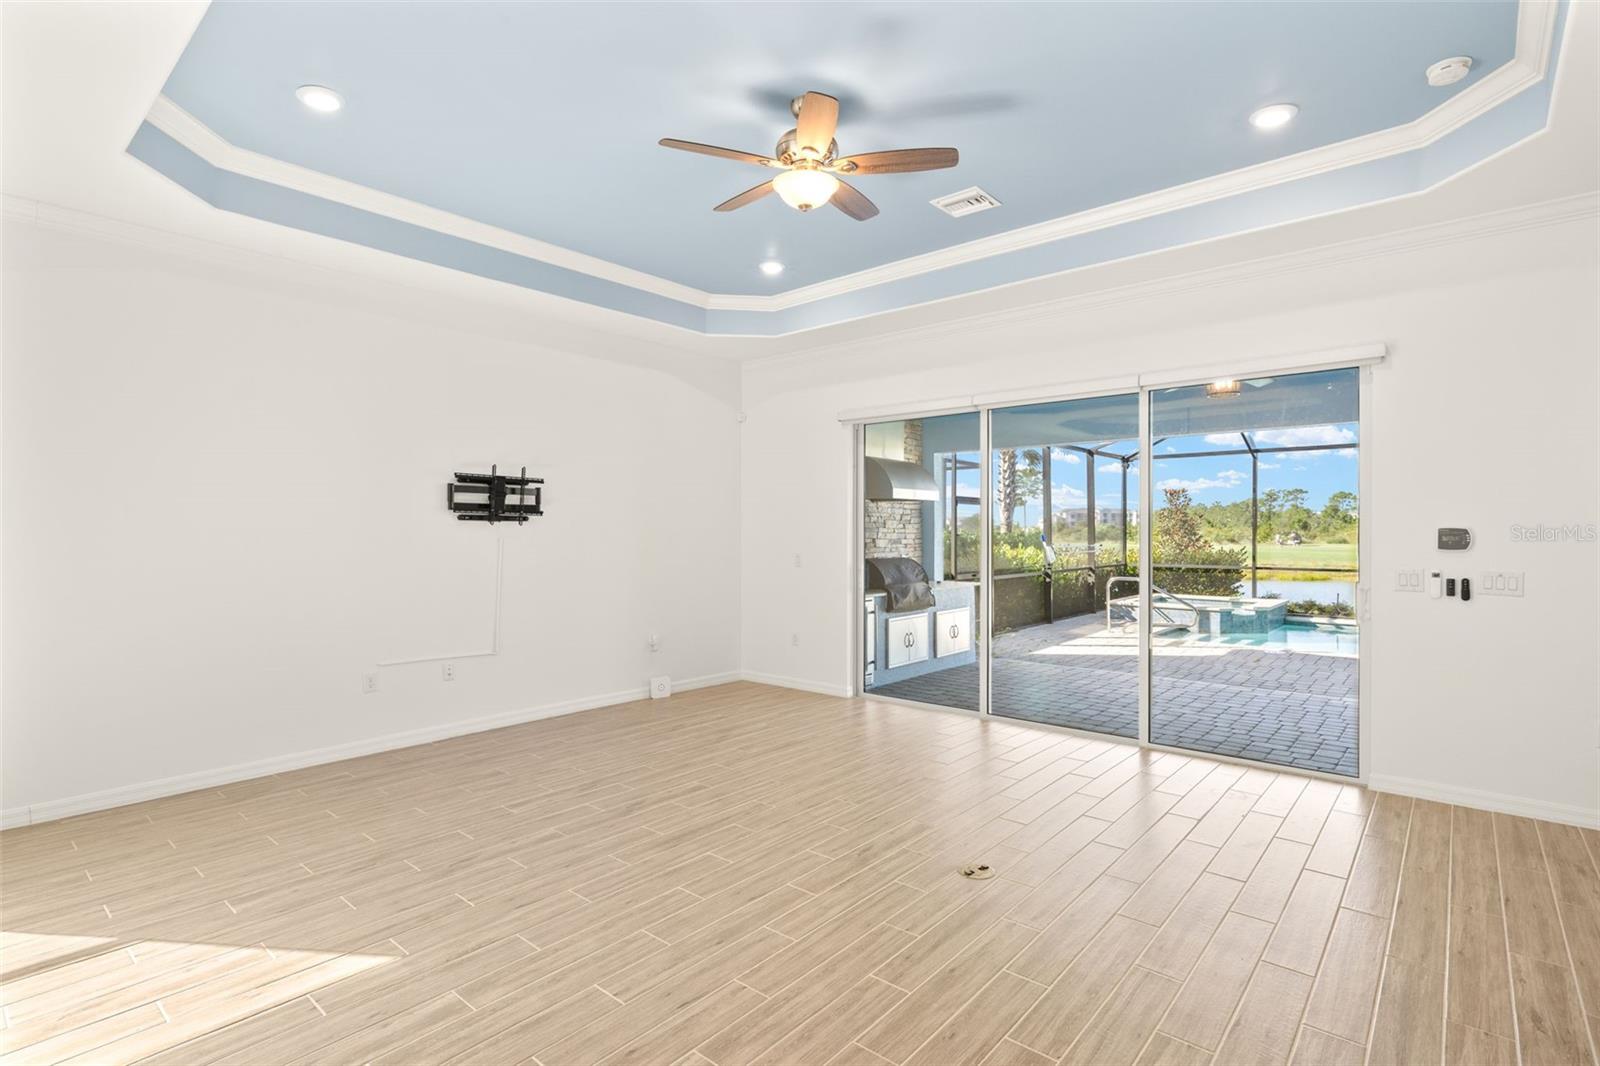
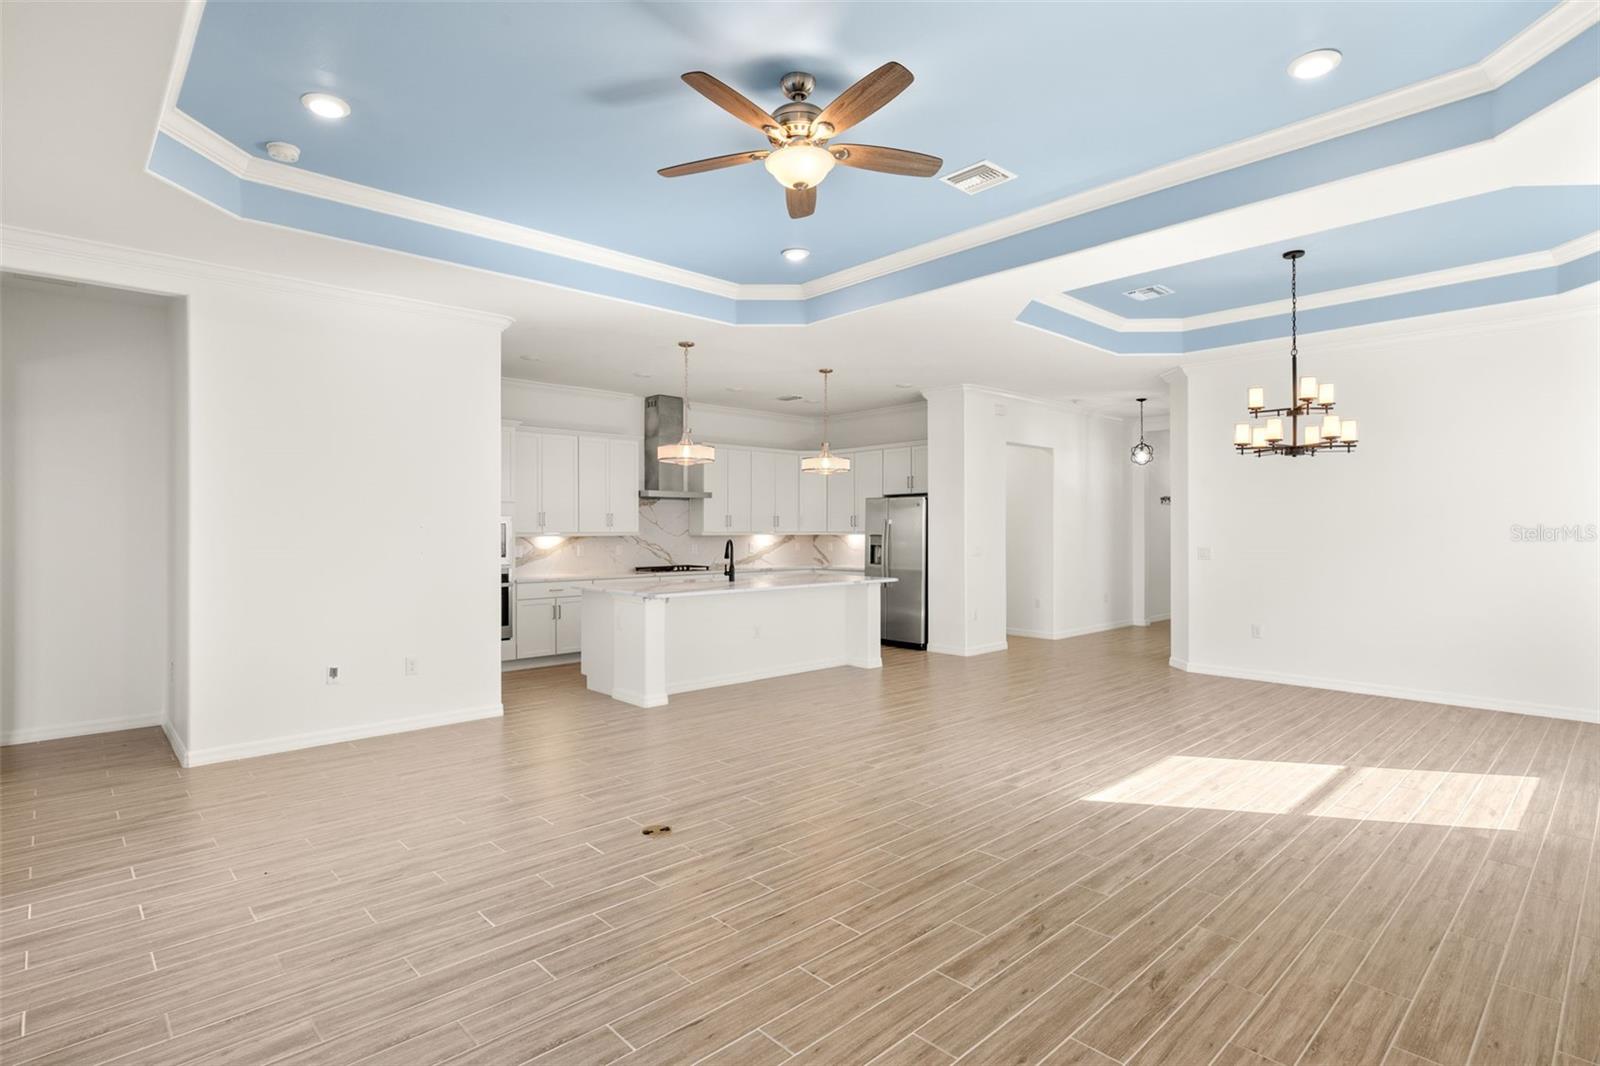
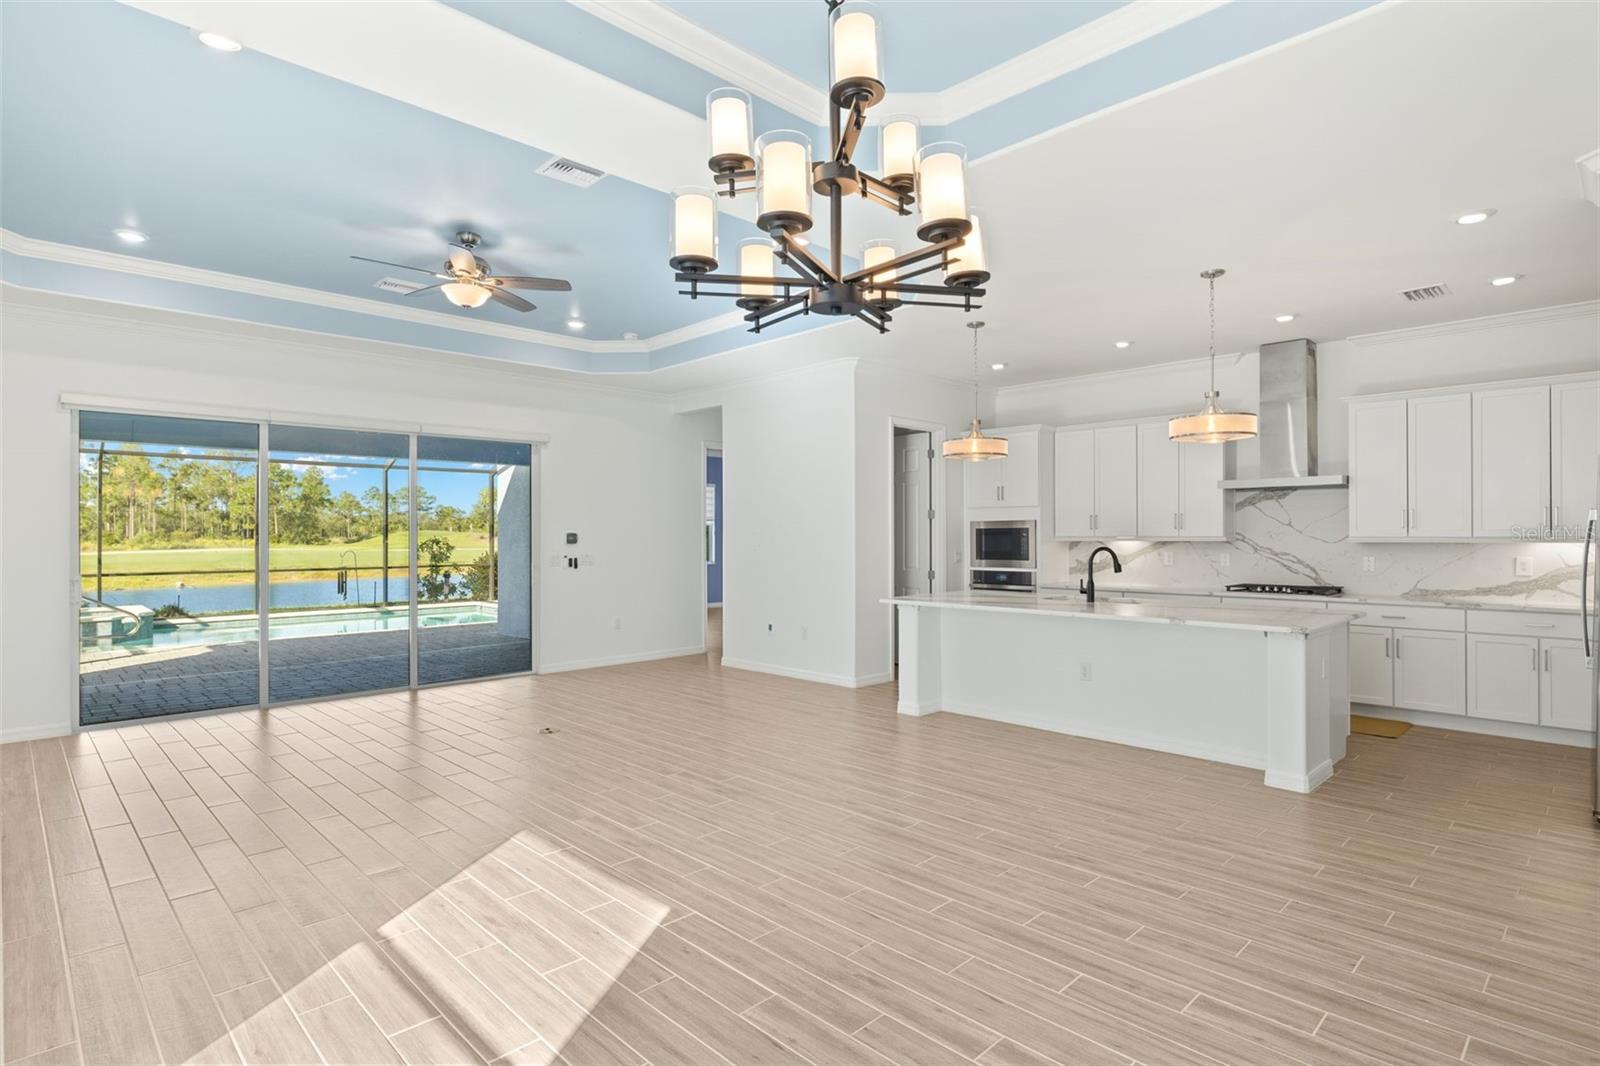
Interior living spaces JUST REPAINTED in June!! Now's the time for you to secure this amazing home as the seller is willing to listen to offers and negotiate! Here is your opportunity to embrace year-round golf because this single-family home has the GOLF MEMBERSHIP INCLUDED! This is the 'Calusa' floor plan. With this layout, you have 3 spacious bedrooms, a re-designed den, 3 bathrooms, 2,245 sq ft of indoor living space and a 2-car garage with updated epoxy flooring. First thing you might notice pulling up to this home is the attractive Curb Appeal. Yardwork at this home is done by Owl Creek Landscaping. Walking in past your screened in entry and through your foyer, you'll notice an open, inviting living room adjacent to a beautifully designed kitchen. That kitchen has everything from upgraded custom quartz countertops with an oversized island, upgraded custom backsplash, a new 3/4 hp disposal, a walk-in pantry upgraded by Closets by Design, and stainless steel appliances. Right around the corner from your kitchen and living area is your primary bedroom. Features in there include a bathroom with a tiled, glass enclosed shower and dual sinks, 2 walk-in closets upgraded by Closets by Design, and sliding doors that lead out to your lanai. Step outside into your private oasis - Southern exposure with panoramic lake and golf course views. Views that can be enjoyed from your pool, spa and even indoor living room! Like to cook?? There's even an outdoor kitchen! Inside and on the opposite side of the home is where you will find the additional 2 bedrooms, den and 2 bathrooms - giving ample privacy to everybody residing. The closet in the den has been removed and woodwork was done around the perimeter of the room. Your laundry room was even updated by Closet by Design like the pantry and other 2 master closets were! Additional upgrades inside include crown molding and tile extended throughout, updated paint schemes, custom decor, a Generac whole hose generator (22kw), auto leveler blinds throughout and a hardwired security system. The work here is done and it's ready for you to move-in! Seller is also offering a credit towards an interior re-paint if the current colors are not your style! Just outside of your home and within the community, you have a wide assortment of amenities at your fingertips. There's the 18-hole championship golf course, resort-style pool with lap lanes & a spa, tiki bar, pickleball & bocce courts, a state-of-the-art fitness center, tennis center, a clubhouse w/ dining, and more. Not only that but Founder’s Square within Babcock Ranch, hosts food trucks every weekend with entertainment, markets, music, etc. Living at Babcock means more than just residing—it's a vibrant lifestyle. Your neighbors are waiting! Come check out what the Babcock lifestyle is all about!
Build Your Team
Quickly find investor-friendly professionals who can help you succeed in real estate investing at any stage of the investing journey.


Agents
Match with investor-friendly agents who can help you find, analyze, and close your next deal


Lenders
Get the best funding…find investor-friendly lenders who specialize in your deal strategy


Property Managers
Transition to passive investing. Find a trusted property management partnership that lasts.


Tax Pros & Accountants
Taxes and financial reporting made easy—find experts to create tax savings strategies, file taxes, and more
Location
Property Details
Parking
- Details: Driveway, Garage Door Opener, Attached
- Garage Spaces: 2
- Spaces Total: 0
Bedroom Information
- # of Bedrooms: 4
Bathroom Information
- # of Baths (Full): 3
- # of Baths (Total): 3.0
Interior Features
- # of Rooms: 6
- # of Stories: 1
Exterior Features
- Foundation: Block, Slab
- Roof Material: Tile
- Pool: Yes
HOA
- Has HOA: Yes
- Association: Icon Management
- HOA Fee: $423/quarterly
- Additional Association: Icon Management
- Additional HOA Fee: $884/quarterly
Land Information
- Land Use: Residential
- Land Use Subtype: Single Family Residential
Lot Information
- Parcel ID: 422620116009
- Lot Size: 7279 sqft
Property Information
- Property Type: Single Family Residence
- Style: Florida, Ranch
- Year Built: 2022
Tax Information
- Annual Tax: $11,556
Utilities
- Water & Sewer: Public
- Heating: Central, Electric
- Cooling: Central Air
Location
- County: Charlotte
Listing Details
Investment Summary
- Monthly Cash Flow
- -$2,840
- Cap Rate
- 1.4%
- Cash-on-Cash Return
- -21.2%
- Debt Coverage Ratio
- 0.22
- Internal Rate of Return (5 years)
- -16.5%
Cash Flow
Net Operating Income (NOI) minus mortgage payments.
Calculation:
NOI - Mortgage Payments
Cap Rate (Market Value)
Capitalization Rate is a rate of return that compares the yearly Net Operating Income (NOI) to the market value.
Calculation:
NOI / Market Value
Cash-on-Cash Return (CoC)
Annual Cash Flow / Cash Invested
Calculation:
Annual cash flow divided by initial cash invested.
Debt Coverage Ratio (DCR)
Net Operating Income (NOI) divided by total debt payments.
Calculation:
NOI / Total Debt Payments
Internal Rate of Return (IRR)
A metric for assessing profitability over time. IRR is the discount rate at which the net present value (NPV) of all future cash flows (positive and negative) from an investment equals zero — including both periodic cash flow (such as rent) and a projected sale at the end of the holding period. It represents the expected annualized return, accounting for income, expenses, and the recovery of capital through a future sale.
Purchase Details
Purchase PriceThe price paid for the property. Purchase price:
| $699,000 |
|---|---|
Amount FinancedThe amount of the purchase financed through a loan. Amount financed:
| -$559,200 |
Down paymentThe initial payment made towards the purchase. Down payment:
| $139,800 |
Closing CostsFees and expenses associated with purchasing a property, typically ranging from 2% to 5% of the home’s purchase price, paid at the end of a home purchase to cover services like lending, title transfer, and taxes. Closing costs:
| $20,970 |
Rehab CostsCosts incurred to repair or improve the property, including: roof, flooring, exterior siding, kitchen, exterior paint, bathrooms, etc. Rehab costs:
| $0 |
Initial Cash InvestedThe total initial cash invested in the property. Calculation:Down payment + Buying costs + Rehab costs Initial cash invested:
| $160,770 |
Square Feet (SQFT)The total square footage of the property. Square feet:
| 2,245 |
Cost Per Square FootCost per square foot of the property. Calculation:Purchase Price / Square Feet Cost per square foot:
| $311 |
Monthly Rent Per Square FootMonthly rent divided by the number of square feet. This ratio helps investors compare rental income efficiency across properties, markets, and unit sizes Calculation:Monthly Rent / Square Feet Monthly rent per square foot:
| $1.43 |
Financing Details
Loan AmountThe total sum of money borrowed from a lender to finance a property purchase. Calculation:Purchase Price - Down Payment
Loan amount:
| $559,200 |
|---|---|
Loan to Value Ratio (LTV)Loan amount divided by the market value of the property. Calculation:Loan Amount / Market Value
Loan to value ratio:
| 80.0% |
Loan TypeThe type of loan (e.g., fixed, adjustable).
Loan type:
| Amortizing |
TermThe loan repayment period in years.
Term:
| 30 years |
Interest RateThe percentage a lender charges on the borrowed amount of a loan, determining the cost of borrowing money.
Interest rate:
| 6.810% |
Principal & Interest (PI)The principal is the portion of the loan payment that reduces the loan balance. The interest is the lender's charge for borrowing money. Calculation:(P * r * (1 + r) ** n) / ((1 + r) ** n - 1) Where:
P = Loan amount (principal)
Principal & interest:
| $3,649 |
Property TaxesAnnual taxes levied by local governments on real estate properties. These taxes fund public services like schools, roads, and emergency services.
Property tax:
| $963 |
InsuranceThe costs for insurance coverage to protect against financial losses due to risks like fire, natural disasters, theft, liability, or tenant-related damages. Calculation:Assumes 7% of gross rental income, unless insurance rates are specified.
Insurance:
| $224 |
Private Mortgage Insurance (PMI)A fee that borrowers pay when they take out a conventional loan with a loan-to-value (LTV) ratio above 80%.
Private mortgage insurance (PMI):
| $0 |
Monthly PaymentThe fixed amount a borrower pays each month to repay a loan. It typically includes principal and interest (P&I) and may also cover property taxes, insurance, HOA fees, and PMI if escrowed. Monthly payment:
| $4,836 |
Operating Income
| % Rent | Monthly | Yearly | |
|---|---|---|---|
Gross RentThe total rental income received from tenants before deducting any expenses. Includes base rent, late fees, pet fees, parking fees, and other recurring charges.
Gross rent:
| $3,200 | $38,400 | |
Vacancy LossExpected loss of rent due to vacancies.
Vacancy loss:
(6%)
| 6% | -$192 | -$2,304 |
Operating IncomeGross rental income minus vacancy loss. Calculation:Gross rent - Vacancy loss
Operating income:
| $3,008 | $36,096 |
Operating Expenses
| % Rent | Monthly | Yearly | |
|---|---|---|---|
Property TaxesAnnual taxes levied by local governments on real estate properties. These taxes fund public services like schools, roads, and emergency services. | 30% | -$963 | -$11,556 |
InsuranceThe costs for insurance coverage to protect against financial losses due to risks like fire, natural disasters, theft, liability, or tenant-related damages. Calculation:Assumes 7% of gross rental income, unless insurance rates are specified. | 7% | -$224 | -$2,688 |
Property ManagementThe costs associated with hiring a property manager to handle the day-to-day operations of a rental property. Includes management fees, leasing fes, eviction fees, etc. Calculation:Assumes 8% of gross rental income. | 8% | -$256 | -$3,072 |
Repairs & MaintenanceOngoing costs for routine upkeep and minor fixes needed to keep a property in good working condition. Calculation:Assumes 5% of gross rental income. Varies by property age and condition. | 5% | -$160 | -$1,920 |
Capital ExpensesLarge, infrequent costs for major improvements or replacements, like a new roof, HVAC system, or appliances. Calculation:Assumes 5% of gross rental income. Varies by property age. | 5% | -$160 | -$1,920 |
HOA FeesRegular dues paid to a Homeowners Association for community maintenance, amenities, and management. Similar fees include: Condo Association Fees, Co-op Maintenance Fees, etc. | 14% | -$436 | -$5,232 |
Operating ExpensesRecurring costs required to maintain and manage a rental property, including property taxes, insurance, maintenance, repairs, utilities (if paid by the owner), property management fees, and other day-to-day expenses. Calculation:Insurance + Property Taxes + Property Management + Repairs & Maintenance + Capital Expenditures + HOA Fees | 69% | -$2,199 | -$26,388 |
Cash Flow
| Monthly | Yearly | |
|---|---|---|
Net Operating Income (NOI)The income generated from a property after deducting all operating expenses but before deducting mortgage payments, taxes, and capital expenditures. Calculation:Gross Operating Income - Operating Expenses
Net operating income:
| $809 | $9,708 |
Mortgage PaymentThe fixed amount a borrower pays each month to repay a loan. It typically includes principal and interest (P&I) and may also cover property taxes, insurance, HOA fees, and PMI if escrowed. | -$3,649 | -$43,788 |
Cash FlowNet Operating Income (NOI) minus mortgage payments. Calculation:NOI - Mortgage Payments | $2,840 | $34,080 |