$695,000
Investment Summary
- Monthly Cash Flow
- -$988
- Cap Rate
- 4.6%
- Cash-on-Cash Return
- -7.4%
- Debt Coverage Ratio
- 0.73
- Internal Rate of Return (5 years)
- -3.2%
Cash Flow
Net Operating Income (NOI) minus mortgage payments.
Calculation:
NOI - Mortgage Payments
Cap Rate (Market Value)
Capitalization Rate is a rate of return that compares the yearly Net Operating Income (NOI) to the market value.
Calculation:
NOI / Market Value
Cash-on-Cash Return (CoC)
Annual Cash Flow / Cash Invested
Calculation:
Annual cash flow divided by initial cash invested.
Debt Coverage Ratio (DCR)
Net Operating Income (NOI) divided by total debt payments.
Calculation:
NOI / Total Debt Payments
Internal Rate of Return (IRR)
A metric for assessing profitability over time. IRR is the discount rate at which the net present value (NPV) of all future cash flows (positive and negative) from an investment equals zero — including both periodic cash flow (such as rent) and a projected sale at the end of the holding period. It represents the expected annualized return, accounting for income, expenses, and the recovery of capital through a future sale.
Property Description
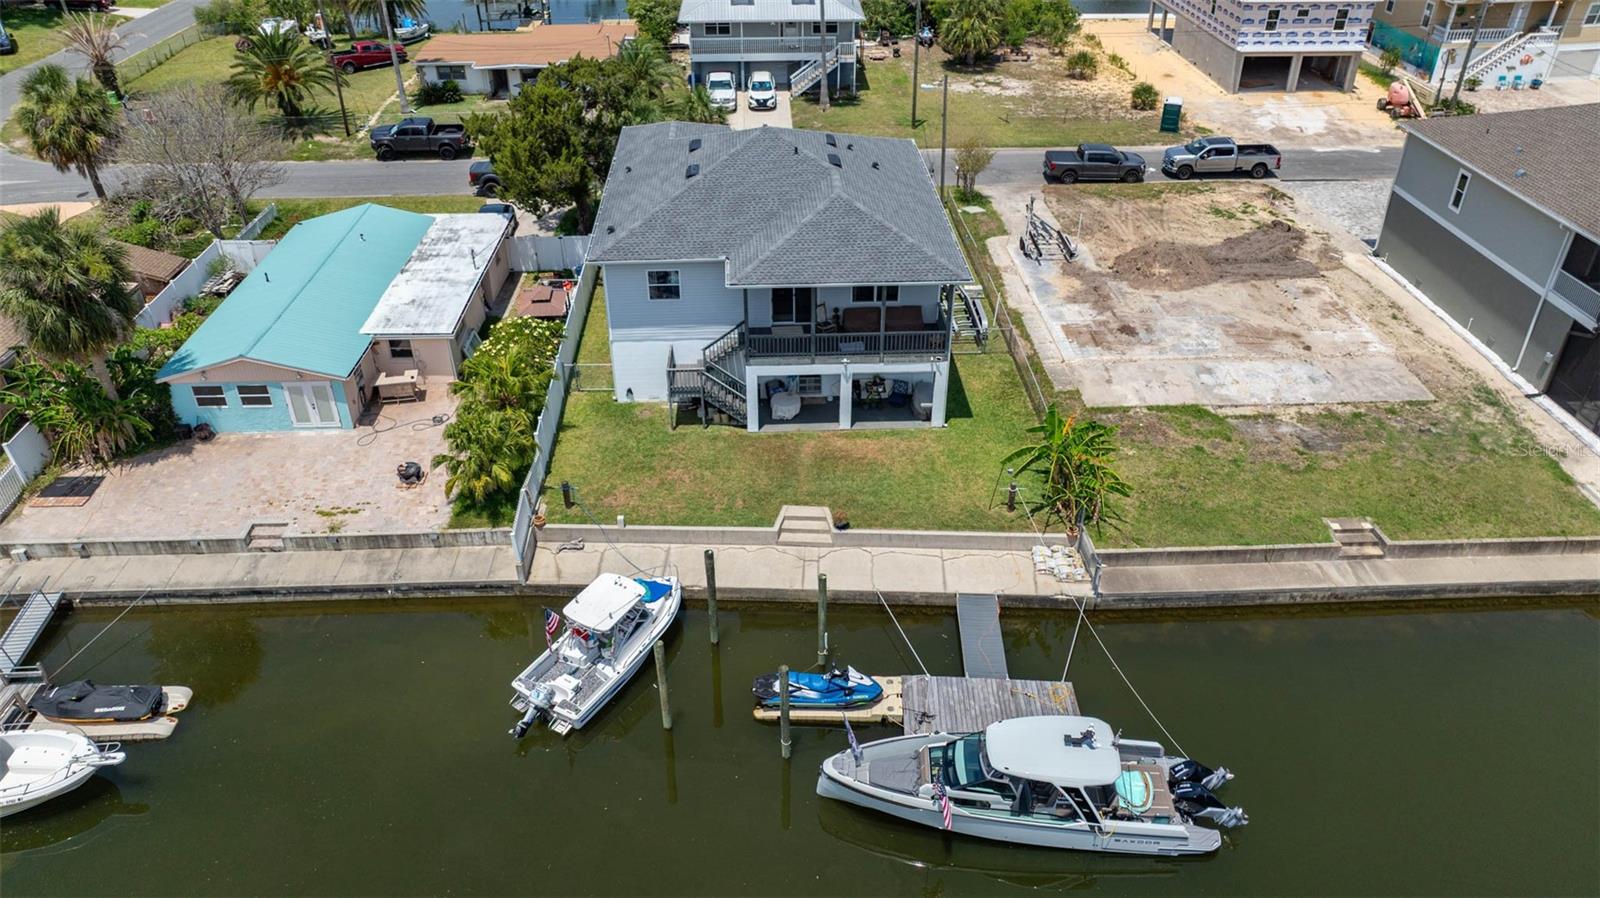
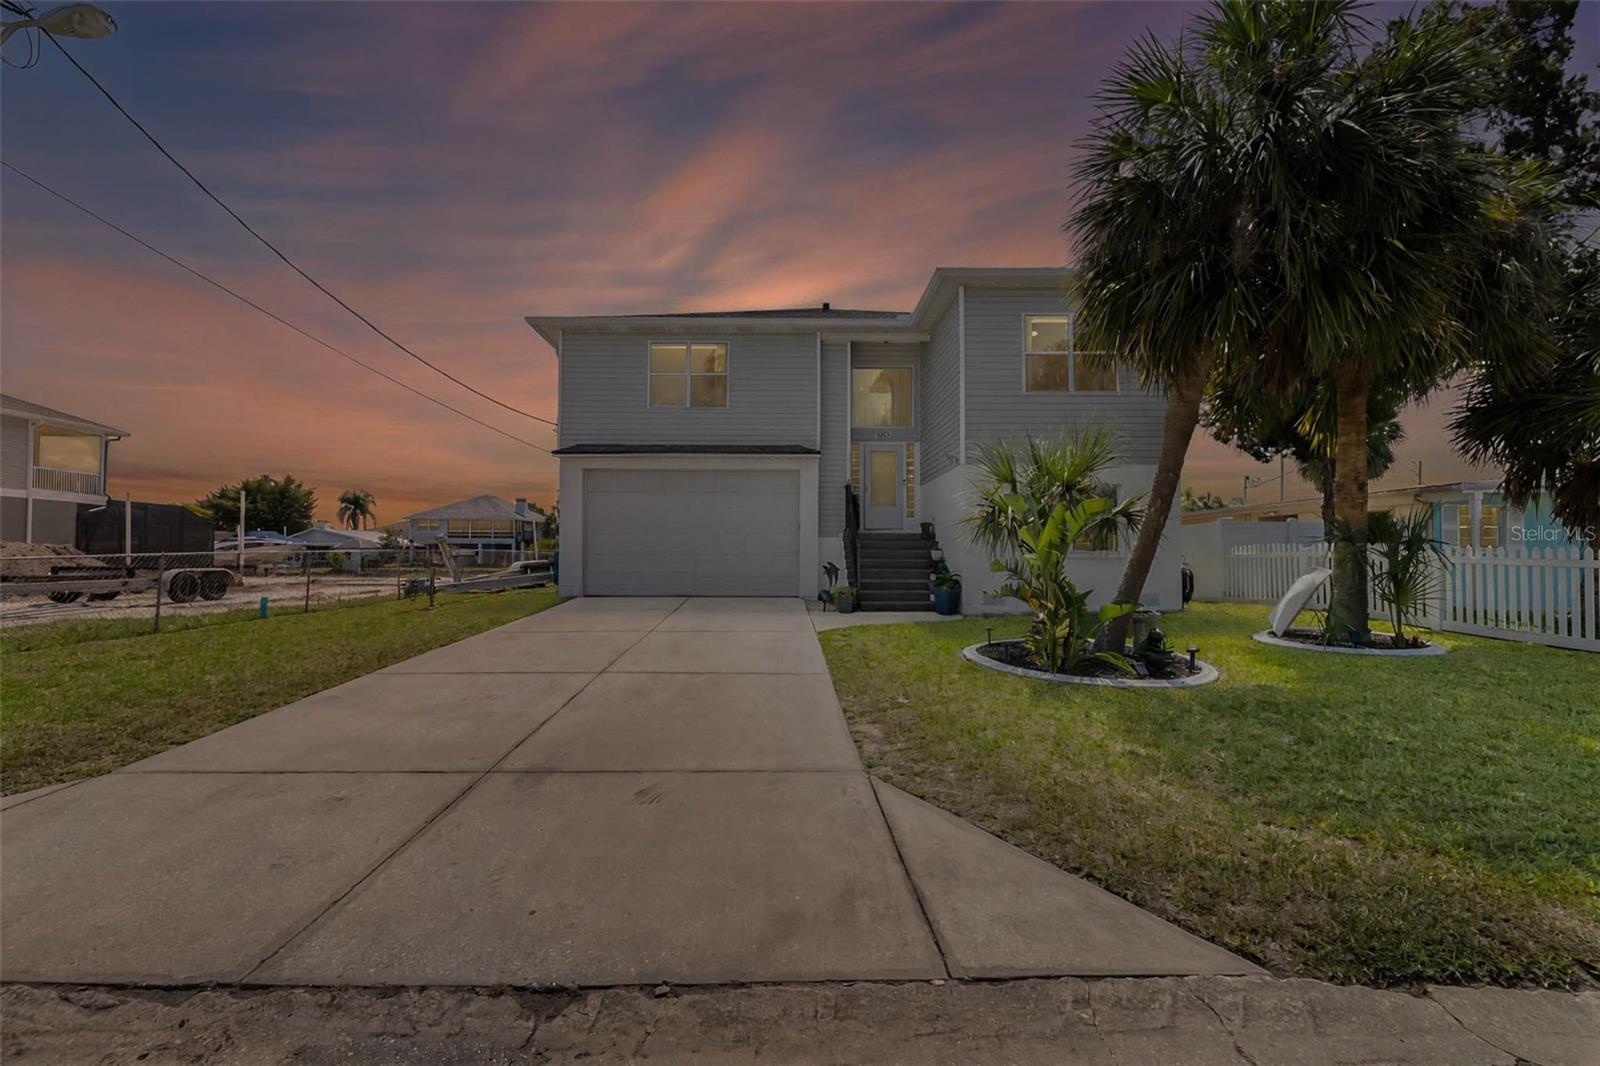
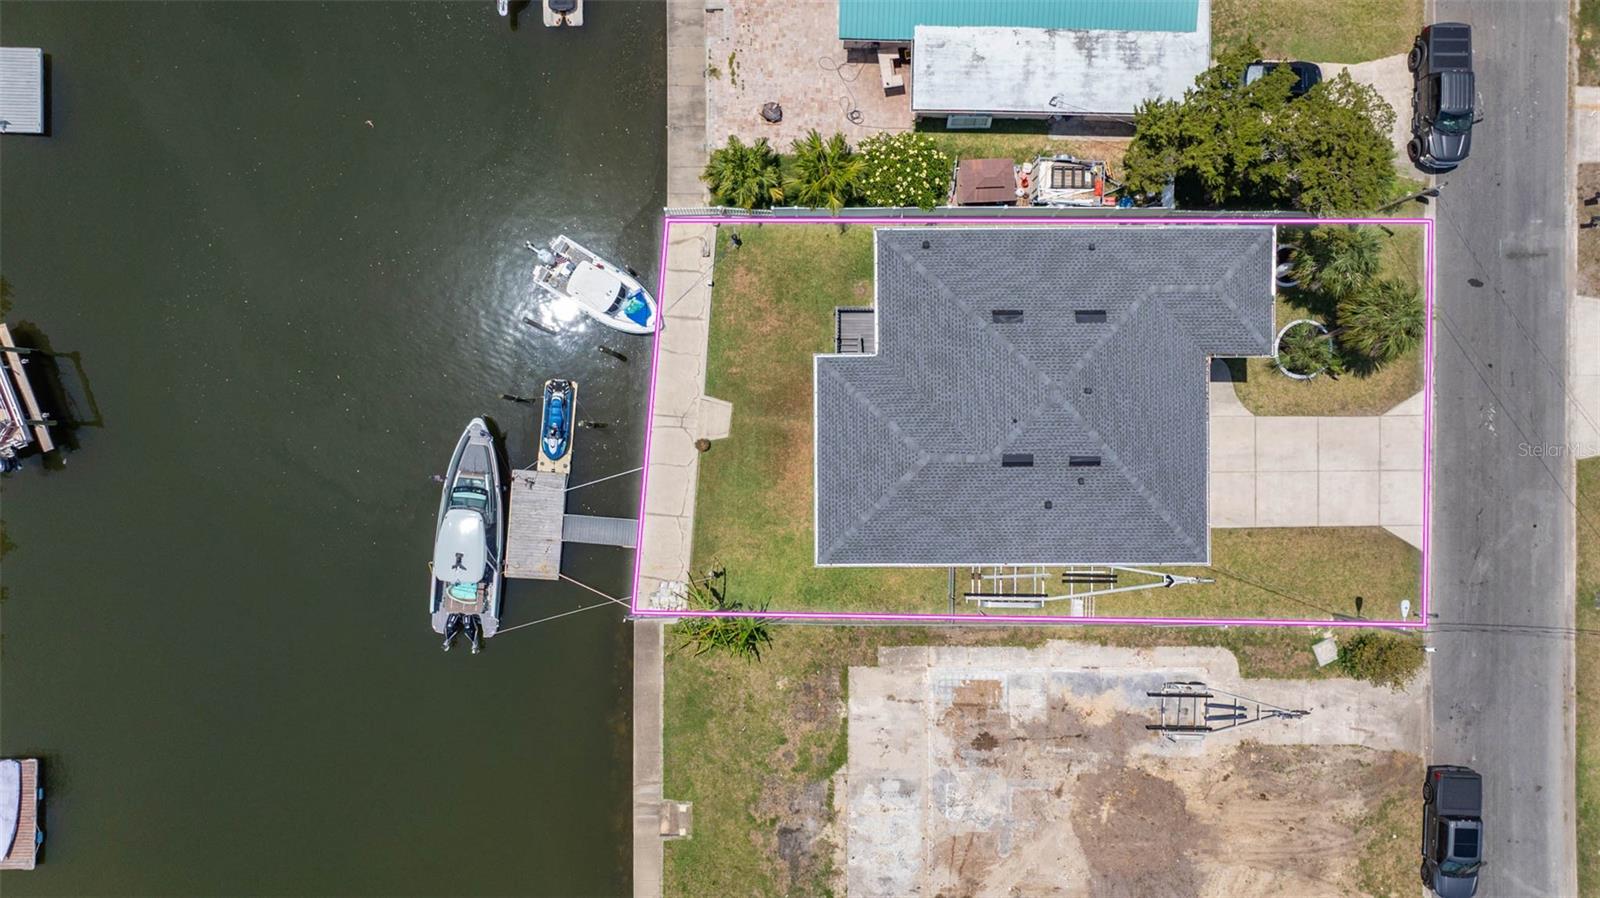
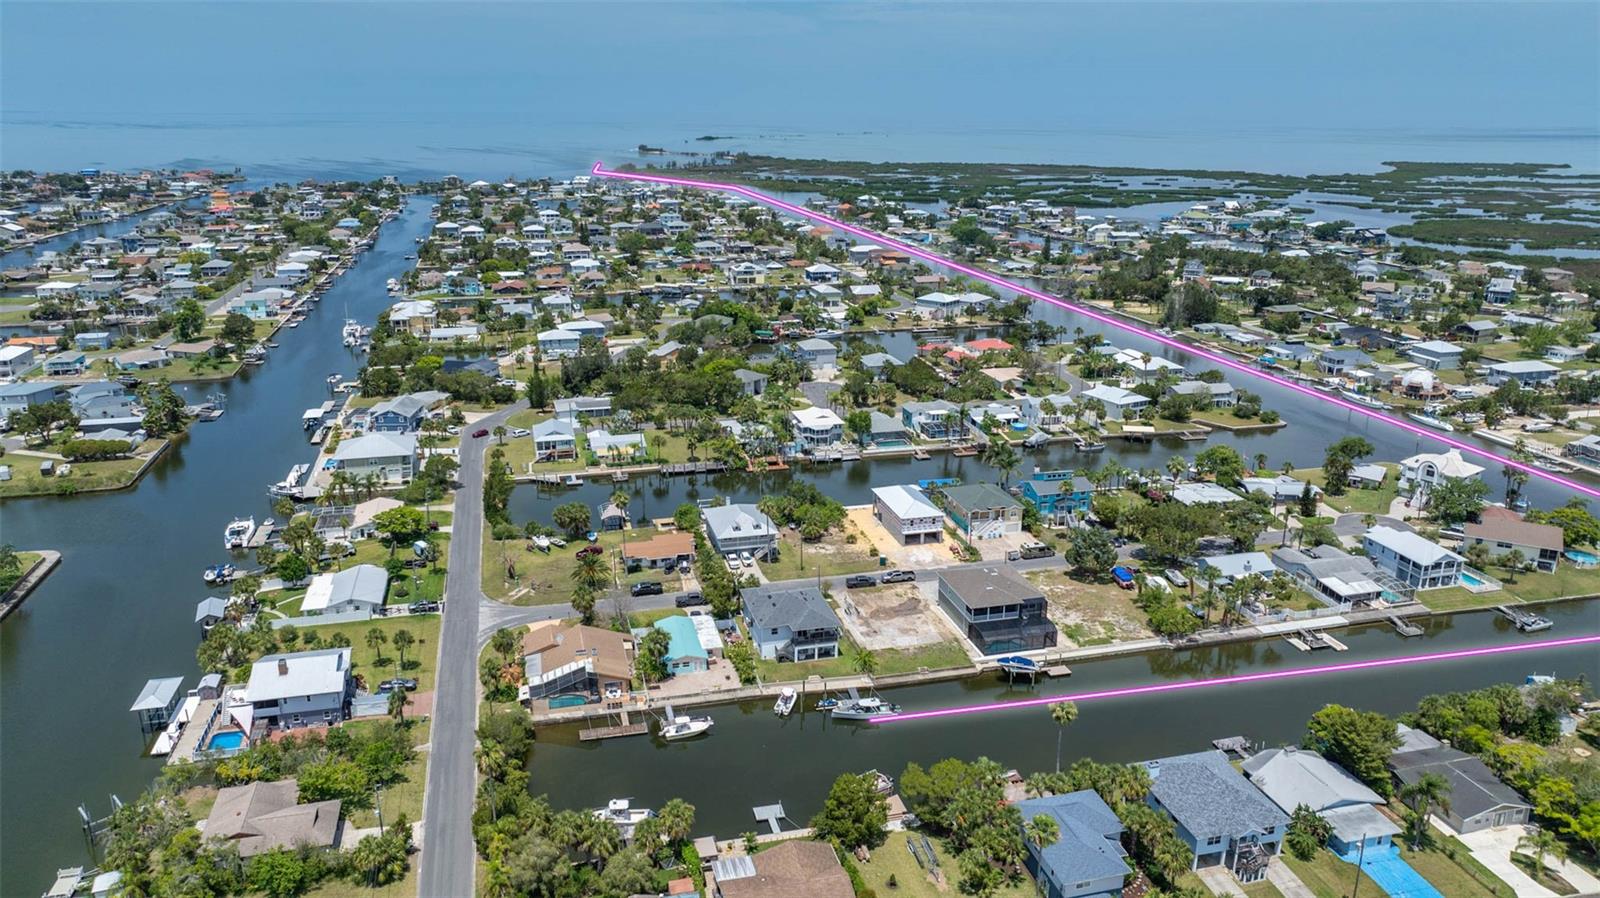
ARE YOU ELIGIBLE FOR A VA LOAN? REACH OUT TO THE LISTING AGENT FOR INFORMATION ON ASSUMING THE OWNERS VA LOAN AT A LOW INTEREST RATE AND VERY LITTLE DOWN! Discover coastal living at its finest in this elevated waterfront home offering direct Gulf access, a private floating dock, and an open permit for a future boat lift with pilings already in place. This thoughtfully designed 3-bedroom, 2-bath home features a desirable split floor plan on the main (second) level, plus an additional bathroom and fully equipped bonus suite on the ground level. Step inside the bright and airy main level, where tall ceilings, fresh paint, and new vinyl flooring set the stage for modern waterfront living. The open-concept kitchen, dining, and living area flows seamlessly to a covered rear deck overlooking the water — perfect for entertaining or relaxing with a view. The kitchen boasts stainless steel appliances, a gas cooktop, quartz countertops, eat-in island, pantry, and of course, breathtaking water views. The spacious primary suite features a recently updated bathroom with dual vanities, a walk-in shower, and a luxurious garden tub. Laundry hookups are conveniently located on both levels. The far end of the home has two bedrooms that share a bathroom. Downstairs, enjoy the versatility of a bonus room with a full bath, laundry area, and its own entrance. The garage side of the first level features a 12-ft tall door with parking for up to 4 vehicles in the tandem bays that are also deep enough to park a boat trailer. The ground level is finished with weather-resistant PVC and block walls for durability and peace of mind. Outside, the oversized fenced yard has ample room to build the pool of your dreams and the side yard has plenty of space to park your RV or boat. Plus, the floating dock and pre-installed pilings make boating a breeze—skip the wait with an already open, transferable permit for your future lift. Additional updated include a new AC in 2017 and new roof in 2022. With all of the wind mitigation upgrades on this property the home owners insurance is only $2474 and transferable flood insurance is $2141. Seller has estimates for a new pool in the backyard at $55k and can be installed within 4 months. Hernando Beach is a vibrant waterfront community that offers the best of coastal living—boating, kayaking, paddleboarding, fishing, and more. Just minutes from the world-famous Weeki Wachee Springs, residents also enjoy close proximity to shopping, dining, hospitals, and top-rated schools. The community is golf cart friendly and allows short-term rentals with no NOA, no deed restrictions, making it perfect for full-time residents, part-time snowbirds, or investors. The Suncoast Parkway offers easy commuting to Tampa, Brooksville, and beyond.
Build Your Team
Quickly find investor-friendly professionals who can help you succeed in real estate investing at any stage of the investing journey.


Agents
Match with investor-friendly agents who can help you find, analyze, and close your next deal


Lenders
Get the best funding…find investor-friendly lenders who specialize in your deal strategy


Property Managers
Transition to passive investing. Find a trusted property management partnership that lasts.


Tax Pros & Accountants
Taxes and financial reporting made easy—find experts to create tax savings strategies, file taxes, and more
Location
Property Details
Parking
- Description: Garage
- Details: Attached
- Garage Spaces: 4
- Spaces Total: 0
Bedroom Information
- # of Bedrooms: 3
Bathroom Information
- # of Baths (Full): 3
- # of Baths (Total): 3.0
Interior Features
- # of Rooms: 3
- # of Stories: 2
- Basement: Yes
- Basement Description: Partial
Exterior Features
- Exterior Walls Materials: Siding (Alum/Vinyl)
- Foundation: Pillar/Post/Pier
- Roof Type: Gable or Hip
- Roof Material: Shingle
HOA
- Association: Gulf Coast Ret Unit 4
Land Information
- Land Use: Residential
- Land Use Subtype: Single Family Residential
Lot Information
- Parcel ID: R1222316201002600030
- Lot Size: 6000 sqft
Property Information
- Property Type: Single Family Residence
- Style: Coastal
- Year Built: 2000
Tax Information
- Annual Tax: $465
Utilities
- Water & Sewer: Public
- Heating: Central
- Cooling: Central Air
Location
- County: Hernando
Listing Details
Investment Summary
- Monthly Cash Flow
- -$988
- Cap Rate
- 4.6%
- Cash-on-Cash Return
- -7.4%
- Debt Coverage Ratio
- 0.73
- Internal Rate of Return (5 years)
- -3.2%
Cash Flow
Net Operating Income (NOI) minus mortgage payments.
Calculation:
NOI - Mortgage Payments
Cap Rate (Market Value)
Capitalization Rate is a rate of return that compares the yearly Net Operating Income (NOI) to the market value.
Calculation:
NOI / Market Value
Cash-on-Cash Return (CoC)
Annual Cash Flow / Cash Invested
Calculation:
Annual cash flow divided by initial cash invested.
Debt Coverage Ratio (DCR)
Net Operating Income (NOI) divided by total debt payments.
Calculation:
NOI / Total Debt Payments
Internal Rate of Return (IRR)
A metric for assessing profitability over time. IRR is the discount rate at which the net present value (NPV) of all future cash flows (positive and negative) from an investment equals zero — including both periodic cash flow (such as rent) and a projected sale at the end of the holding period. It represents the expected annualized return, accounting for income, expenses, and the recovery of capital through a future sale.
Purchase Details
Purchase PriceThe price paid for the property. Purchase price:
| $695,000 |
|---|---|
Amount FinancedThe amount of the purchase financed through a loan. Amount financed:
| -$556,000 |
Down paymentThe initial payment made towards the purchase. Down payment:
| $139,000 |
Closing CostsFees and expenses associated with purchasing a property, typically ranging from 2% to 5% of the home’s purchase price, paid at the end of a home purchase to cover services like lending, title transfer, and taxes. Closing costs:
| $20,850 |
Rehab CostsCosts incurred to repair or improve the property, including: roof, flooring, exterior siding, kitchen, exterior paint, bathrooms, etc. Rehab costs:
| $0 |
Initial Cash InvestedThe total initial cash invested in the property. Calculation:Down payment + Buying costs + Rehab costs Initial cash invested:
| $159,850 |
Square Feet (SQFT)The total square footage of the property. Square feet:
| 1,697 |
Cost Per Square FootCost per square foot of the property. Calculation:Purchase Price / Square Feet Cost per square foot:
| $410 |
Monthly Rent Per Square FootMonthly rent divided by the number of square feet. This ratio helps investors compare rental income efficiency across properties, markets, and unit sizes Calculation:Monthly Rent / Square Feet Monthly rent per square foot:
| $2.30 |
Financing Details
Loan AmountThe total sum of money borrowed from a lender to finance a property purchase. Calculation:Purchase Price - Down Payment
Loan amount:
| $556,000 |
|---|---|
Loan to Value Ratio (LTV)Loan amount divided by the market value of the property. Calculation:Loan Amount / Market Value
Loan to value ratio:
| 80.0% |
Loan TypeThe type of loan (e.g., fixed, adjustable).
Loan type:
| Amortizing |
TermThe loan repayment period in years.
Term:
| 30 years |
Interest RateThe percentage a lender charges on the borrowed amount of a loan, determining the cost of borrowing money.
Interest rate:
| 6.840% |
Principal & Interest (PI)The principal is the portion of the loan payment that reduces the loan balance. The interest is the lender's charge for borrowing money. Calculation:(P * r * (1 + r) ** n) / ((1 + r) ** n - 1) Where:
P = Loan amount (principal)
Principal & interest:
| $3,640 |
Property TaxesAnnual taxes levied by local governments on real estate properties. These taxes fund public services like schools, roads, and emergency services.
Property tax:
| $39 |
InsuranceThe costs for insurance coverage to protect against financial losses due to risks like fire, natural disasters, theft, liability, or tenant-related damages. Calculation:Assumes 7% of gross rental income, unless insurance rates are specified.
Insurance:
| $273 |
Private Mortgage Insurance (PMI)A fee that borrowers pay when they take out a conventional loan with a loan-to-value (LTV) ratio above 80%.
Private mortgage insurance (PMI):
| $0 |
Monthly PaymentThe fixed amount a borrower pays each month to repay a loan. It typically includes principal and interest (P&I) and may also cover property taxes, insurance, HOA fees, and PMI if escrowed. Monthly payment:
| $3,952 |
Operating Income
| % Rent | Monthly | Yearly | |
|---|---|---|---|
Gross RentThe total rental income received from tenants before deducting any expenses. Includes base rent, late fees, pet fees, parking fees, and other recurring charges.
Gross rent:
| $3,900 | $46,800 | |
Vacancy LossExpected loss of rent due to vacancies.
Vacancy loss:
(6%)
| 6% | -$234 | -$2,808 |
Operating IncomeGross rental income minus vacancy loss. Calculation:Gross rent - Vacancy loss
Operating income:
| $3,666 | $43,992 |
Operating Expenses
| % Rent | Monthly | Yearly | |
|---|---|---|---|
Property TaxesAnnual taxes levied by local governments on real estate properties. These taxes fund public services like schools, roads, and emergency services. | 1% | -$39 | -$466 |
InsuranceThe costs for insurance coverage to protect against financial losses due to risks like fire, natural disasters, theft, liability, or tenant-related damages. Calculation:Assumes 7% of gross rental income, unless insurance rates are specified. | 7% | -$273 | -$3,276 |
Property ManagementThe costs associated with hiring a property manager to handle the day-to-day operations of a rental property. Includes management fees, leasing fes, eviction fees, etc. Calculation:Assumes 8% of gross rental income. | 8% | -$312 | -$3,744 |
Repairs & MaintenanceOngoing costs for routine upkeep and minor fixes needed to keep a property in good working condition. Calculation:Assumes 5% of gross rental income. Varies by property age and condition. | 5% | -$195 | -$2,340 |
Capital ExpensesLarge, infrequent costs for major improvements or replacements, like a new roof, HVAC system, or appliances. Calculation:Assumes 5% of gross rental income. Varies by property age. | 5% | -$195 | -$2,340 |
HOA FeesRegular dues paid to a Homeowners Association for community maintenance, amenities, and management. Similar fees include: Condo Association Fees, Co-op Maintenance Fees, etc. | n/a | n/a | n/a |
Operating ExpensesRecurring costs required to maintain and manage a rental property, including property taxes, insurance, maintenance, repairs, utilities (if paid by the owner), property management fees, and other day-to-day expenses. Calculation:Insurance + Property Taxes + Property Management + Repairs & Maintenance + Capital Expenditures + HOA Fees | 26% | -$1,014 | -$12,166 |
Cash Flow
| Monthly | Yearly | |
|---|---|---|
Net Operating Income (NOI)The income generated from a property after deducting all operating expenses but before deducting mortgage payments, taxes, and capital expenditures. Calculation:Gross Operating Income - Operating Expenses
Net operating income:
| $2,652 | $31,824 |
Mortgage PaymentThe fixed amount a borrower pays each month to repay a loan. It typically includes principal and interest (P&I) and may also cover property taxes, insurance, HOA fees, and PMI if escrowed. | -$3,640 | -$43,680 |
Cash FlowNet Operating Income (NOI) minus mortgage payments. Calculation:NOI - Mortgage Payments | $988 | $11,856 |