$550,000
Investment Summary
- Monthly Cash Flow
- -$1,005
- Cap Rate
- 4.0%
- Cash-on-Cash Return
- -9.5%
- Debt Coverage Ratio
- 0.64
- Internal Rate of Return (5 years)
- -5.2%
Cash Flow
Net Operating Income (NOI) minus mortgage payments.
Calculation:
NOI - Mortgage Payments
Cap Rate (Market Value)
Capitalization Rate is a rate of return that compares the yearly Net Operating Income (NOI) to the market value.
Calculation:
NOI / Market Value
Cash-on-Cash Return (CoC)
Annual Cash Flow / Cash Invested
Calculation:
Annual cash flow divided by initial cash invested.
Debt Coverage Ratio (DCR)
Net Operating Income (NOI) divided by total debt payments.
Calculation:
NOI / Total Debt Payments
Internal Rate of Return (IRR)
A metric for assessing profitability over time. IRR is the discount rate at which the net present value (NPV) of all future cash flows (positive and negative) from an investment equals zero — including both periodic cash flow (such as rent) and a projected sale at the end of the holding period. It represents the expected annualized return, accounting for income, expenses, and the recovery of capital through a future sale.
Property Description
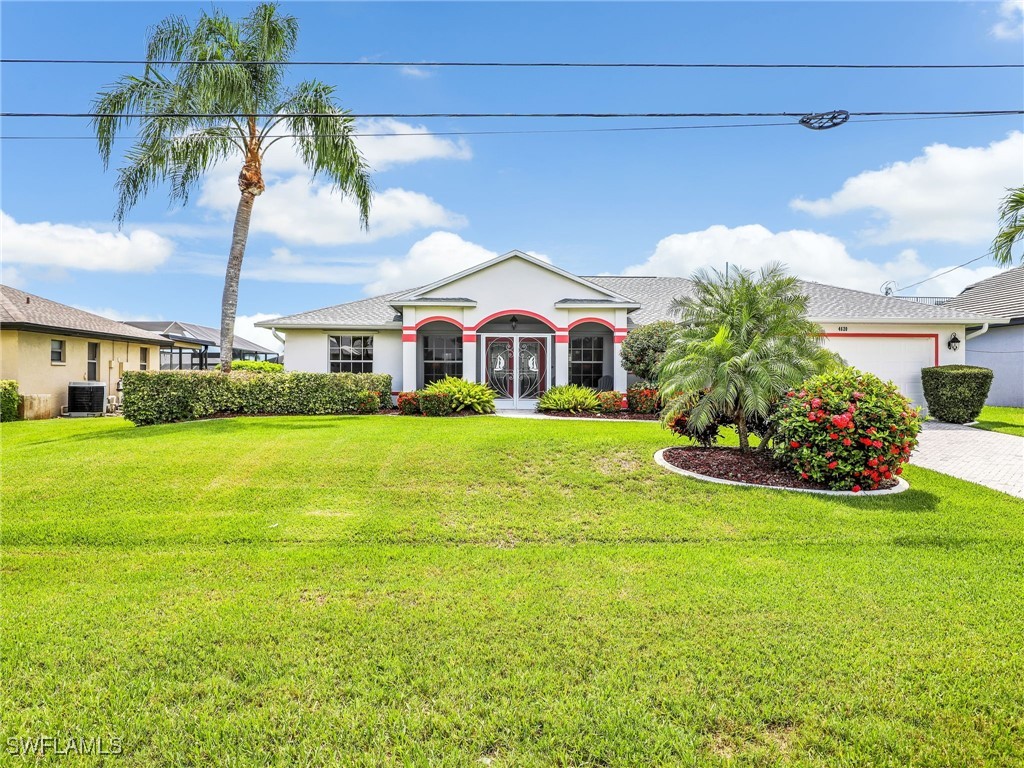
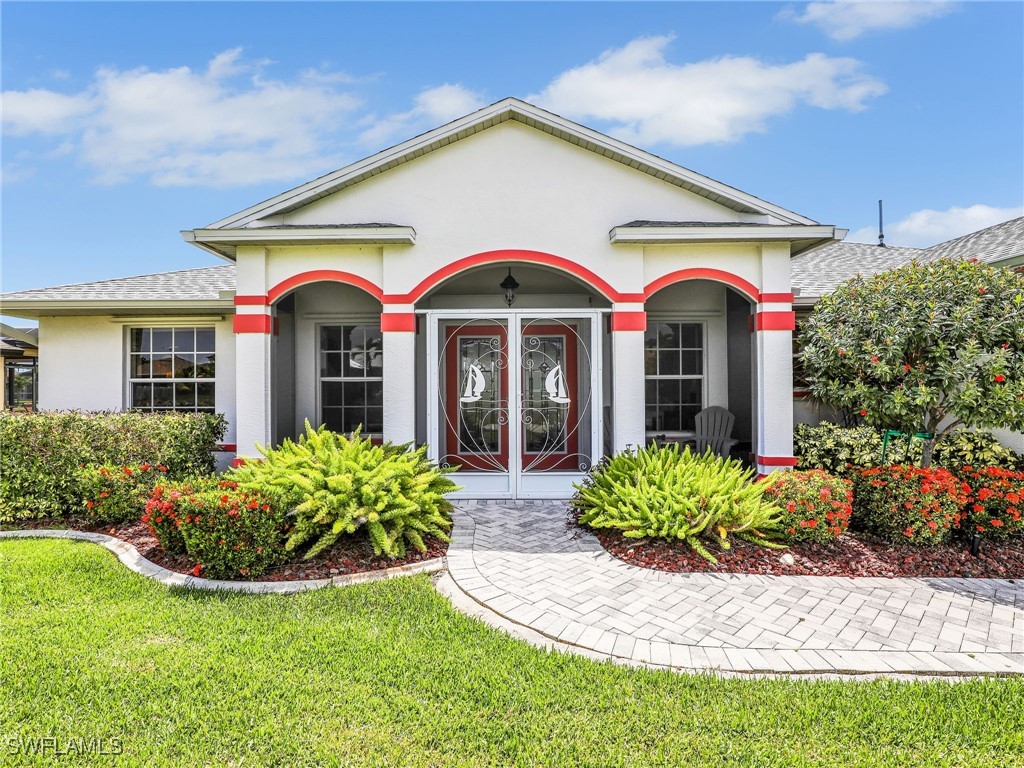
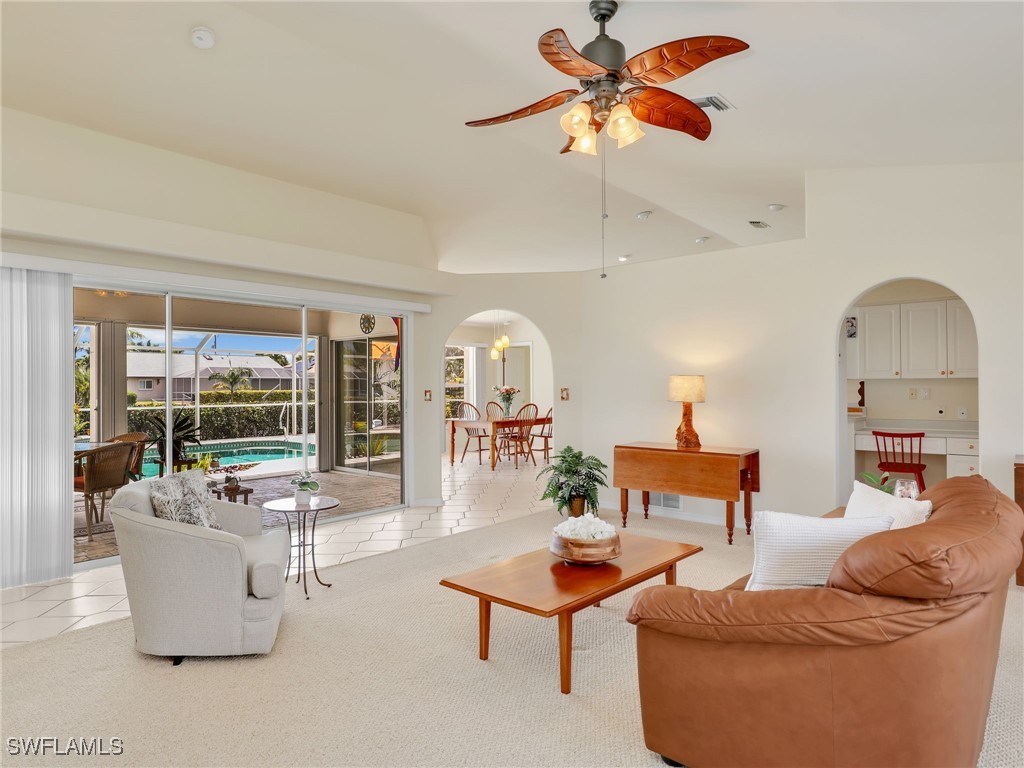
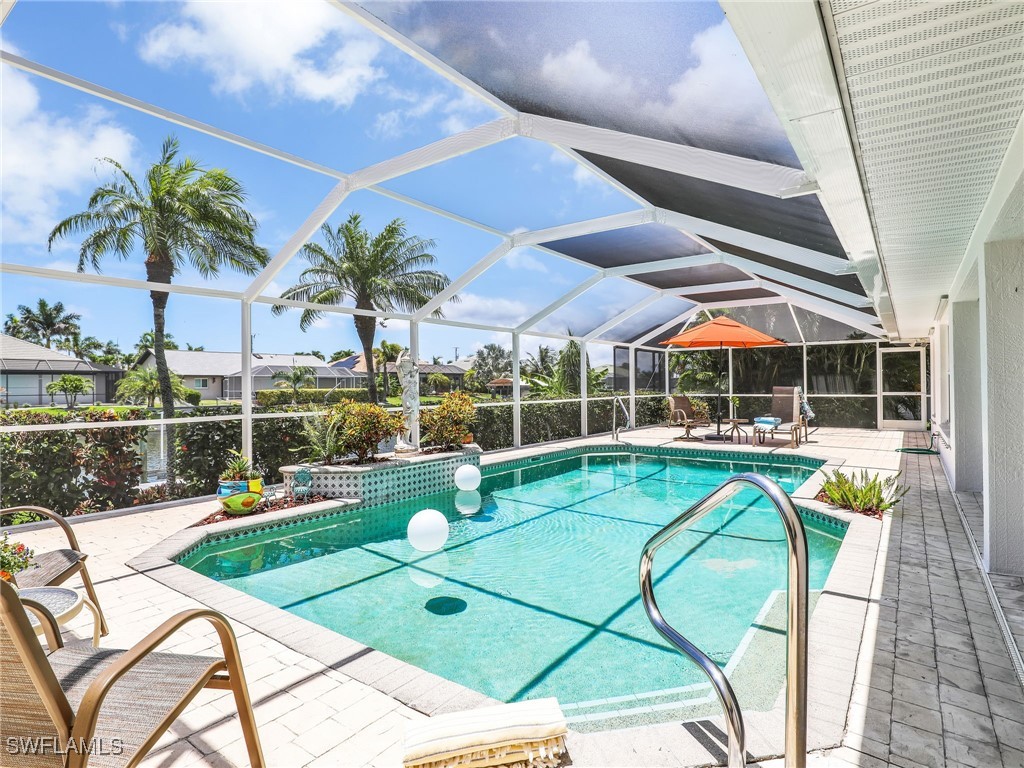
Charming-Waterfront-Gulf Access-Pool Home-Located In A Very Desirable Neighborhood In The Sw Section Of Cape Coral. This Thoughtfully Designed Aubuchon-Built Home Offers The Perfect Blend Of Comfort And Convenience. It’s Been Meticulously Maintained And An Ideal Primary Residence, Vacation Retreat, Or Rental Investment. No Hoa Fees. No Leasing Restrictions. This Lovely Residence Offers A Front Screened Lanai, Perfect For Sipping Morning Coffee And Enjoying Sunrises And Tropical Breezes. Inside, You'll Find An Inviting Great Room With Soaring Ceilings That Flow Seamlessly To The Outdoors Thru A Wall Of Sliding Glass Doors. Enjoy The Western Rear Exposure That Provides Maximum Sunlight In The Pool And Deck Area And Spectacular Sunsets From Your Private Backyard Oasis. The Owners Bedroom Is A Spacious Retreat Overlooking The Pool. The En-Suite Bathroom Has Dual Vanities, A Jetted Tub, Walk-In Shower And Fantastic Walk-In Closet. Two More Bedrooms And Second Bath Are Located On The Opposite Side Of The Home, With Separate Direct Access To Pool Area, Offering Enhanced Privacy For You And Your Guests. The Eat In Kitchen With Breakfast Bar Overlooks The Pool Too. There’s A Convenient, Indoor Laundry Room And Attached 2-Car Garage With A Hurricane-Rated Door. Replaced In 2019. The Roof Was Replaced In 2022. The Expansive Screened Lanai, Was Replaced In 2023. The Entire Back Of The Home Was Thoughtfully Designed For Year-Round Enjoyment. The Covered Area Is Perfect For Dining & Lounging. Splash And Play In The Sparkling Pool, Then Relax On 1 Of 2 Large Deck Areas. There’s So Much Space. Entertain. Relax. Repeat. Just A Few Steps Thru The Yard Takes You Down To The Eleanor Canal By Way Of Your Very Own Private Composite Boat Dock (Installed In 2017) And 10k Lift. Fishing Enthusiast? You Can Do That Right In Your Own Yard Or Enjoy A Short Ride To The River & Calm Warm Waters Of The Gulf Where You Can Explore The Barrier Islands, Beaches, Dolphins And Manatees Or Fish For Snapper And Grouper. Come And Explore The Waterways And Enjoy The Florida Boating Lifestyle. The Home Is Located Near Top-Rated Schools And Is Minutes Away From Shopping And The Best Restaurants In Town, Such As Popular Hotspots Like Lobster Lady, Cape Harbour And Tarpon Point, With Waterfront Dining, Live Entertainment, And Multiple Events Throughout The Year, All While Being Nestled In A Very Quiet Neighborhood That Provides Peace, Privacy And Soaking In The Beauty Of Waterfront Living…Any Way You Look At It, It’s Dreamy And Feels Like Vacation Year Round. City Water And Sewer Assessments Are Fully Paid. Enjoy Peace Of Mind With No History Of Flooding And Comes With Hurricane Protection. This Home Is Easy To Show And PRICED TO SELL. Don't Forget To Check Out The Virtual Tour. Then Set A Private Appointment Today. It’s Your Turn To Live Life~Florida Style.
Build Your Team
Quickly find investor-friendly professionals who can help you succeed in real estate investing at any stage of the investing journey.


Agents
Match with investor-friendly agents who can help you find, analyze, and close your next deal


Lenders
Get the best funding…find investor-friendly lenders who specialize in your deal strategy


Property Managers
Transition to passive investing. Find a trusted property management partnership that lasts.


Tax Pros & Accountants
Taxes and financial reporting made easy—find experts to create tax savings strategies, file taxes, and more
Location
Property Details
Parking
- Description: Garage
- Details: Attached, Driveway, Garage, Paved, Garage Door Opener
- Garage Spaces: 2
- Spaces Total: 0
Bedroom Information
- # of Bedrooms: 3
Bathroom Information
- # of Baths (Full): 2
- # of Baths (Total): 2.0
Interior Features
- # of Stories: 1
Exterior Features
- Exterior Walls Materials: Stucco
- Roof Type: Gable or Hip
- Roof Material: Shingle
- Pool: Yes
Land Information
- Land Use: Residential
- Land Use Subtype: Single Family Residential
Lot Information
- Parcel ID: 094523C304662.0260
- Lot Size: 0 sqft
Property Information
- Property Type: Single Family Residence
- Style: Ranch, One Story
- Year Built: 1995
Tax Information
- Annual Tax: $3,922
Utilities
- Water & Sewer: Public
- Heating: Central, Electric
- Cooling: Central Air, Ceiling Fan(s), Electric
Location
- County: Lee
Listing Details
Investment Summary
- Monthly Cash Flow
- -$1,005
- Cap Rate
- 4.0%
- Cash-on-Cash Return
- -9.5%
- Debt Coverage Ratio
- 0.64
- Internal Rate of Return (5 years)
- -5.2%
Cash Flow
Net Operating Income (NOI) minus mortgage payments.
Calculation:
NOI - Mortgage Payments
Cap Rate (Market Value)
Capitalization Rate is a rate of return that compares the yearly Net Operating Income (NOI) to the market value.
Calculation:
NOI / Market Value
Cash-on-Cash Return (CoC)
Annual Cash Flow / Cash Invested
Calculation:
Annual cash flow divided by initial cash invested.
Debt Coverage Ratio (DCR)
Net Operating Income (NOI) divided by total debt payments.
Calculation:
NOI / Total Debt Payments
Internal Rate of Return (IRR)
A metric for assessing profitability over time. IRR is the discount rate at which the net present value (NPV) of all future cash flows (positive and negative) from an investment equals zero — including both periodic cash flow (such as rent) and a projected sale at the end of the holding period. It represents the expected annualized return, accounting for income, expenses, and the recovery of capital through a future sale.
Purchase Details
Purchase PriceThe price paid for the property. Purchase price:
| $550,000 |
|---|---|
Amount FinancedThe amount of the purchase financed through a loan. Amount financed:
| -$440,000 |
Down paymentThe initial payment made towards the purchase. Down payment:
| $110,000 |
Closing CostsFees and expenses associated with purchasing a property, typically ranging from 2% to 5% of the home’s purchase price, paid at the end of a home purchase to cover services like lending, title transfer, and taxes. Closing costs:
| $16,500 |
Rehab CostsCosts incurred to repair or improve the property, including: roof, flooring, exterior siding, kitchen, exterior paint, bathrooms, etc. Rehab costs:
| $0 |
Initial Cash InvestedThe total initial cash invested in the property. Calculation:Down payment + Buying costs + Rehab costs Initial cash invested:
| $126,500 |
Square Feet (SQFT)The total square footage of the property. Square feet:
| 1,614 |
Cost Per Square FootCost per square foot of the property. Calculation:Purchase Price / Square Feet Cost per square foot:
| $341 |
Monthly Rent Per Square FootMonthly rent divided by the number of square feet. This ratio helps investors compare rental income efficiency across properties, markets, and unit sizes Calculation:Monthly Rent / Square Feet Monthly rent per square foot:
| $1.92 |
Financing Details
Loan AmountThe total sum of money borrowed from a lender to finance a property purchase. Calculation:Purchase Price - Down Payment
Loan amount:
| $440,000 |
|---|---|
Loan to Value Ratio (LTV)Loan amount divided by the market value of the property. Calculation:Loan Amount / Market Value
Loan to value ratio:
| 80.0% |
Loan TypeThe type of loan (e.g., fixed, adjustable).
Loan type:
| Amortizing |
TermThe loan repayment period in years.
Term:
| 30 years |
Interest RateThe percentage a lender charges on the borrowed amount of a loan, determining the cost of borrowing money.
Interest rate:
| 6.625% |
Principal & Interest (PI)The principal is the portion of the loan payment that reduces the loan balance. The interest is the lender's charge for borrowing money. Calculation:(P * r * (1 + r) ** n) / ((1 + r) ** n - 1) Where:
P = Loan amount (principal)
Principal & interest:
| $2,817 |
Property TaxesAnnual taxes levied by local governments on real estate properties. These taxes fund public services like schools, roads, and emergency services.
Property tax:
| $327 |
InsuranceThe costs for insurance coverage to protect against financial losses due to risks like fire, natural disasters, theft, liability, or tenant-related damages. Calculation:Assumes 7% of gross rental income, unless insurance rates are specified.
Insurance:
| $217 |
Private Mortgage Insurance (PMI)A fee that borrowers pay when they take out a conventional loan with a loan-to-value (LTV) ratio above 80%.
Private mortgage insurance (PMI):
| $0 |
Monthly PaymentThe fixed amount a borrower pays each month to repay a loan. It typically includes principal and interest (P&I) and may also cover property taxes, insurance, HOA fees, and PMI if escrowed. Monthly payment:
| $3,361 |
Operating Income
| % Rent | Monthly | Yearly | |
|---|---|---|---|
Gross RentThe total rental income received from tenants before deducting any expenses. Includes base rent, late fees, pet fees, parking fees, and other recurring charges.
Gross rent:
| $3,100 | $37,200 | |
Vacancy LossExpected loss of rent due to vacancies.
Vacancy loss:
(6%)
| 6% | -$186 | -$2,232 |
Operating IncomeGross rental income minus vacancy loss. Calculation:Gross rent - Vacancy loss
Operating income:
| $2,914 | $34,968 |
Operating Expenses
| % Rent | Monthly | Yearly | |
|---|---|---|---|
Property TaxesAnnual taxes levied by local governments on real estate properties. These taxes fund public services like schools, roads, and emergency services. | 11% | -$327 | -$3,922 |
InsuranceThe costs for insurance coverage to protect against financial losses due to risks like fire, natural disasters, theft, liability, or tenant-related damages. Calculation:Assumes 7% of gross rental income, unless insurance rates are specified. | 7% | -$217 | -$2,604 |
Property ManagementThe costs associated with hiring a property manager to handle the day-to-day operations of a rental property. Includes management fees, leasing fes, eviction fees, etc. Calculation:Assumes 8% of gross rental income. | 8% | -$248 | -$2,976 |
Repairs & MaintenanceOngoing costs for routine upkeep and minor fixes needed to keep a property in good working condition. Calculation:Assumes 5% of gross rental income. Varies by property age and condition. | 5% | -$155 | -$1,860 |
Capital ExpensesLarge, infrequent costs for major improvements or replacements, like a new roof, HVAC system, or appliances. Calculation:Assumes 5% of gross rental income. Varies by property age. | 5% | -$155 | -$1,860 |
HOA FeesRegular dues paid to a Homeowners Association for community maintenance, amenities, and management. Similar fees include: Condo Association Fees, Co-op Maintenance Fees, etc. | n/a | n/a | n/a |
Operating ExpensesRecurring costs required to maintain and manage a rental property, including property taxes, insurance, maintenance, repairs, utilities (if paid by the owner), property management fees, and other day-to-day expenses. Calculation:Insurance + Property Taxes + Property Management + Repairs & Maintenance + Capital Expenditures + HOA Fees | 36% | -$1,102 | -$13,222 |
Cash Flow
| Monthly | Yearly | |
|---|---|---|
Net Operating Income (NOI)The income generated from a property after deducting all operating expenses but before deducting mortgage payments, taxes, and capital expenditures. Calculation:Gross Operating Income - Operating Expenses
Net operating income:
| $1,812 | $21,744 |
Mortgage PaymentThe fixed amount a borrower pays each month to repay a loan. It typically includes principal and interest (P&I) and may also cover property taxes, insurance, HOA fees, and PMI if escrowed. | -$2,817 | -$33,804 |
Cash FlowNet Operating Income (NOI) minus mortgage payments. Calculation:NOI - Mortgage Payments | $1,005 | $12,060 |