$1,125,000
Investment Summary
- Monthly Cash Flow
- -$3,806
- Cap Rate
- 2.1%
- Cash-on-Cash Return
- -17.7%
- Debt Coverage Ratio
- 0.34
- Internal Rate of Return (5 years)
- -13.1%
Cash Flow
Net Operating Income (NOI) minus mortgage payments.
Calculation:
NOI - Mortgage Payments
Cap Rate (Market Value)
Capitalization Rate is a rate of return that compares the yearly Net Operating Income (NOI) to the market value.
Calculation:
NOI / Market Value
Cash-on-Cash Return (CoC)
Annual Cash Flow / Cash Invested
Calculation:
Annual cash flow divided by initial cash invested.
Debt Coverage Ratio (DCR)
Net Operating Income (NOI) divided by total debt payments.
Calculation:
NOI / Total Debt Payments
Internal Rate of Return (IRR)
A metric for assessing profitability over time. IRR is the discount rate at which the net present value (NPV) of all future cash flows (positive and negative) from an investment equals zero — including both periodic cash flow (such as rent) and a projected sale at the end of the holding period. It represents the expected annualized return, accounting for income, expenses, and the recovery of capital through a future sale.
Property Description
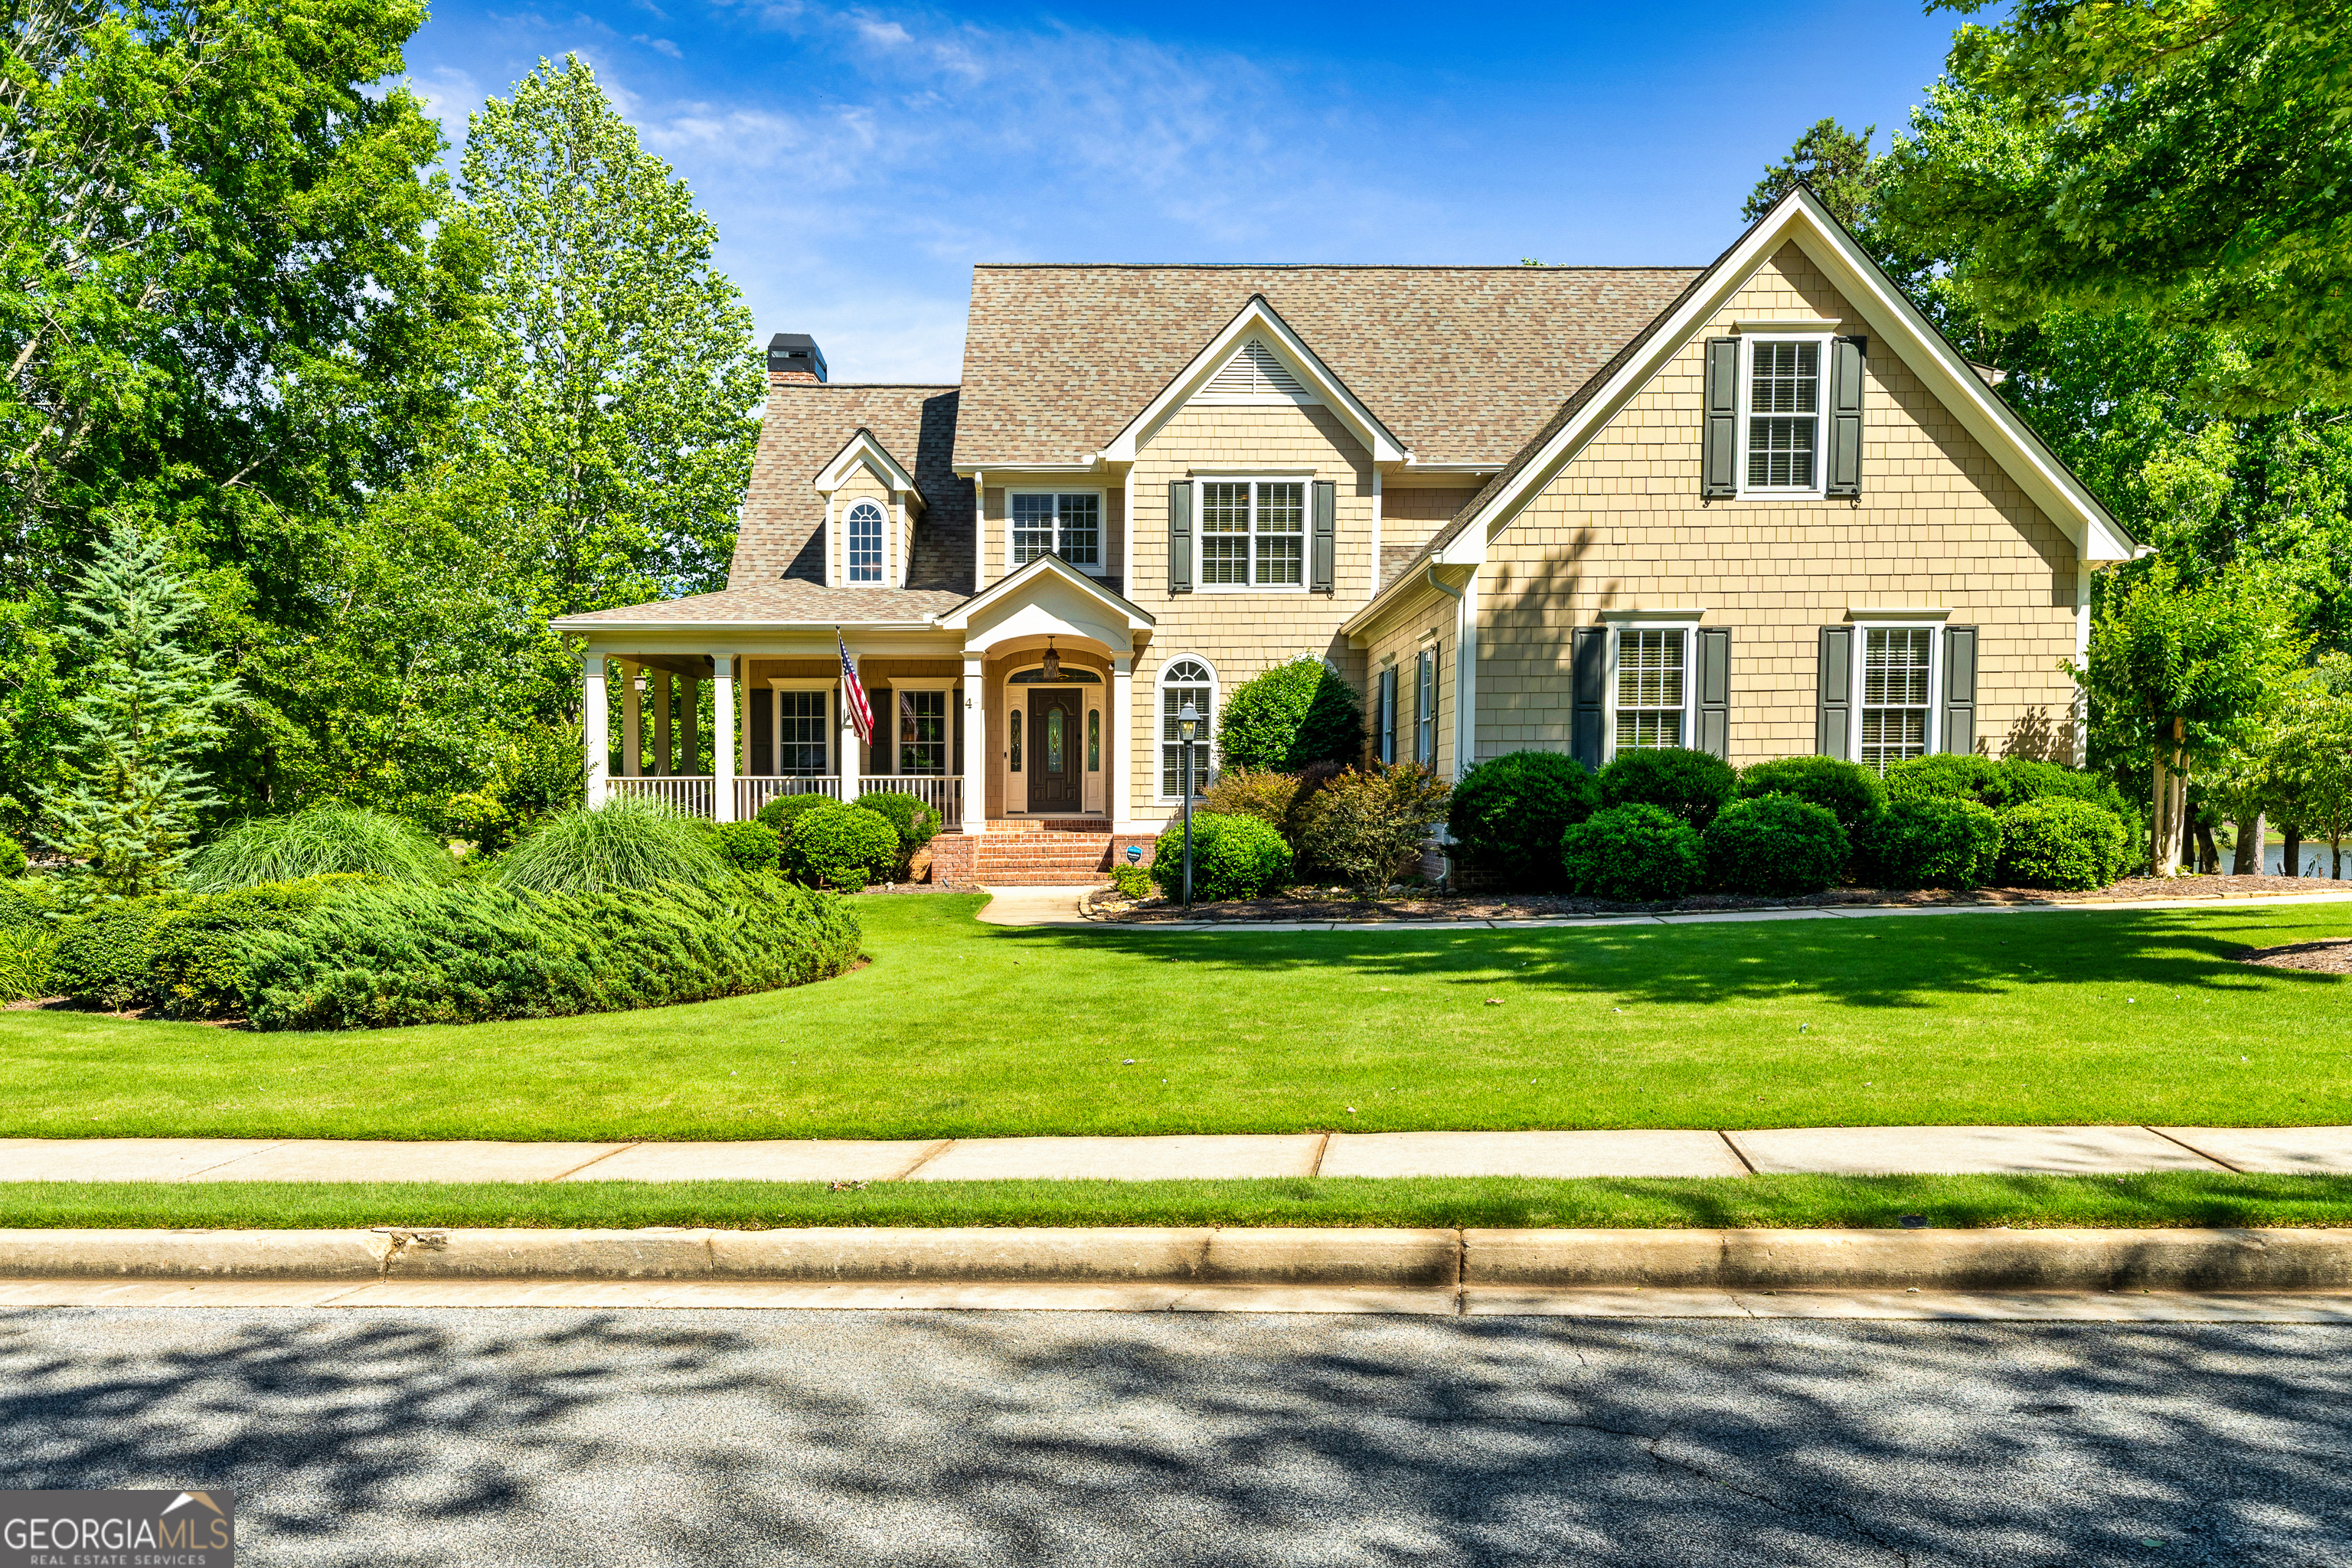
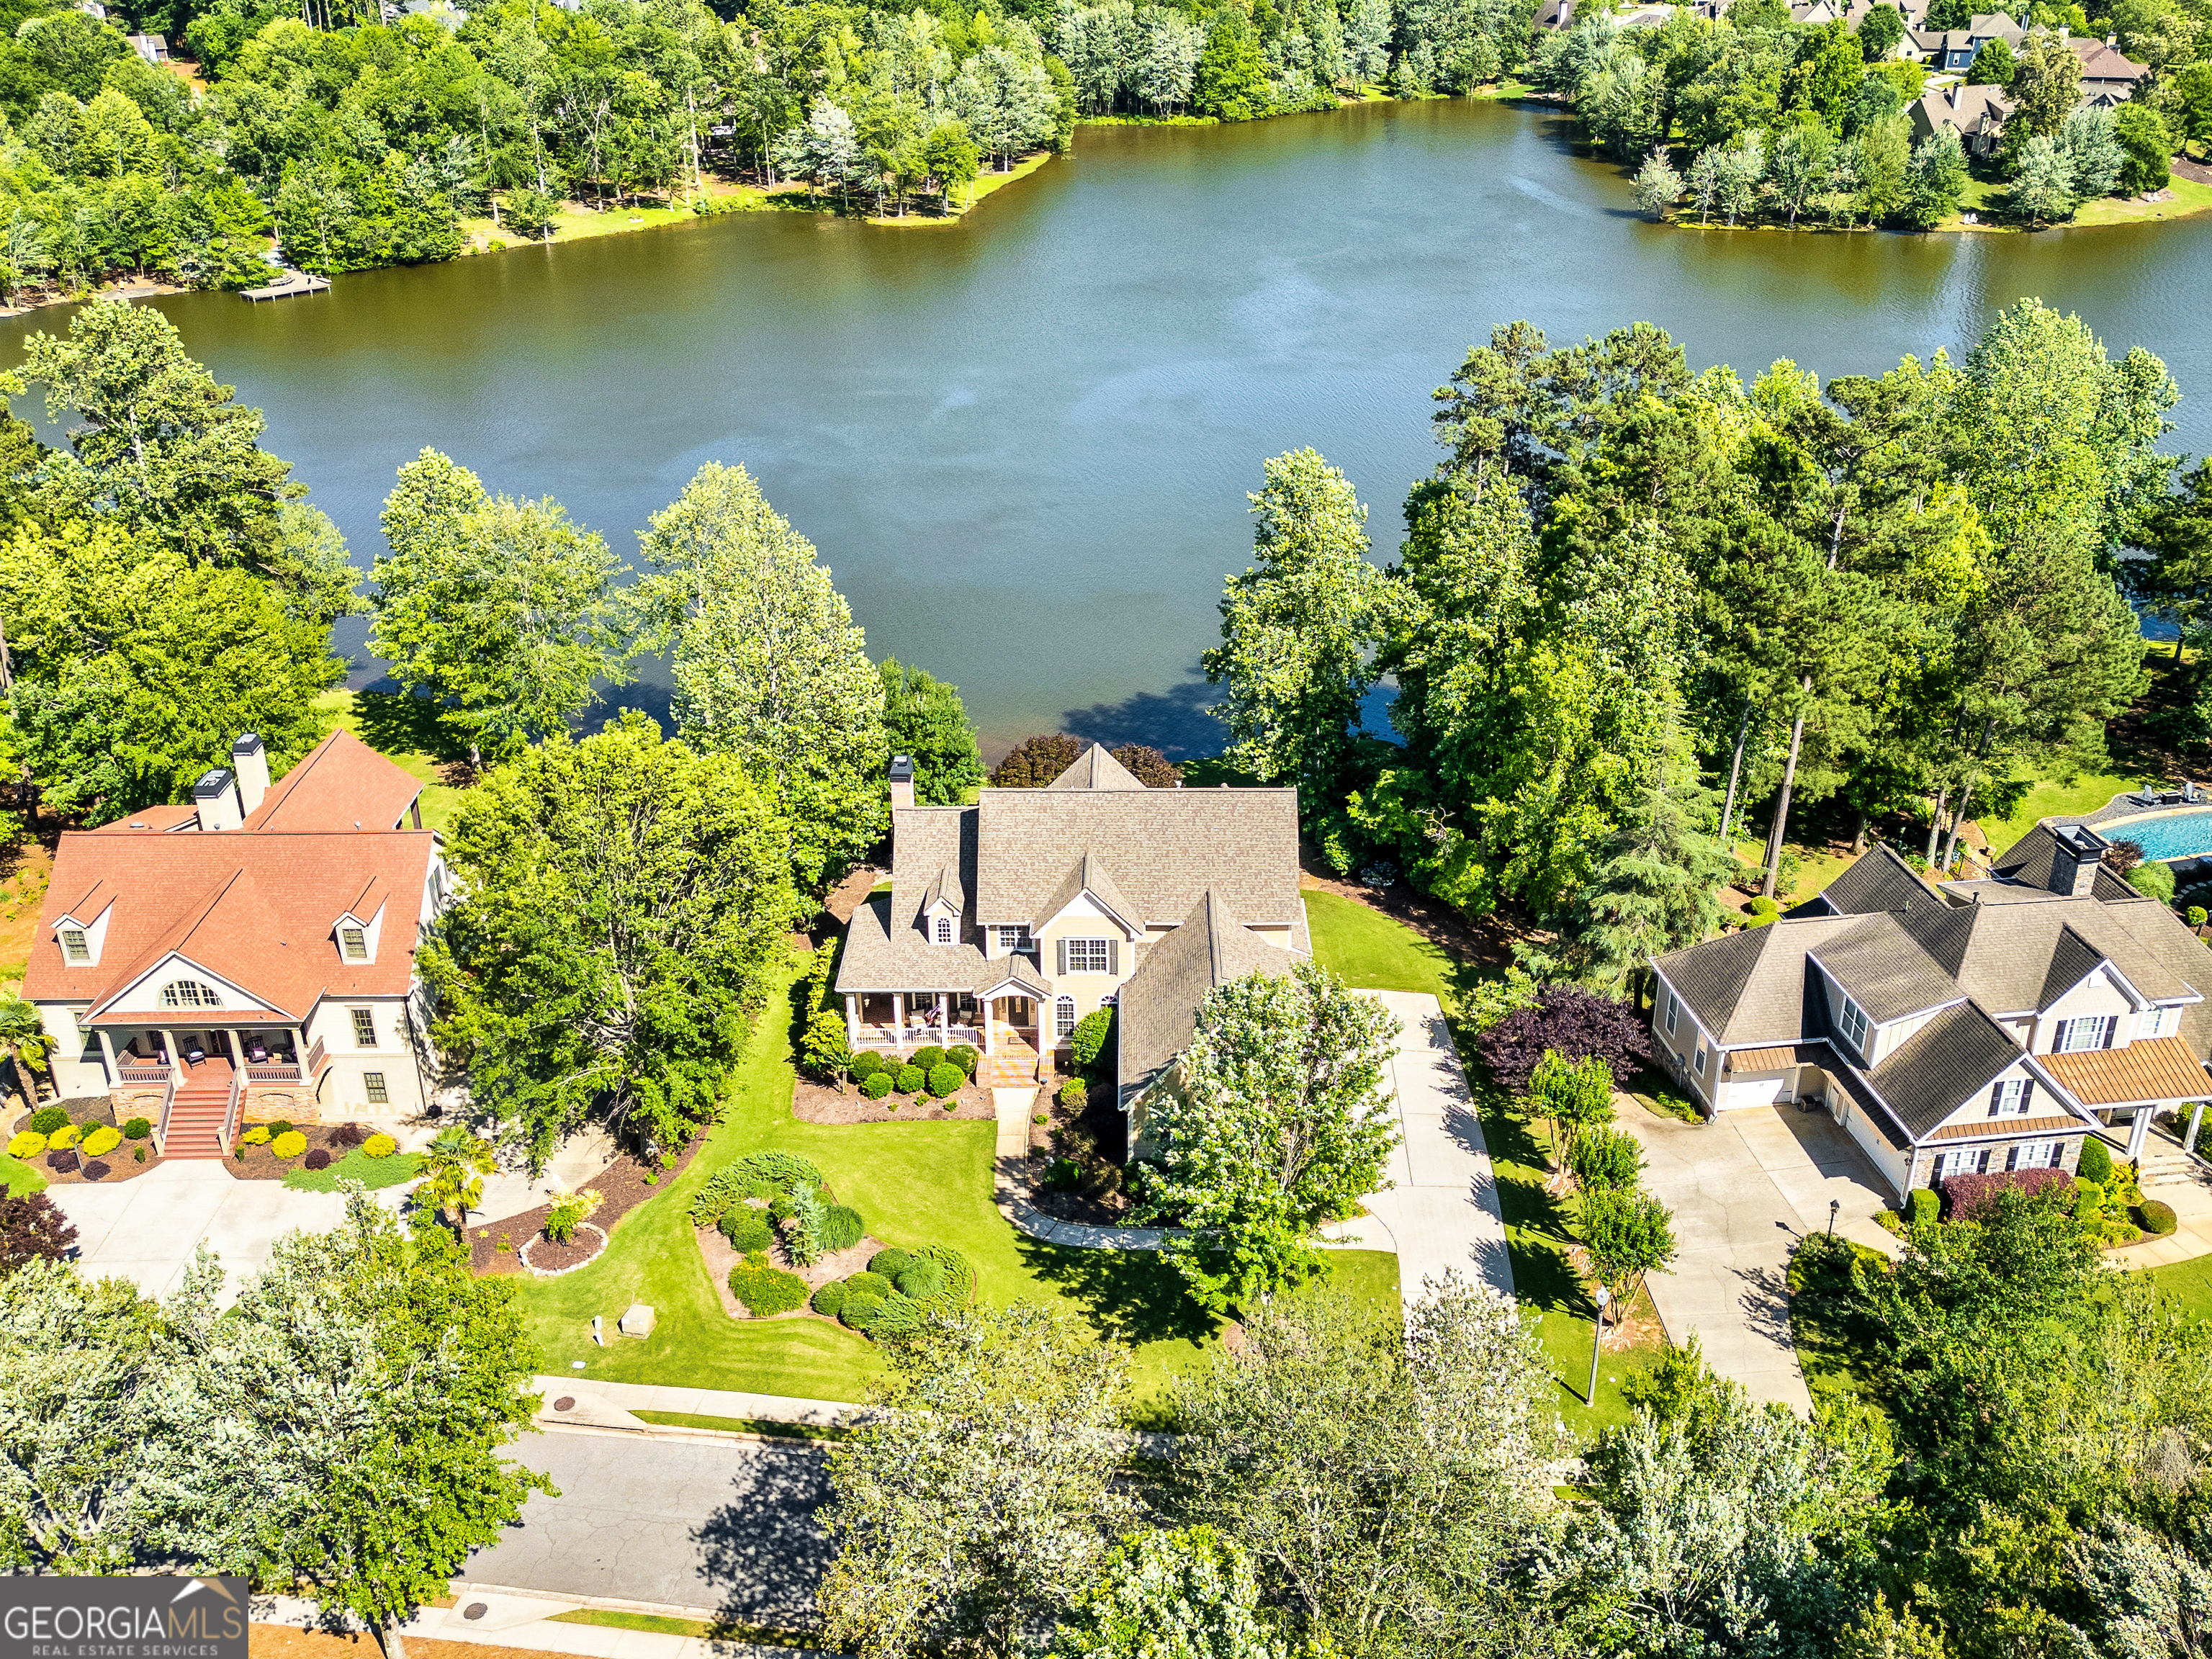
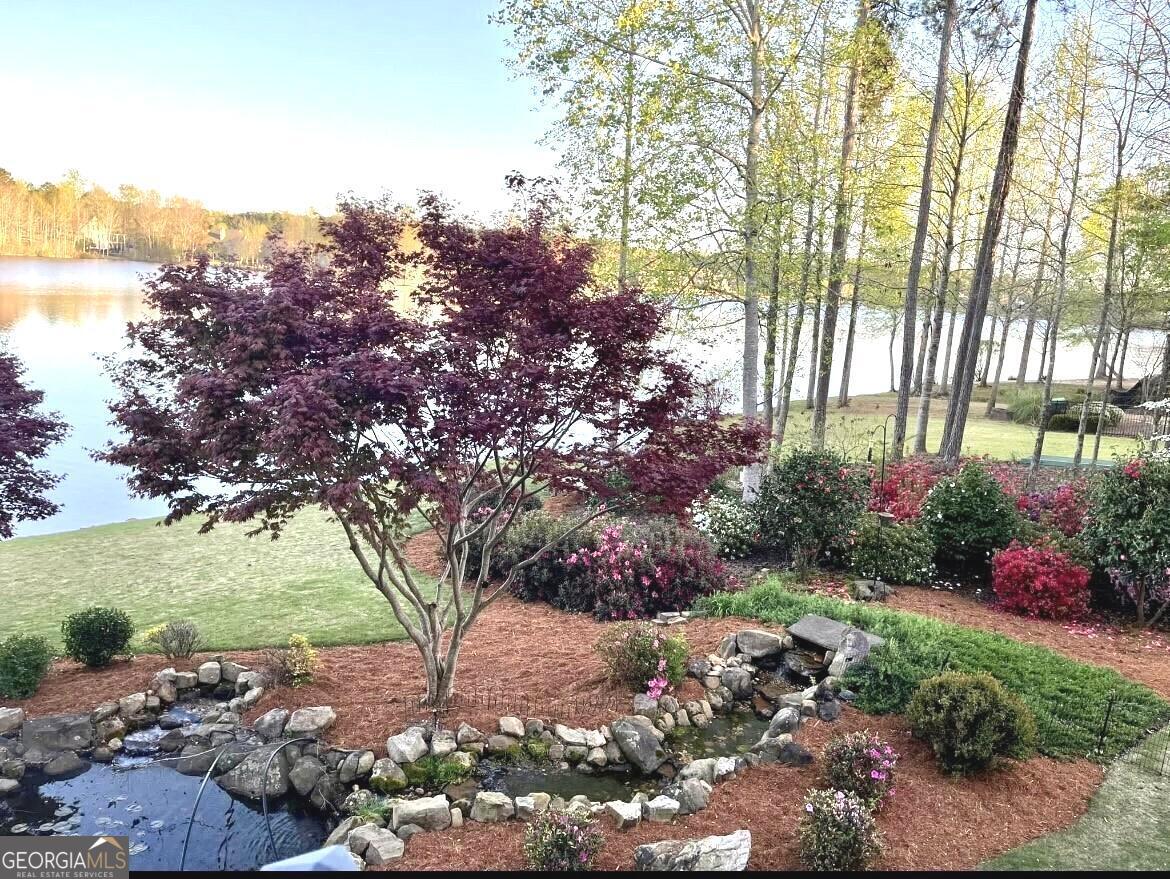
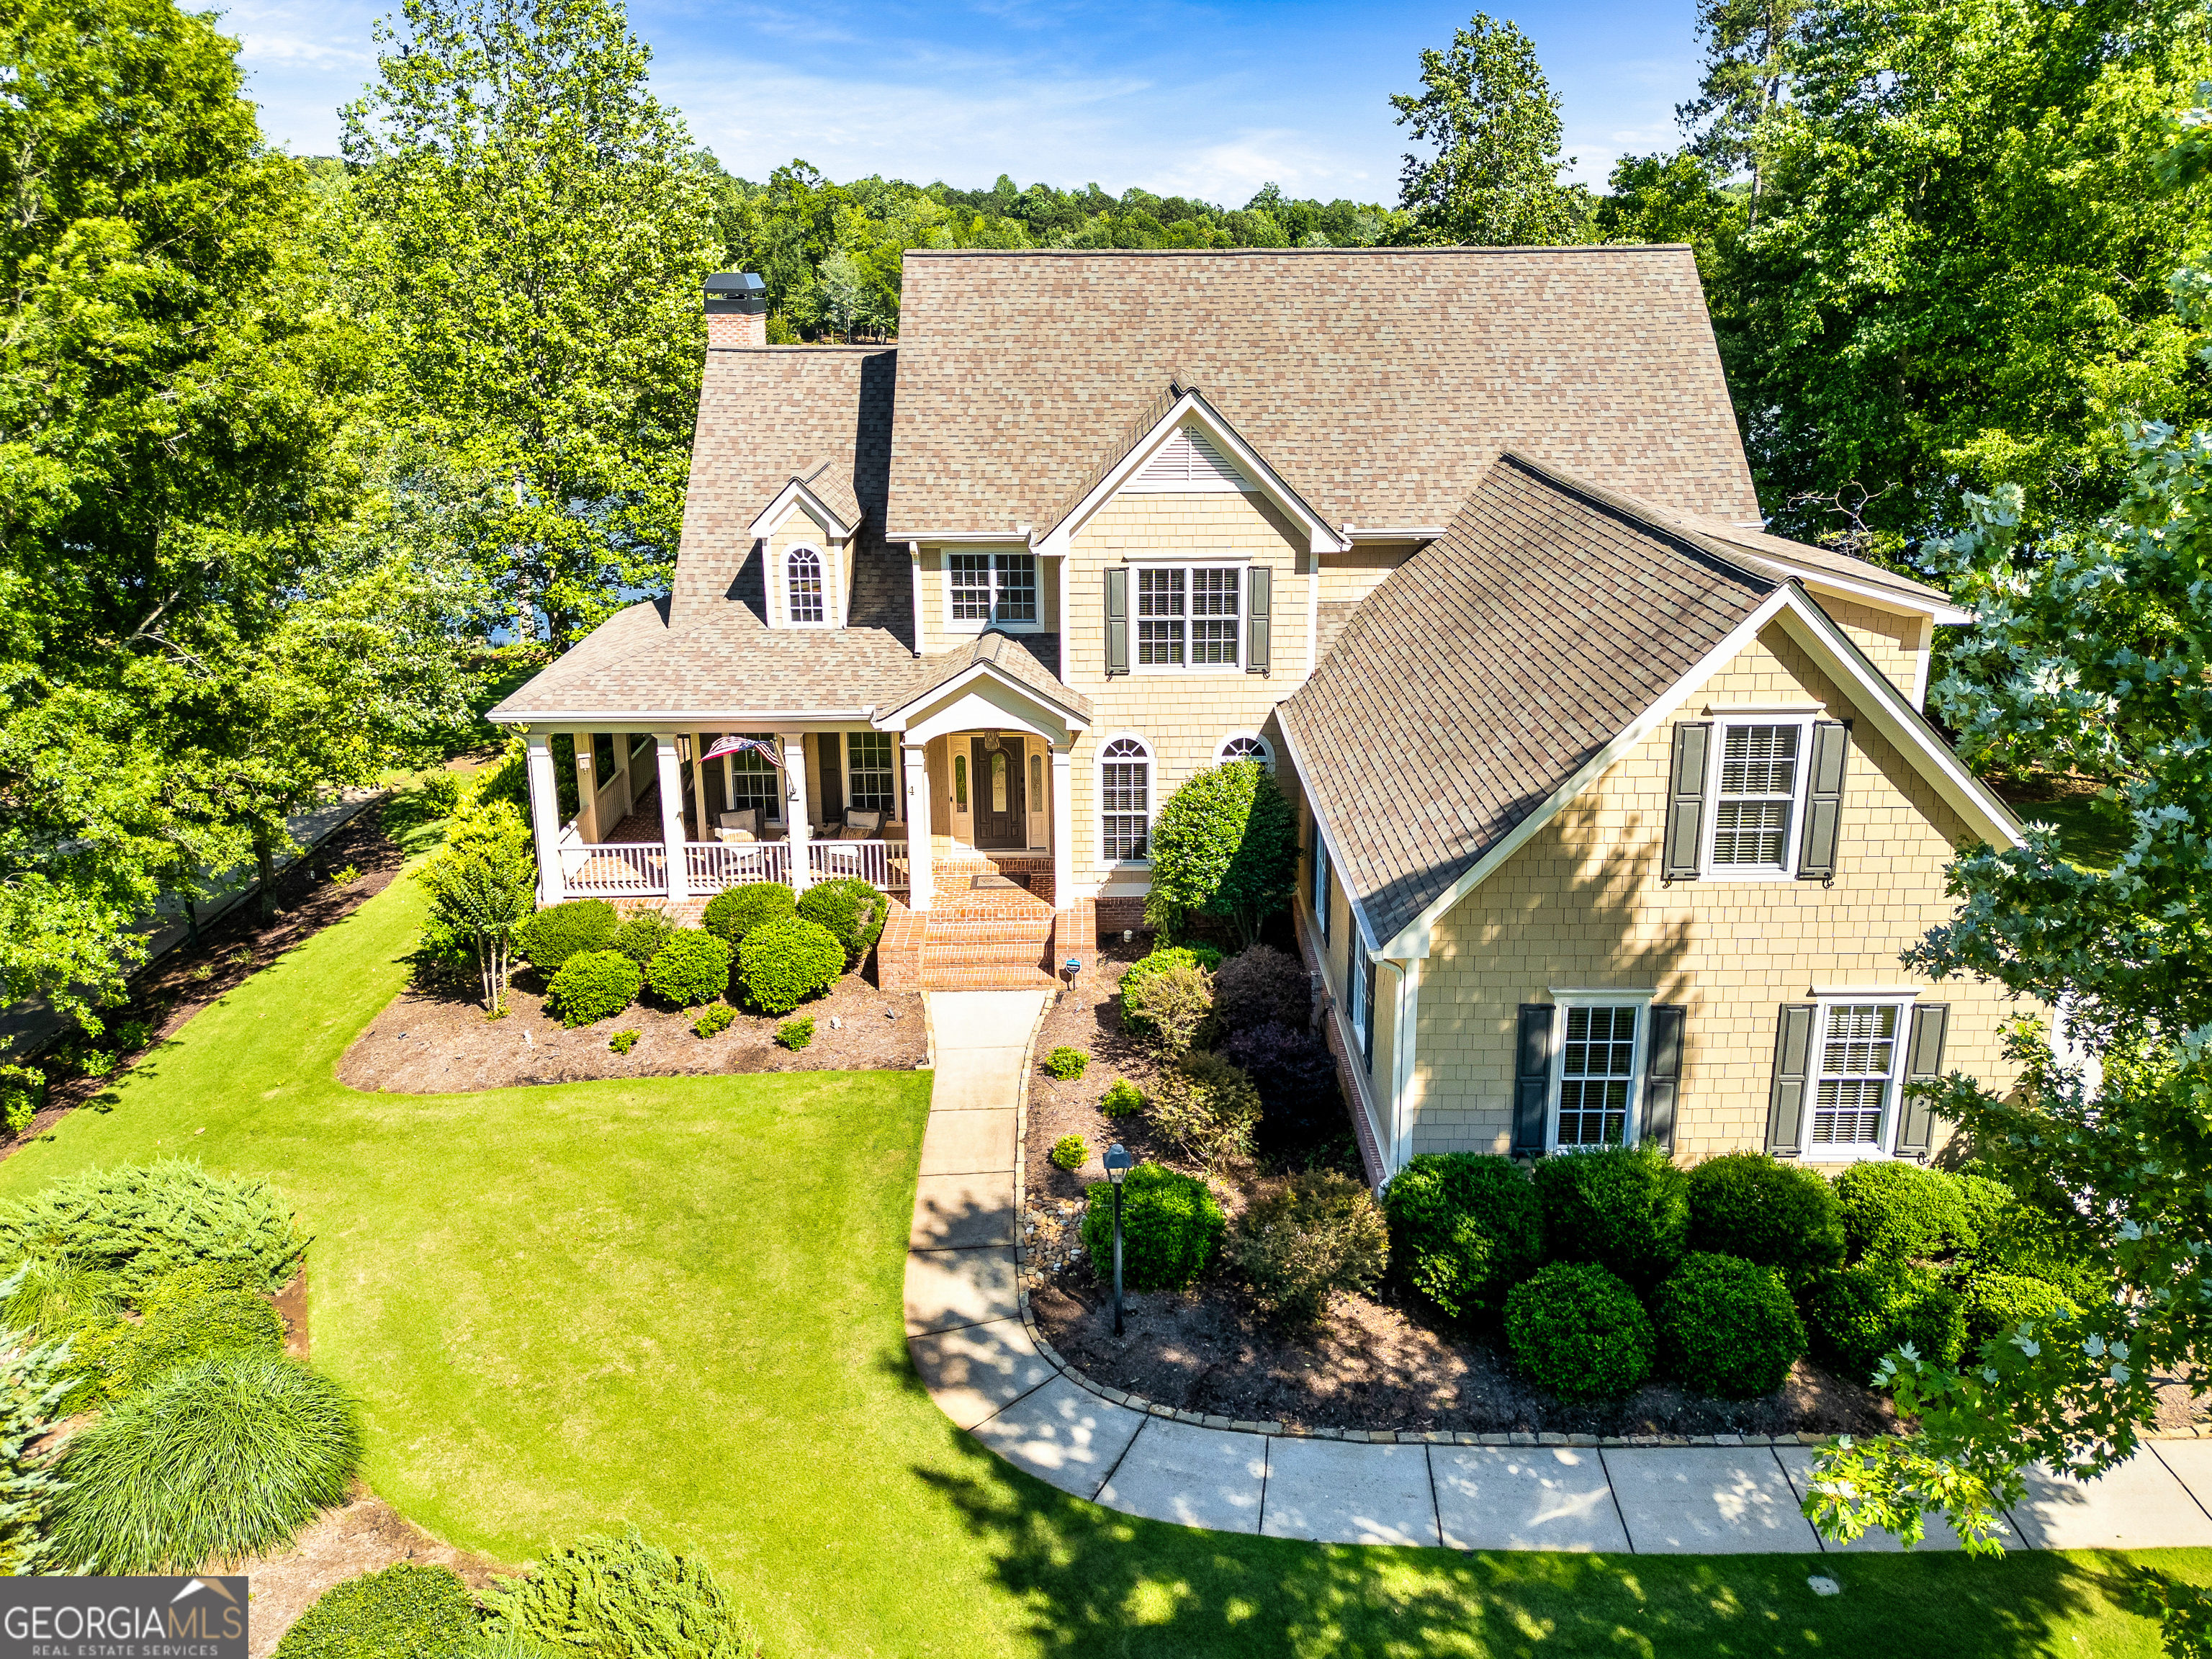
***NEW PRICE***Discover exceptional lakefront living in the highly sought-after Lake Shore section of Summergrove, just minutes from premier shopping, Piedmont Hospital, and I-85. This stunning home offers approximately 5,336 square feet of beautifully finished space, including a primary suite on the main level and a fully finished terrace level, all designed to showcase panoramic views of Lake Summergrove. A gorgeous leaded glass entry door welcomes you into a sunlit foyer with rich hardwood flooring that flows seamlessly throughout the main level. The elegant formal dining room is appointed with coffered ceilings, picture frame molding, and arched windows, creating a sophisticated setting for entertaining. The home office features a beamed ceiling, wainscoting, and French doors, along with pocket doors that open to the great room-offering privacy and versatility. Step into the vaulted great room, where a wall of windows frames breathtaking lake views. A handsome stone fireplace with gas logs, raised hearth, and built-in cabinetry adds warmth and character. Perfect for hosting, the oversized deck extends the living space outdoors. Inside, the adjacent gourmet kitchen impresses with coffered ceilings, recessed lighting, exotic granite countertops, a large center island, and furniture-grade cabinetry with ample deep drawers. Stainless steel appliances-all included-feature a French door refrigerator, gas range with vented hood, and pot filler. The large breakfast room offers yet another picturesque view of the lake. The main-level primary suite offers a peaceful lakeside retreat, complete with a spa-inspired ensuite bath featuring dual vanities with exotic granite, a jetted tub, separate shower, Toto bidet, private water closet, and a spacious walk-in closet. A well-appointed laundry room with custom cabinetry and a utility sink completes the main level. Upstairs, you'll find two ensuite bedrooms and a third bedroom with three closets, which shares a hall bath with the expansive bonus room-complete with a wet bar and wine cooler, ideal for play, media, or guest quarters. The tiled terrace level was built with entertaining and lifestyle in mind, offering a billiard room with wet bar and refrigerator, a cozy den with access to a covered patio overlooking the lake, a full bath, exercise room, and four additional storage areas. Additional features include a three-car side-entry garage, a meticulously maintained Zoysia lawn, a tranquil koi pond, and countless custom upgrades throughout. This exceptional home is a rare opportunity to own lakefront luxury in one of Newnan's most desirable communities.
Build Your Team
Quickly find investor-friendly professionals who can help you succeed in real estate investing at any stage of the investing journey.


Agents
Match with investor-friendly agents who can help you find, analyze, and close your next deal


Lenders
Get the best funding…find investor-friendly lenders who specialize in your deal strategy


Property Managers
Transition to passive investing. Find a trusted property management partnership that lasts.


Tax Pros & Accountants
Taxes and financial reporting made easy—find experts to create tax savings strategies, file taxes, and more
Location
Property Details
Parking
- Description: Attached, Garage Door Opener, Garage, Kitchen Level, Side/Rear Entrance
- Details: Attached, Garage, Garage Door Opener, Kitchen Level
- Garage Spaces: 3
- Spaces Total: 3
Bedroom Information
- # of Bedrooms: 4
Bathroom Information
- # of Baths (Full): 5
- # of Baths (Partial): 1
- # of Baths (Total): 0.0
Interior Features
- # of Stories: 3
- Basement: Yes
- Basement Description: Daylight, Exterior Entry, Finished, Full, Interior Entry
- Fireplace: Yes
Exterior Features
- Exterior Walls Materials: Fiber cement siding (Hardi-board/Hardi-plank
- Foundation: Slab
- Roof Type: Gable
- Roof Material: Composition
HOA
- Has HOA: Yes
- HOA Fee: $875/annually
Land Information
- Land Use: Residential
- Land Use Subtype: Single Family Residential
Lot Information
- Parcel ID: SG6181
- Lot Size: 0 sqft
Property Information
- Property Type: Single Family Residence
- Style: Traditional
- Year Built: 2006
Tax Information
- Annual Tax: $7,934
Utilities
- Water & Sewer: Public
- Heating: Heat Pump, Central, Forced Air, Natural Gas, Zoned
- Cooling: Ceiling Fan(s), Central Air, Electric, Heat Pump, Zoned
Location
- County: Coweta
Investment Summary
- Monthly Cash Flow
- -$3,806
- Cap Rate
- 2.1%
- Cash-on-Cash Return
- -17.7%
- Debt Coverage Ratio
- 0.34
- Internal Rate of Return (5 years)
- -13.1%
Cash Flow
Net Operating Income (NOI) minus mortgage payments.
Calculation:
NOI - Mortgage Payments
Cap Rate (Market Value)
Capitalization Rate is a rate of return that compares the yearly Net Operating Income (NOI) to the market value.
Calculation:
NOI / Market Value
Cash-on-Cash Return (CoC)
Annual Cash Flow / Cash Invested
Calculation:
Annual cash flow divided by initial cash invested.
Debt Coverage Ratio (DCR)
Net Operating Income (NOI) divided by total debt payments.
Calculation:
NOI / Total Debt Payments
Internal Rate of Return (IRR)
A metric for assessing profitability over time. IRR is the discount rate at which the net present value (NPV) of all future cash flows (positive and negative) from an investment equals zero — including both periodic cash flow (such as rent) and a projected sale at the end of the holding period. It represents the expected annualized return, accounting for income, expenses, and the recovery of capital through a future sale.
Purchase Details
Purchase PriceThe price paid for the property. Purchase price:
| $1,125,000 |
|---|---|
Amount FinancedThe amount of the purchase financed through a loan. Amount financed:
| -$900,000 |
Down paymentThe initial payment made towards the purchase. Down payment:
| $225,000 |
Closing CostsFees and expenses associated with purchasing a property, typically ranging from 2% to 5% of the home’s purchase price, paid at the end of a home purchase to cover services like lending, title transfer, and taxes. Closing costs:
| $33,750 |
Rehab CostsCosts incurred to repair or improve the property, including: roof, flooring, exterior siding, kitchen, exterior paint, bathrooms, etc. Rehab costs:
| $0 |
Initial Cash InvestedThe total initial cash invested in the property. Calculation:Down payment + Buying costs + Rehab costs Initial cash invested:
| $258,750 |
Square Feet (SQFT)The total square footage of the property. Square feet:
| 5,336 |
Cost Per Square FootCost per square foot of the property. Calculation:Purchase Price / Square Feet Cost per square foot:
| $211 |
Monthly Rent Per Square FootMonthly rent divided by the number of square feet. This ratio helps investors compare rental income efficiency across properties, markets, and unit sizes Calculation:Monthly Rent / Square Feet Monthly rent per square foot:
| $0.73 |
Financing Details
Loan AmountThe total sum of money borrowed from a lender to finance a property purchase. Calculation:Purchase Price - Down Payment
Loan amount:
| $900,000 |
|---|---|
Loan to Value Ratio (LTV)Loan amount divided by the market value of the property. Calculation:Loan Amount / Market Value
Loan to value ratio:
| 80.0% |
Loan TypeThe type of loan (e.g., fixed, adjustable).
Loan type:
| Amortizing |
TermThe loan repayment period in years.
Term:
| 30 years |
Interest RateThe percentage a lender charges on the borrowed amount of a loan, determining the cost of borrowing money.
Interest rate:
| 6.625% |
Principal & Interest (PI)The principal is the portion of the loan payment that reduces the loan balance. The interest is the lender's charge for borrowing money. Calculation:(P * r * (1 + r) ** n) / ((1 + r) ** n - 1) Where:
P = Loan amount (principal)
Principal & interest:
| $5,763 |
Property TaxesAnnual taxes levied by local governments on real estate properties. These taxes fund public services like schools, roads, and emergency services.
Property tax:
| $661 |
InsuranceThe costs for insurance coverage to protect against financial losses due to risks like fire, natural disasters, theft, liability, or tenant-related damages. Calculation:Assumes 7% of gross rental income, unless insurance rates are specified.
Insurance:
| $273 |
Private Mortgage Insurance (PMI)A fee that borrowers pay when they take out a conventional loan with a loan-to-value (LTV) ratio above 80%.
Private mortgage insurance (PMI):
| $0 |
Monthly PaymentThe fixed amount a borrower pays each month to repay a loan. It typically includes principal and interest (P&I) and may also cover property taxes, insurance, HOA fees, and PMI if escrowed. Monthly payment:
| $6,697 |
Operating Income
| % Rent | Monthly | Yearly | |
|---|---|---|---|
Gross RentThe total rental income received from tenants before deducting any expenses. Includes base rent, late fees, pet fees, parking fees, and other recurring charges.
Gross rent:
| $3,900 | $46,800 | |
Vacancy LossExpected loss of rent due to vacancies.
Vacancy loss:
(6%)
| 6% | -$234 | -$2,808 |
Operating IncomeGross rental income minus vacancy loss. Calculation:Gross rent - Vacancy loss
Operating income:
| $3,666 | $43,992 |
Operating Expenses
| % Rent | Monthly | Yearly | |
|---|---|---|---|
Property TaxesAnnual taxes levied by local governments on real estate properties. These taxes fund public services like schools, roads, and emergency services. | 17% | -$661 | -$7,934 |
InsuranceThe costs for insurance coverage to protect against financial losses due to risks like fire, natural disasters, theft, liability, or tenant-related damages. Calculation:Assumes 7% of gross rental income, unless insurance rates are specified. | 7% | -$273 | -$3,276 |
Property ManagementThe costs associated with hiring a property manager to handle the day-to-day operations of a rental property. Includes management fees, leasing fes, eviction fees, etc. Calculation:Assumes 8% of gross rental income. | 8% | -$312 | -$3,744 |
Repairs & MaintenanceOngoing costs for routine upkeep and minor fixes needed to keep a property in good working condition. Calculation:Assumes 5% of gross rental income. Varies by property age and condition. | 5% | -$195 | -$2,340 |
Capital ExpensesLarge, infrequent costs for major improvements or replacements, like a new roof, HVAC system, or appliances. Calculation:Assumes 5% of gross rental income. Varies by property age. | 5% | -$195 | -$2,340 |
HOA FeesRegular dues paid to a Homeowners Association for community maintenance, amenities, and management. Similar fees include: Condo Association Fees, Co-op Maintenance Fees, etc. | 2% | -$73 | -$876 |
Operating ExpensesRecurring costs required to maintain and manage a rental property, including property taxes, insurance, maintenance, repairs, utilities (if paid by the owner), property management fees, and other day-to-day expenses. Calculation:Insurance + Property Taxes + Property Management + Repairs & Maintenance + Capital Expenditures + HOA Fees | 44% | -$1,709 | -$20,510 |
Cash Flow
| Monthly | Yearly | |
|---|---|---|
Net Operating Income (NOI)The income generated from a property after deducting all operating expenses but before deducting mortgage payments, taxes, and capital expenditures. Calculation:Gross Operating Income - Operating Expenses
Net operating income:
| $1,957 | $23,484 |
Mortgage PaymentThe fixed amount a borrower pays each month to repay a loan. It typically includes principal and interest (P&I) and may also cover property taxes, insurance, HOA fees, and PMI if escrowed. | -$5,763 | -$69,156 |
Cash FlowNet Operating Income (NOI) minus mortgage payments. Calculation:NOI - Mortgage Payments | $3,806 | $45,672 |