$515,000
Investment Summary
- Monthly Cash Flow
- -$1,268
- Cap Rate
- 3.2%
- Cash-on-Cash Return
- -12.8%
- Debt Coverage Ratio
- 0.52
- Internal Rate of Return (5 years)
- -8.4%
Cash Flow
Net Operating Income (NOI) minus mortgage payments.
Calculation:
NOI - Mortgage Payments
Cap Rate (Market Value)
Capitalization Rate is a rate of return that compares the yearly Net Operating Income (NOI) to the market value.
Calculation:
NOI / Market Value
Cash-on-Cash Return (CoC)
Annual Cash Flow / Cash Invested
Calculation:
Annual cash flow divided by initial cash invested.
Debt Coverage Ratio (DCR)
Net Operating Income (NOI) divided by total debt payments.
Calculation:
NOI / Total Debt Payments
Internal Rate of Return (IRR)
A metric for assessing profitability over time. IRR is the discount rate at which the net present value (NPV) of all future cash flows (positive and negative) from an investment equals zero — including both periodic cash flow (such as rent) and a projected sale at the end of the holding period. It represents the expected annualized return, accounting for income, expenses, and the recovery of capital through a future sale.
Property Description
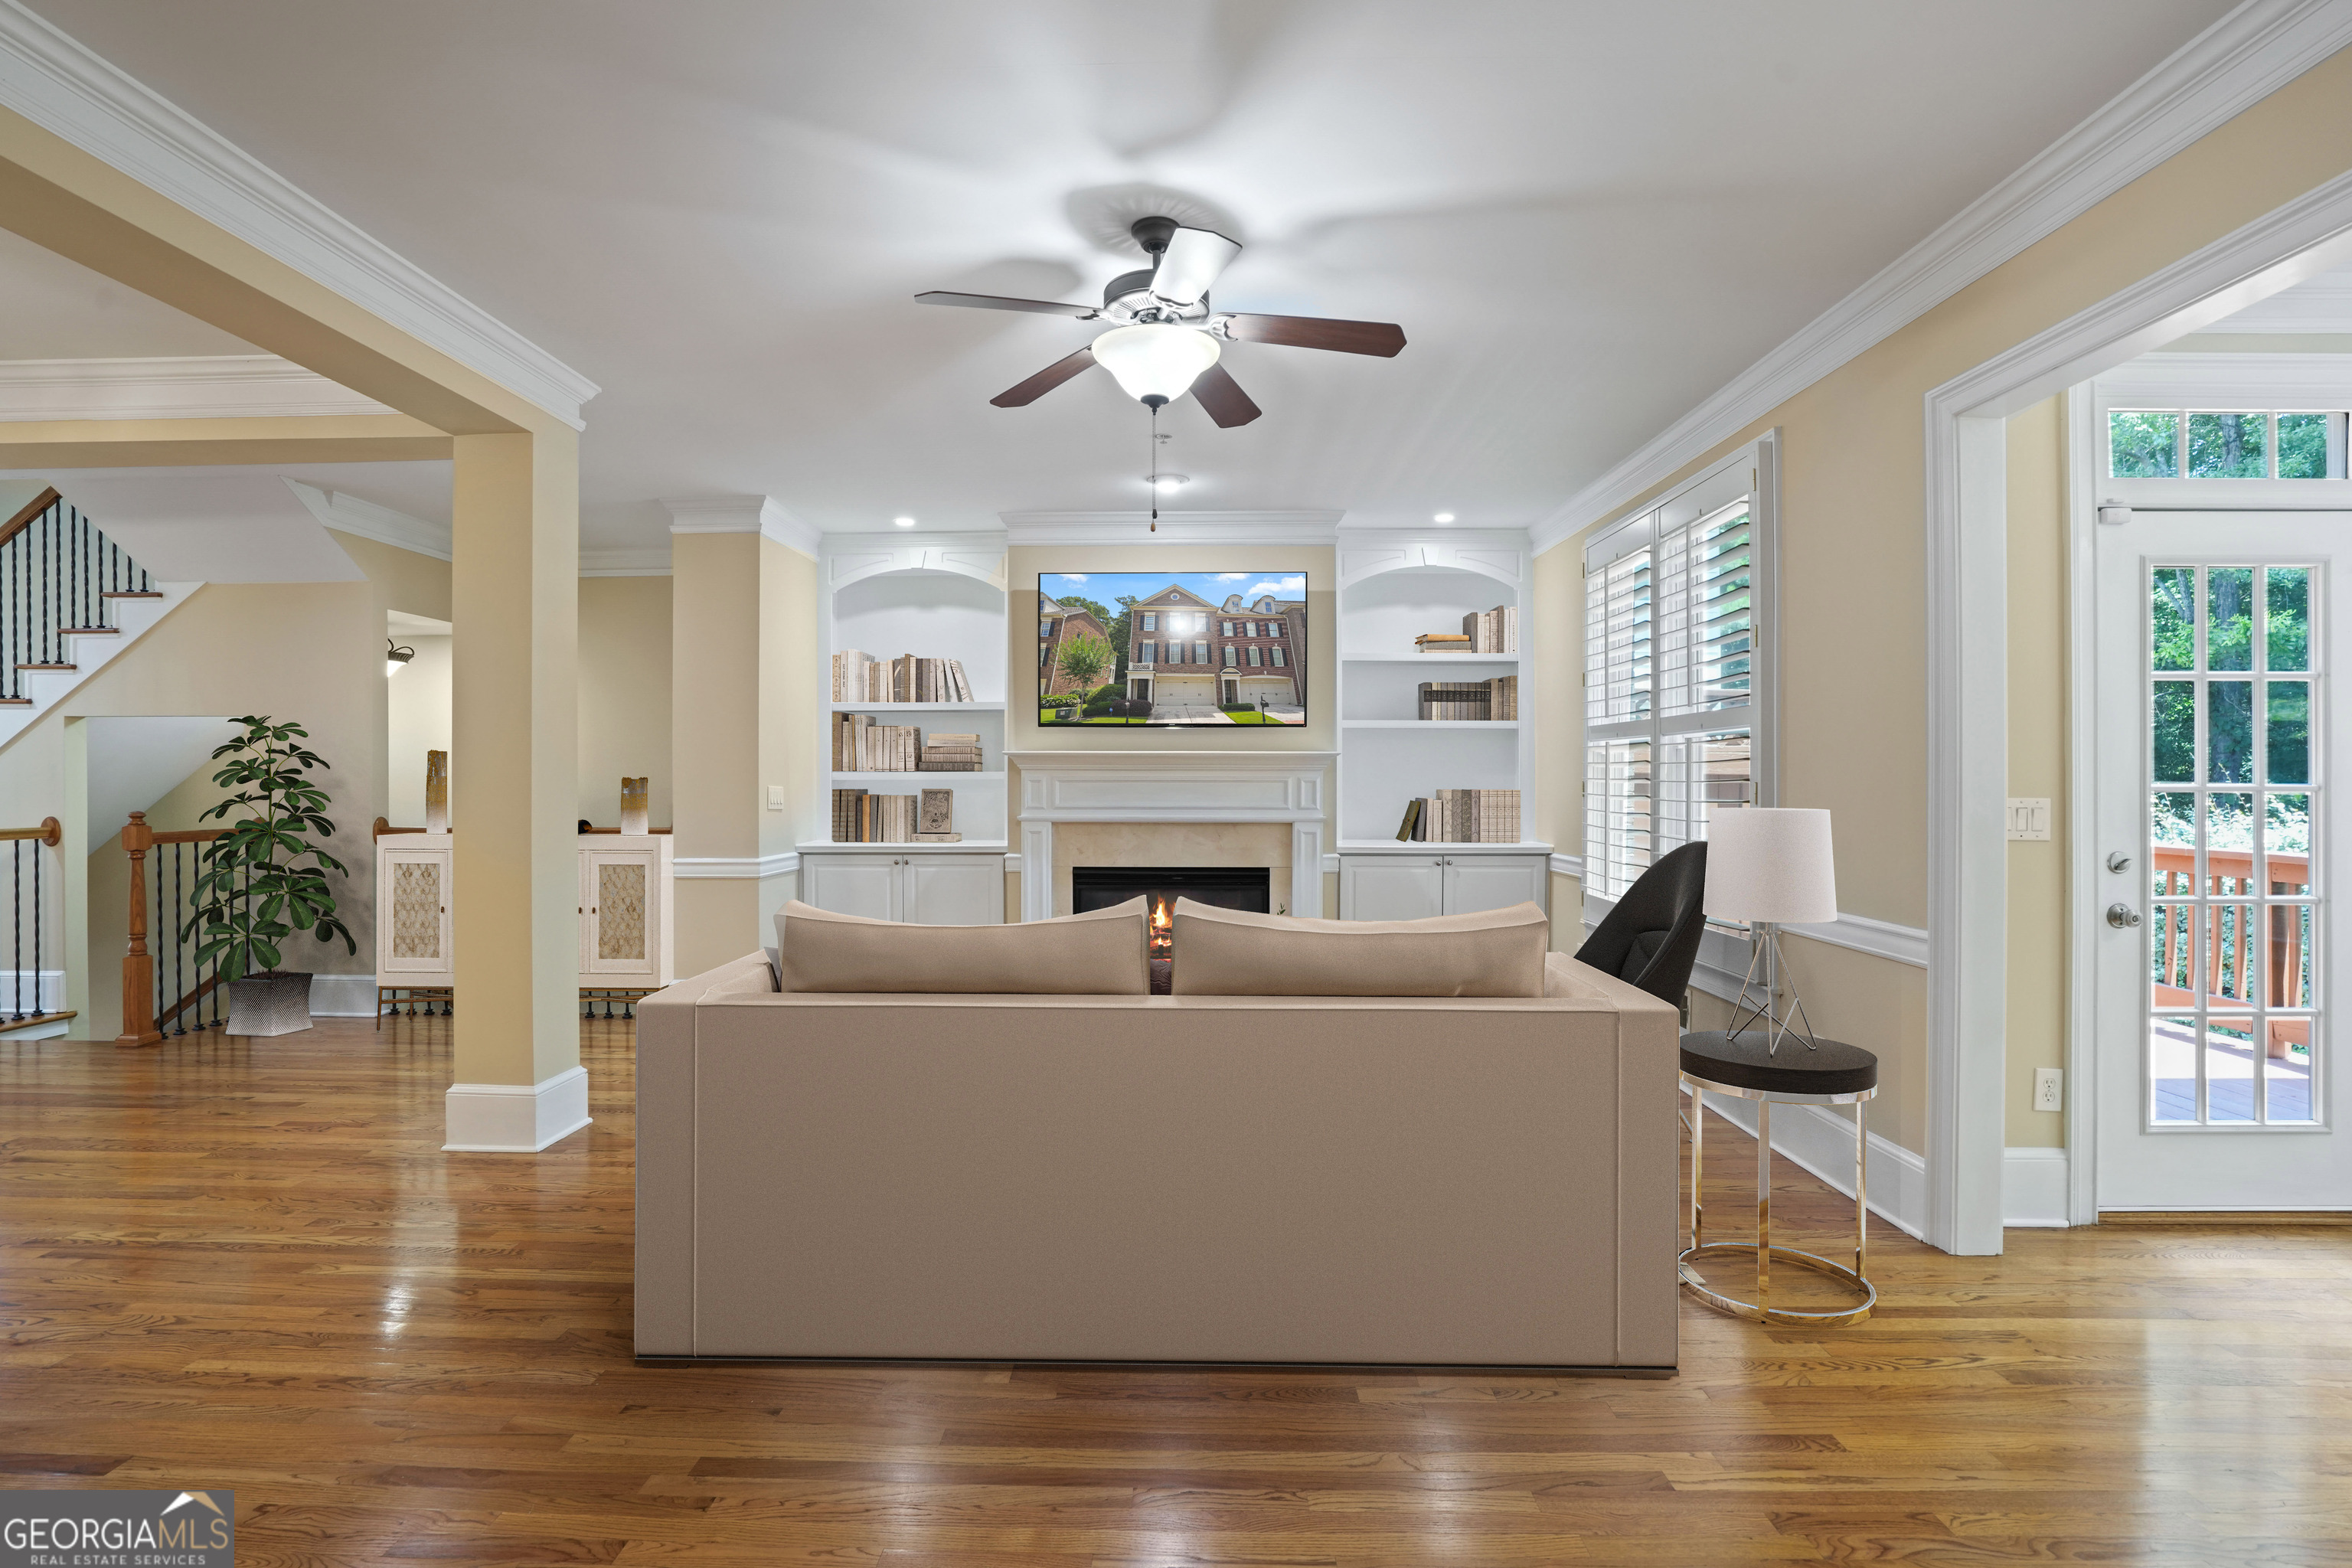
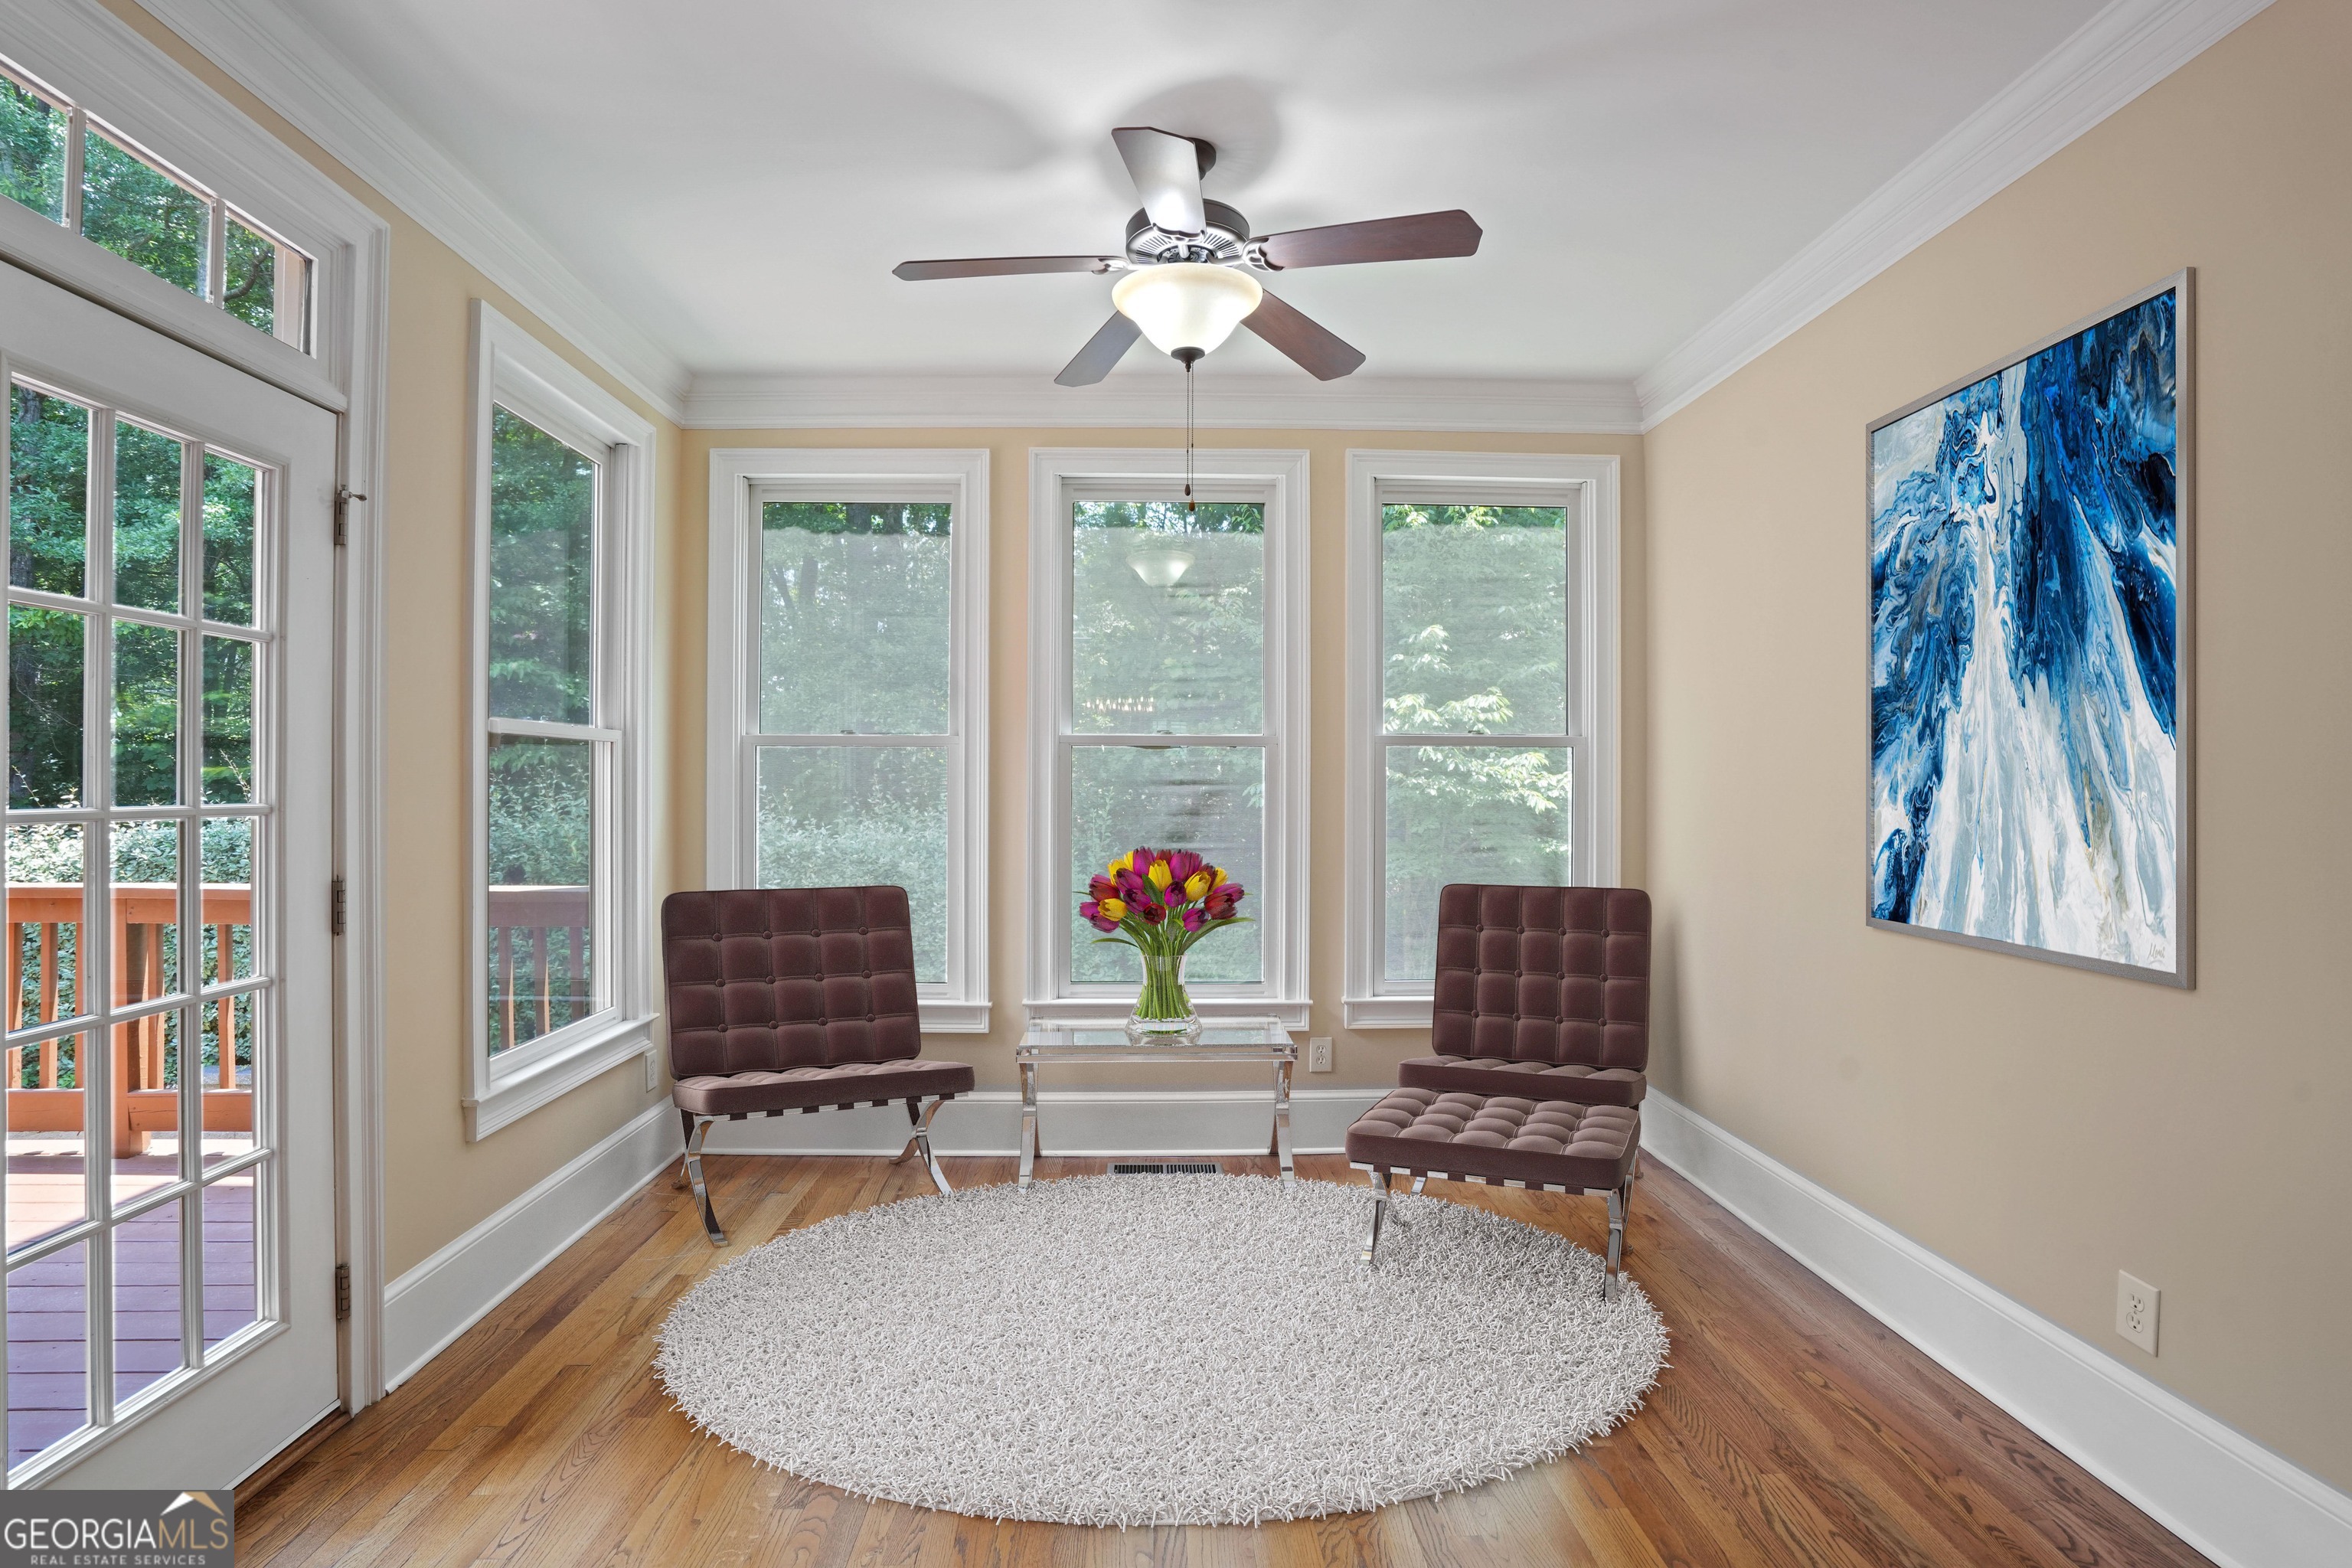
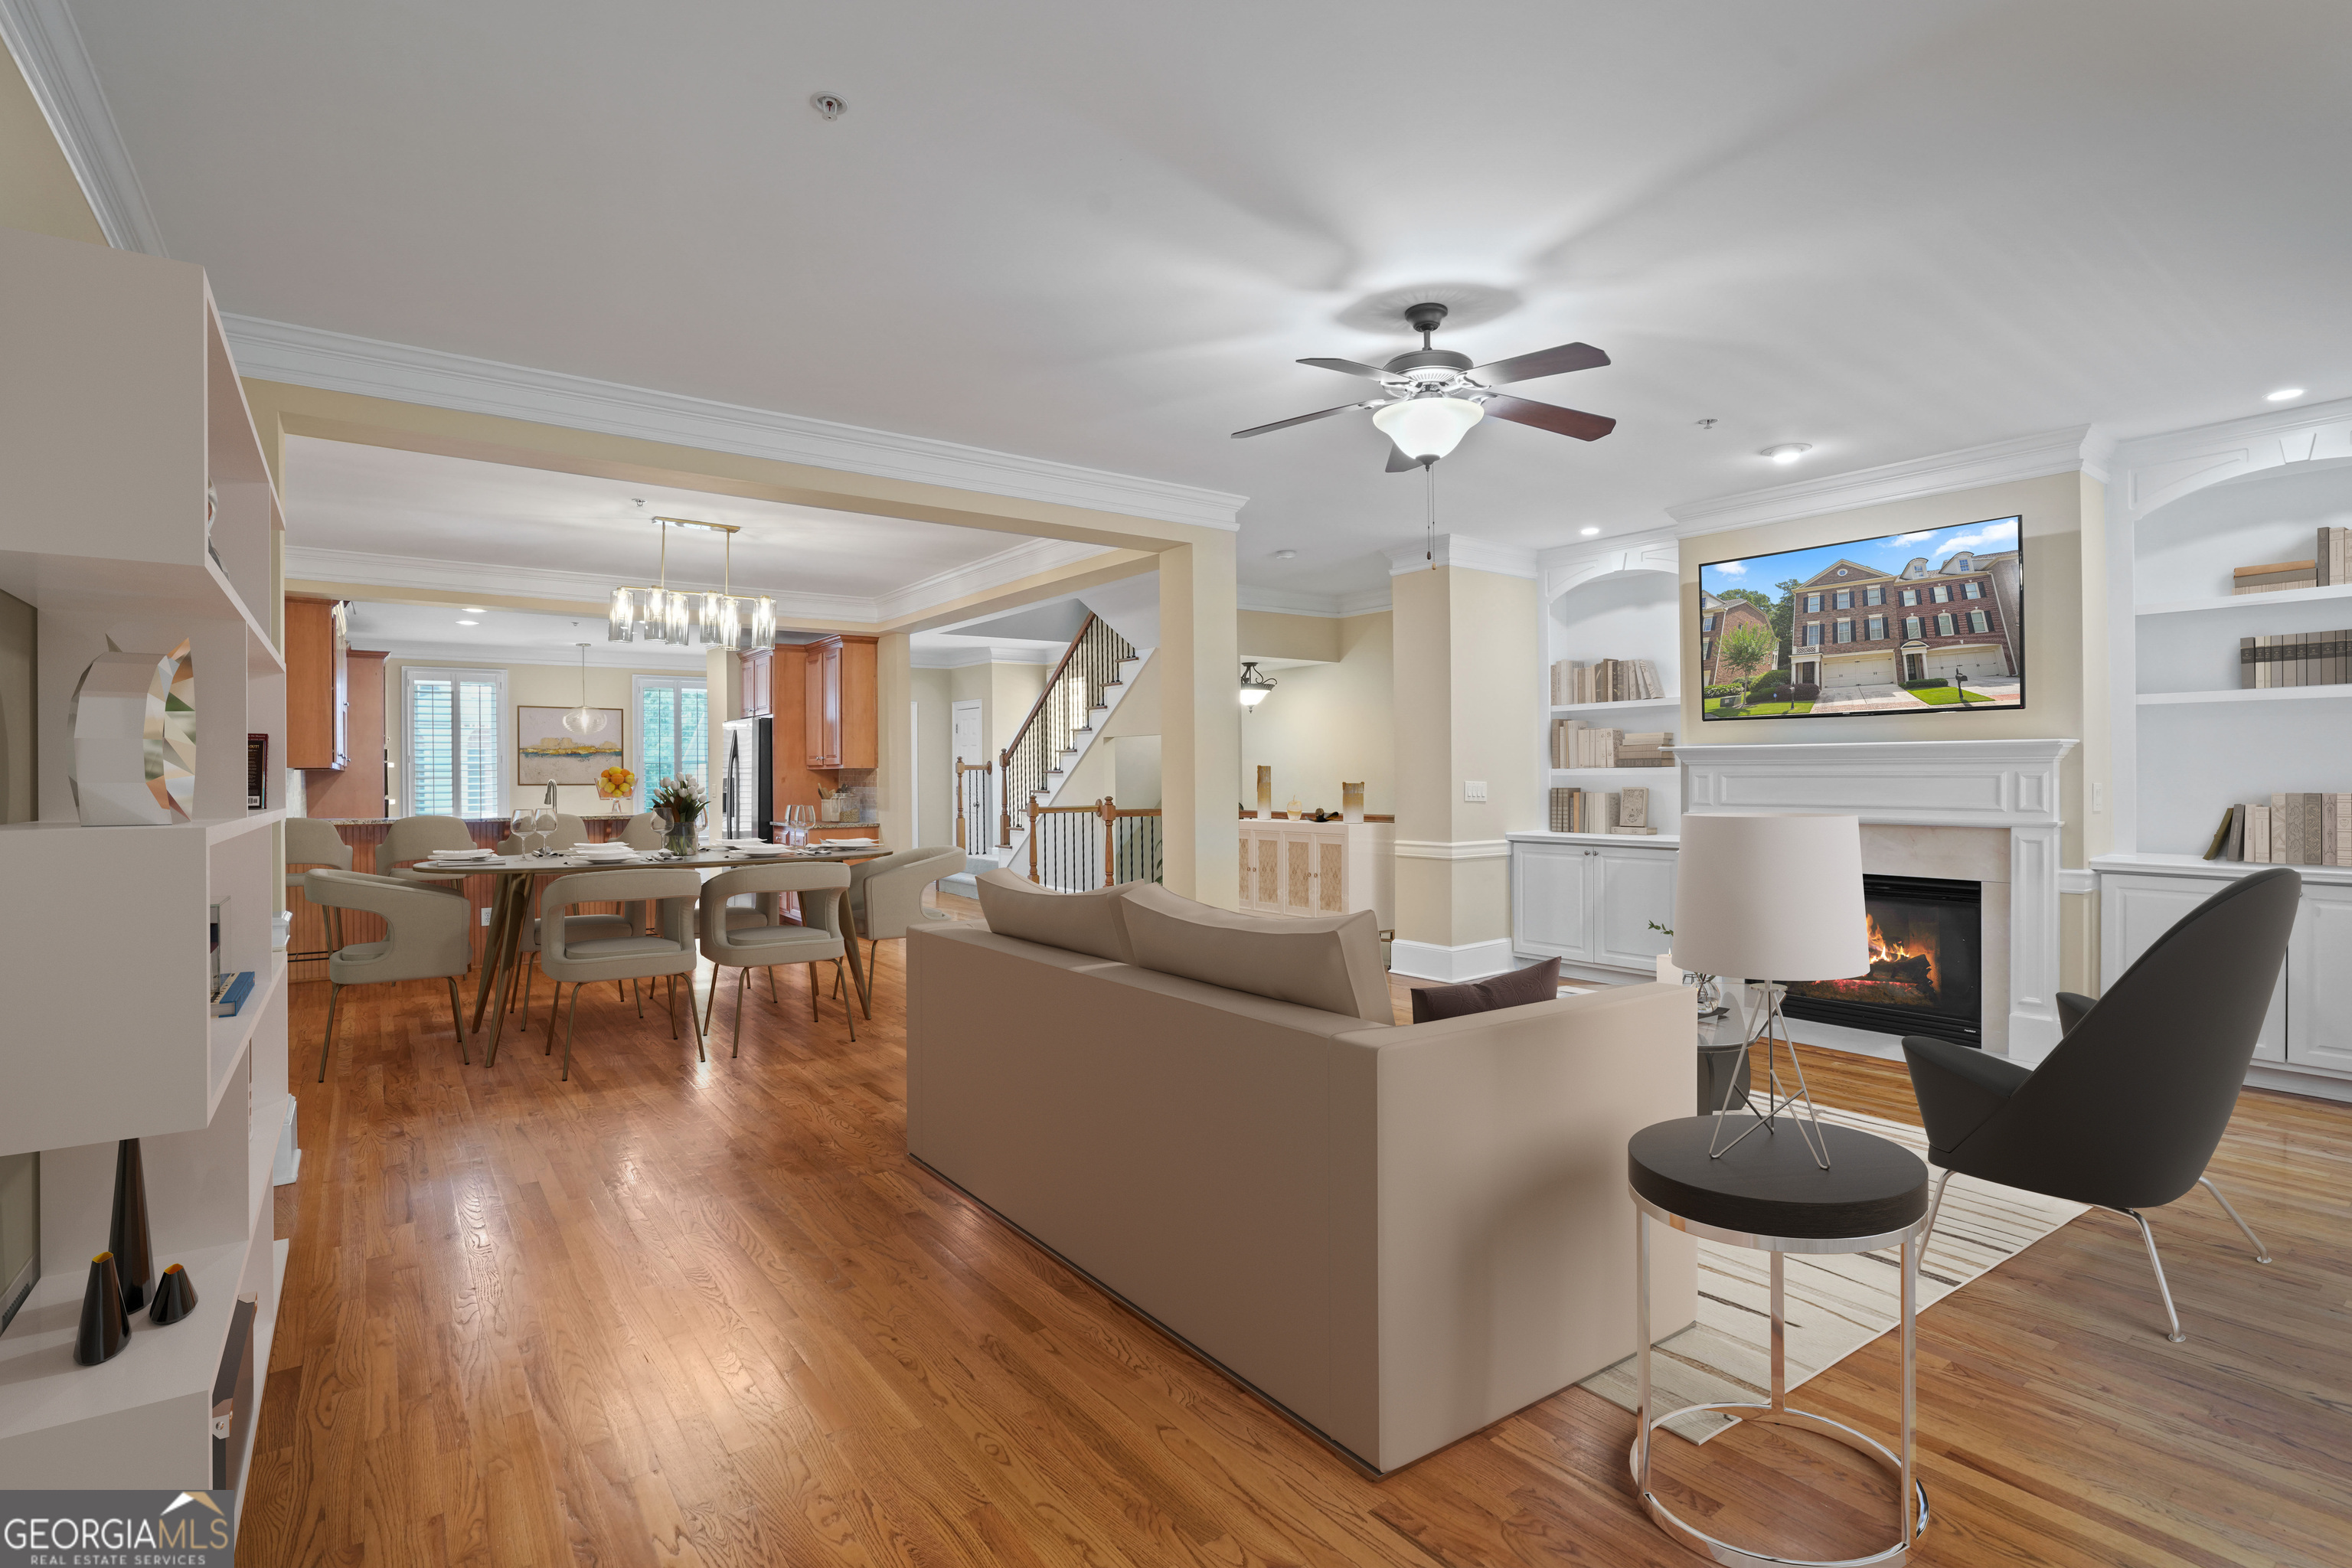
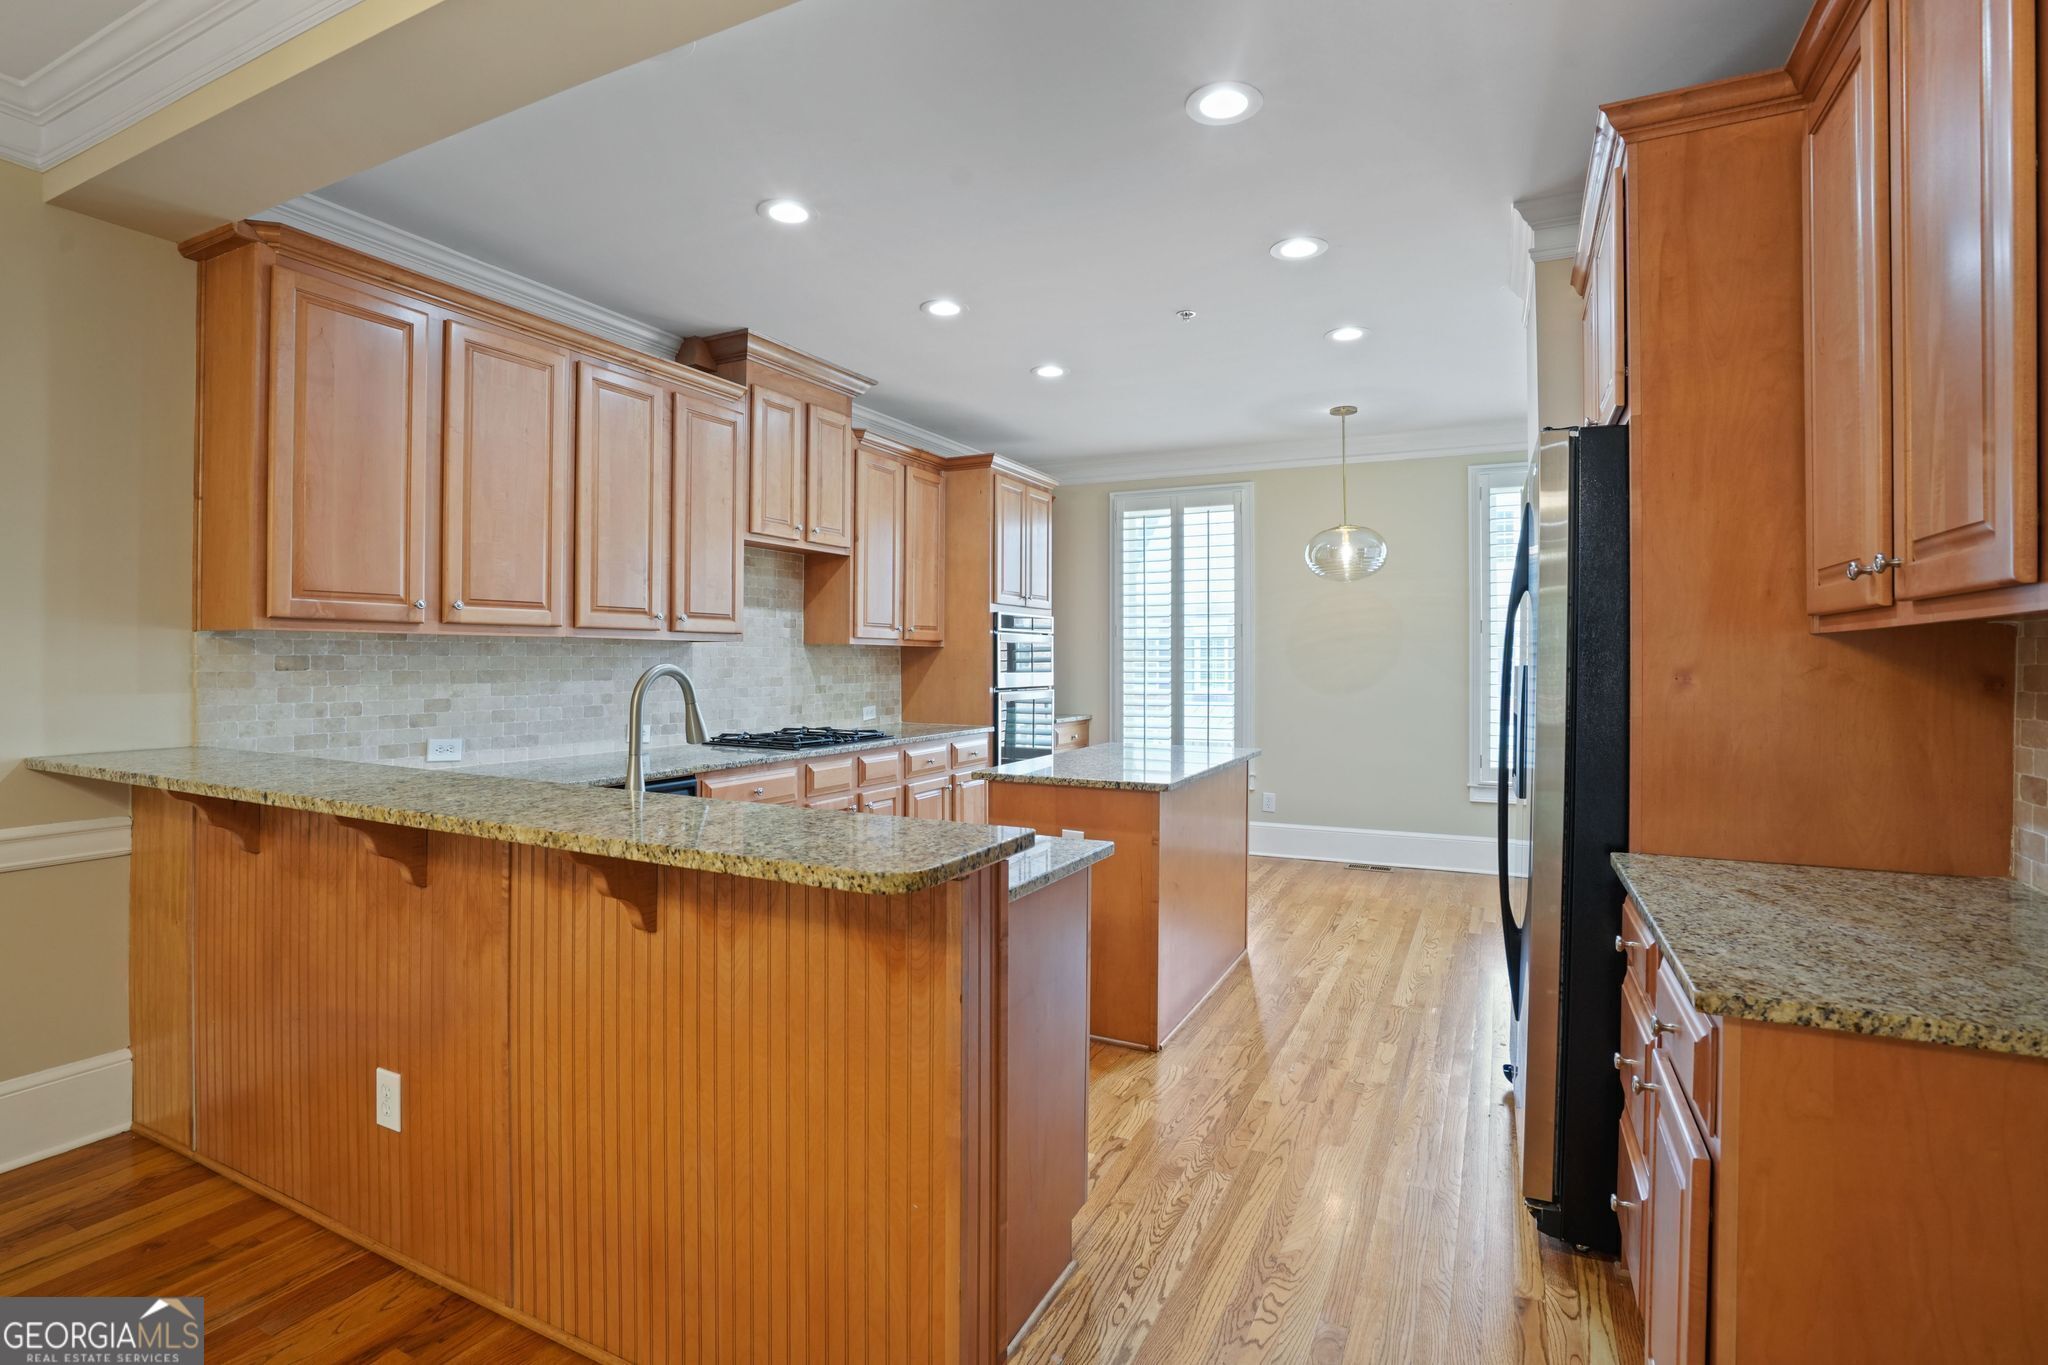
Back on the market with improved price! This immaculately maintained, 3-story end-unit townhome is nestled in the highly sought-after, John Wieland built, 35 homes, gated community of The Cove at Vinings Estates. This 4 bedroom, 3.5 bath townhome offers an abundance of space, custom touches, 9-10 foot ceilings, and fresh paint throughout. As you step onto the main level, you'll be greeted by a huge, inviting open-concept living space with beautiful, solid hardwood floors and elegant crown molding throughout the main level. This entire floor is perfect for everyday living as well as entertaining family and friends. Plantation shutters and column accents add a touch of sophistication to the space. The large living room features a cozy fireplace, built-in shelves and built-in speakers; perfect for entertaining at home. Prepare meals and memories in the gourmet kitchen boasting granite countertops, a spacious island, stainless steel appliances, gas cooktop, double oven-style oven / microwave, refrigerator, custom stained cabinetry, pantry, breakfast bar and breakfast room. The formal dining room, opens to the living room and kitchen and is perfect for hosting dinner parties. On the main level, you'll also find a convenient half bath and a sunroom that provides access to the deck with wooded backyard views for privacy, ideal for morning coffee or al fresco dining. Retreat to the luxurious primary suite on the upper level, complete with vaulted ceilings, a separate sitting area that can double as a nursery or office, and a spa-like en-suite bath featuring dual vanities, a large soaking tub, separate glass enclosed shower, and a large walk-in closet. Two spacious secondary bedrooms, with new berber carpet, that share a bath with one having direct en-suite, and the laundry room complete the upper level. The lower terrace level offers a versatile fourth bedroom with a full bath, making it an ideal guest suite, man cave, gym, media room, or home office. The possibilities are endless!! This level also has its own entrance, and access to the two-car garage which has additional storage space. This well-established and vibrant community is conveniently located near the Silver Comet Trail, East/West Connector, and offers easy access to Smyrna/Vinings, shopping, dining and parks. Take the short drive to the Braves Stadium and The Battery with all its entertainment, restaurants and shops, plus Cumberland mall is right there. I-285 making it convenient to downtown Atlanta and the Airport. Complimentary one year membership to the Vinings Estates neighborhood amenities which includes 3 swimming pools, tennis courts and a full fitness center. Home warranty included.
Build Your Team
Quickly find investor-friendly professionals who can help you succeed in real estate investing at any stage of the investing journey.


Agents
Match with investor-friendly agents who can help you find, analyze, and close your next deal


Lenders
Get the best funding…find investor-friendly lenders who specialize in your deal strategy


Property Managers
Transition to passive investing. Find a trusted property management partnership that lasts.


Tax Pros & Accountants
Taxes and financial reporting made easy—find experts to create tax savings strategies, file taxes, and more
Location
Property Details
Parking
- Description: Driveway, Garage, Garage Door Opener, Garage Faces Front, Level Driveway
- Details: Garage, Garage Door Opener
- Garage Spaces: 2
- Spaces Total: 2
Bedroom Information
- # of Bedrooms: 4
Bathroom Information
- # of Baths (Full): 3
- # of Baths (Partial): 1
- # of Baths (Total): 0.0
Interior Features
- # of Rooms: 8
- # of Stories: 3
- Basement: Yes
- Basement Description: Daylight, Exterior Entry, Finished, Full, Interior Entry
- Fireplace: Yes
Exterior Features
- Exterior Walls Materials: Brick
- Foundation: Slab
- Roof Material: Composition
HOA
- Has HOA: Yes
- HOA Fee: $5,016/annually
Land Information
- Land Use: Residential
- Land Use Subtype: Condominium Unit
Lot Information
- Parcel ID: 17039000710
- Lot Size: 0 sqft
Property Information
- Property Type: Townhouse
- Style: Brick Front, Traditional
- Year Built: 2004
Tax Information
- Annual Tax: $5,044
Utilities
- Water & Sewer: Public
- Heating: Central, Forced Air
- Cooling: Ceiling Fan(s), Central Air, Zoned
Location
- County: Cobb
Listing Details
Investment Summary
- Monthly Cash Flow
- -$1,268
- Cap Rate
- 3.2%
- Cash-on-Cash Return
- -12.8%
- Debt Coverage Ratio
- 0.52
- Internal Rate of Return (5 years)
- -8.4%
Cash Flow
Net Operating Income (NOI) minus mortgage payments.
Calculation:
NOI - Mortgage Payments
Cap Rate (Market Value)
Capitalization Rate is a rate of return that compares the yearly Net Operating Income (NOI) to the market value.
Calculation:
NOI / Market Value
Cash-on-Cash Return (CoC)
Annual Cash Flow / Cash Invested
Calculation:
Annual cash flow divided by initial cash invested.
Debt Coverage Ratio (DCR)
Net Operating Income (NOI) divided by total debt payments.
Calculation:
NOI / Total Debt Payments
Internal Rate of Return (IRR)
A metric for assessing profitability over time. IRR is the discount rate at which the net present value (NPV) of all future cash flows (positive and negative) from an investment equals zero — including both periodic cash flow (such as rent) and a projected sale at the end of the holding period. It represents the expected annualized return, accounting for income, expenses, and the recovery of capital through a future sale.
Purchase Details
Purchase PriceThe price paid for the property. Purchase price:
| $515,000 |
|---|---|
Amount FinancedThe amount of the purchase financed through a loan. Amount financed:
| -$412,000 |
Down paymentThe initial payment made towards the purchase. Down payment:
| $103,000 |
Closing CostsFees and expenses associated with purchasing a property, typically ranging from 2% to 5% of the home’s purchase price, paid at the end of a home purchase to cover services like lending, title transfer, and taxes. Closing costs:
| $15,450 |
Rehab CostsCosts incurred to repair or improve the property, including: roof, flooring, exterior siding, kitchen, exterior paint, bathrooms, etc. Rehab costs:
| $0 |
Initial Cash InvestedThe total initial cash invested in the property. Calculation:Down payment + Buying costs + Rehab costs Initial cash invested:
| $118,450 |
Square Feet (SQFT)The total square footage of the property. Square feet:
| 3,232 |
Cost Per Square FootCost per square foot of the property. Calculation:Purchase Price / Square Feet Cost per square foot:
| $159 |
Monthly Rent Per Square FootMonthly rent divided by the number of square feet. This ratio helps investors compare rental income efficiency across properties, markets, and unit sizes Calculation:Monthly Rent / Square Feet Monthly rent per square foot:
| $0.99 |
Financing Details
Loan AmountThe total sum of money borrowed from a lender to finance a property purchase. Calculation:Purchase Price - Down Payment
Loan amount:
| $412,000 |
|---|---|
Loan to Value Ratio (LTV)Loan amount divided by the market value of the property. Calculation:Loan Amount / Market Value
Loan to value ratio:
| 80.0% |
Loan TypeThe type of loan (e.g., fixed, adjustable).
Loan type:
| Amortizing |
TermThe loan repayment period in years.
Term:
| 30 years |
Interest RateThe percentage a lender charges on the borrowed amount of a loan, determining the cost of borrowing money.
Interest rate:
| 6.625% |
Principal & Interest (PI)The principal is the portion of the loan payment that reduces the loan balance. The interest is the lender's charge for borrowing money. Calculation:(P * r * (1 + r) ** n) / ((1 + r) ** n - 1) Where:
P = Loan amount (principal)
Principal & interest:
| $2,638 |
Property TaxesAnnual taxes levied by local governments on real estate properties. These taxes fund public services like schools, roads, and emergency services.
Property tax:
| $420 |
InsuranceThe costs for insurance coverage to protect against financial losses due to risks like fire, natural disasters, theft, liability, or tenant-related damages. Calculation:Assumes 7% of gross rental income, unless insurance rates are specified.
Insurance:
| $224 |
Private Mortgage Insurance (PMI)A fee that borrowers pay when they take out a conventional loan with a loan-to-value (LTV) ratio above 80%.
Private mortgage insurance (PMI):
| $0 |
Monthly PaymentThe fixed amount a borrower pays each month to repay a loan. It typically includes principal and interest (P&I) and may also cover property taxes, insurance, HOA fees, and PMI if escrowed. Monthly payment:
| $3,282 |
Operating Income
| % Rent | Monthly | Yearly | |
|---|---|---|---|
Gross RentThe total rental income received from tenants before deducting any expenses. Includes base rent, late fees, pet fees, parking fees, and other recurring charges.
Gross rent:
| $3,200 | $38,400 | |
Vacancy LossExpected loss of rent due to vacancies.
Vacancy loss:
(6%)
| 6% | -$192 | -$2,304 |
Operating IncomeGross rental income minus vacancy loss. Calculation:Gross rent - Vacancy loss
Operating income:
| $3,008 | $36,096 |
Operating Expenses
| % Rent | Monthly | Yearly | |
|---|---|---|---|
Property TaxesAnnual taxes levied by local governments on real estate properties. These taxes fund public services like schools, roads, and emergency services. | 13% | -$420 | -$5,044 |
InsuranceThe costs for insurance coverage to protect against financial losses due to risks like fire, natural disasters, theft, liability, or tenant-related damages. Calculation:Assumes 7% of gross rental income, unless insurance rates are specified. | 7% | -$224 | -$2,688 |
Property ManagementThe costs associated with hiring a property manager to handle the day-to-day operations of a rental property. Includes management fees, leasing fes, eviction fees, etc. Calculation:Assumes 8% of gross rental income. | 8% | -$256 | -$3,072 |
Repairs & MaintenanceOngoing costs for routine upkeep and minor fixes needed to keep a property in good working condition. Calculation:Assumes 5% of gross rental income. Varies by property age and condition. | 5% | -$160 | -$1,920 |
Capital ExpensesLarge, infrequent costs for major improvements or replacements, like a new roof, HVAC system, or appliances. Calculation:Assumes 5% of gross rental income. Varies by property age. | 5% | -$160 | -$1,920 |
HOA FeesRegular dues paid to a Homeowners Association for community maintenance, amenities, and management. Similar fees include: Condo Association Fees, Co-op Maintenance Fees, etc. | 13% | -$418 | -$5,016 |
Operating ExpensesRecurring costs required to maintain and manage a rental property, including property taxes, insurance, maintenance, repairs, utilities (if paid by the owner), property management fees, and other day-to-day expenses. Calculation:Insurance + Property Taxes + Property Management + Repairs & Maintenance + Capital Expenditures + HOA Fees | 51% | -$1,638 | -$19,660 |
Cash Flow
| Monthly | Yearly | |
|---|---|---|
Net Operating Income (NOI)The income generated from a property after deducting all operating expenses but before deducting mortgage payments, taxes, and capital expenditures. Calculation:Gross Operating Income - Operating Expenses
Net operating income:
| $1,370 | $16,440 |
Mortgage PaymentThe fixed amount a borrower pays each month to repay a loan. It typically includes principal and interest (P&I) and may also cover property taxes, insurance, HOA fees, and PMI if escrowed. | -$2,638 | -$31,656 |
Cash FlowNet Operating Income (NOI) minus mortgage payments. Calculation:NOI - Mortgage Payments | $1,268 | $15,216 |