
$515,000
Investment Summary
- Monthly Cash Flow
- -$582
- Cap Rate
- 4.8%
- Cash-on-Cash Return
- -5.9%
- Debt Coverage Ratio
- 0.78
- Internal Rate of Return (5 years)
- -1.7%
Cash Flow
Net Operating Income (NOI) minus mortgage payments.
Calculation:
NOI - Mortgage Payments
Cap Rate (Market Value)
Capitalization Rate is a rate of return that compares the yearly Net Operating Income (NOI) to the market value.
Calculation:
NOI / Market Value
Cash-on-Cash Return (CoC)
Annual Cash Flow / Cash Invested
Calculation:
Annual cash flow divided by initial cash invested.
Debt Coverage Ratio (DCR)
Net Operating Income (NOI) divided by total debt payments.
Calculation:
NOI / Total Debt Payments
Internal Rate of Return (IRR)
A metric for assessing profitability over time. IRR is the discount rate at which the net present value (NPV) of all future cash flows (positive and negative) from an investment equals zero — including both periodic cash flow (such as rent) and a projected sale at the end of the holding period. It represents the expected annualized return, accounting for income, expenses, and the recovery of capital through a future sale.
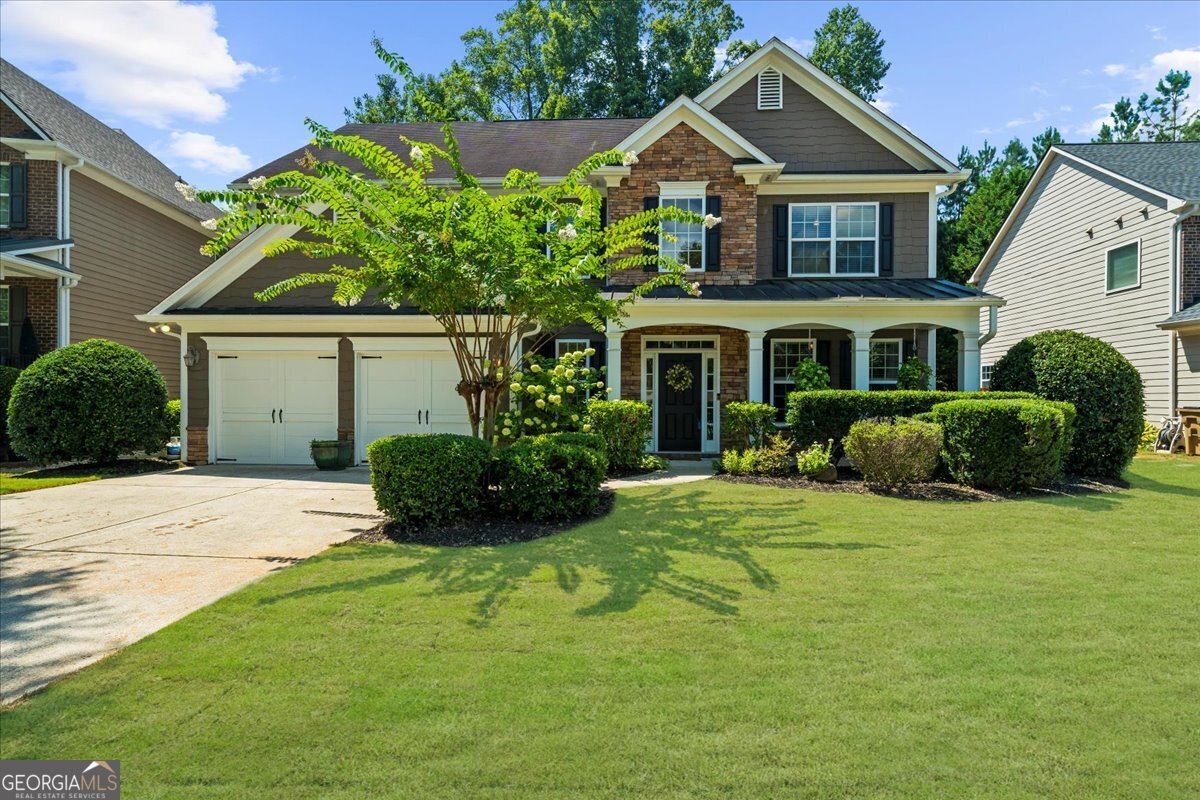
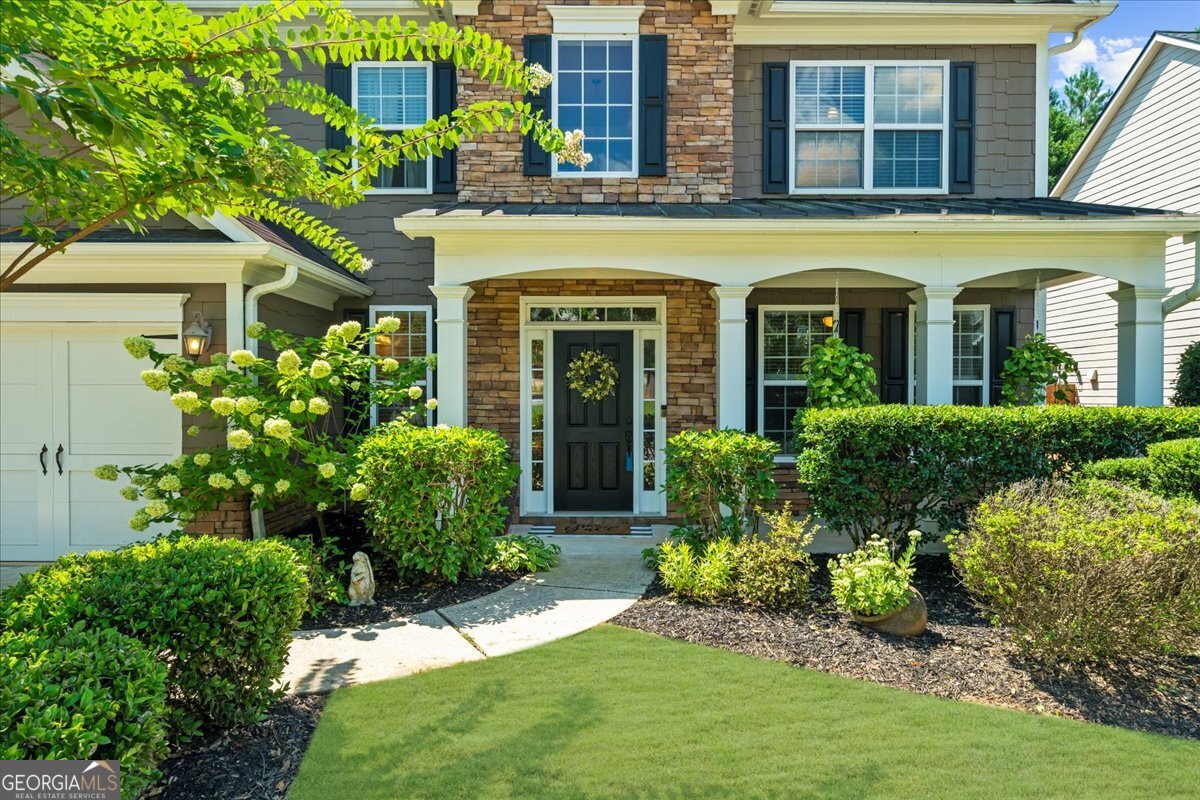
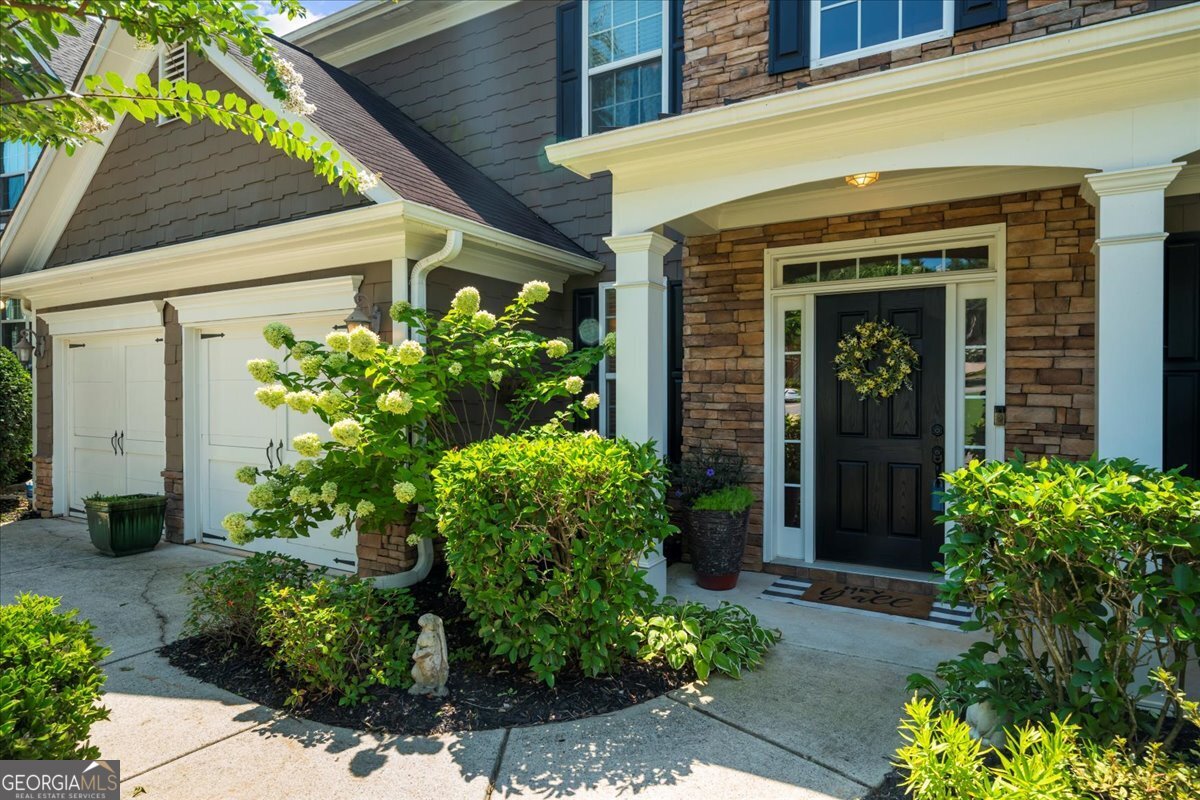
Property Description
INCREDIBLE BUYER OPPORTUNITY! This home has just received a massive price reduction, creating the absolute best deal you'll find in the Maristone community and highly sought-after Denmark High School cluster. The property is in excellent condition with fresh paint, new sod, and updated landscaping. Priced WAY below it's market value. No distress here, just a motivated seller ready to make a deal. Don't miss your chance to move into this premier neighborhood at a fraction of the typical cost. Homes like this don't come around often, and at this price, it won't last long. Schedule your showing today before it's gone! *Welcome to Maristone, where comfort and convenience come together in this meticulously maintained five bedroom, three and a half bathroom haven. Nestled in the heart of Forsyth County's sought after school district, including the esteemed St. John Bosco Academy just down the street, this home offers a perfect blend of elegance and functionality. Approaching the front yard, you'll be captivated by the brand new sod, fresh landscaping, and charming front porch, setting the stage for the warmth and hospitality found within. Step inside to discover a grand 20' entryway with a magnificent chandelier that makes a stunning first impression with hardwood floors that flow throughout. From there you will be met by a gorgeous office area and a spacious dining space, ideal for both work and gatherings. The kitchen is a true standout, boasting an open air concept that seamlessly connects to the beautiful family room featuring thick molding coffered ceilings and custom bookcases, an ideal setting for entertaining guests. The main level has also just been freshly repainted, giving the home an updated and inviting feel. Upstairs, the cozy owner's suite awaits, offering ample space and a vaulted ceiling for added charm. The spacious secondary bedrooms provide great sized closets, abundant natural light, and private bathrooms, ensuring comfort and privacy for all members of the household. A nice surprise the upstairs holds is a second mini master bedroom with an ensuite bathroom and walk in closet that adds versatility, perfect for teens, in laws, or guests. Outside, the backyard beckons with its perfect setup for outdoor entertaining, providing plenty of space for gatherings and relaxation amidst mature landscaping. This home also features a two car garage with built in storage racks, and an upstairs laundry room for added convenience. Enjoy the ease of whole house blinds, a sophisticated in wall pest control system, and a comprehensive two panel alarm system with remote access for peace of mind. Located in the popular Maristone neighborhood, you'll have convenient access to amenities including the Greenway, Fowler Park, The Collections, Halcyon, delicious restaurants, shopping destinations, and top rated schools. Don't miss the opportunity to make Maristone your Home Sweet Home. Schedule a showing today and prepare to fall in love with this exquisite retreat!*
Build Your Team
Quickly find investor-friendly professionals who can help you succeed in real estate investing at any stage of the investing journey.


Agents
Match with investor-friendly agents who can help you find, analyze, and close your next deal


Lenders
Get the best funding…find investor-friendly lenders who specialize in your deal strategy


Property Managers
Transition to passive investing. Find a trusted property management partnership that lasts.


Tax Pros & Accountants
Taxes and financial reporting made easy—find experts to create tax savings strategies, file taxes, and more
Location
Property Details
Parking
- Description: Garage
- Details: Garage
- Garage Spaces: 0
- Spaces Total: 0
Bedroom Information
- # of Bedrooms: 5
Bathroom Information
- # of Baths (Full): 3
- # of Baths (Partial): 1
- # of Baths (Total): 3.5
Interior Features
- # of Stories: 2
- Basement Description: None
- Fireplace: Yes
Exterior Features
- Exterior Walls Materials: Other
- Foundation: Slab
- Roof Material: Other
HOA
- Has HOA: Yes
- HOA Fee: $1,000/annually
Land Information
- Land Use: Residential
- Land Use Subtype: Single Family Residential
Lot Information
- Parcel ID: 085071
- Lot Size: 0 sqft
Property Information
- Property Type: Single Family Residence
- Style: Brick Front, Craftsman, Traditional
- Year Built: 2006
Tax Information
- Annual Tax: $833
Utilities
- Water & Sewer: Public
- Heating: Central
- Cooling: Ceiling Fan(s), Central Air
Location
- County: Forsyth
Listing Details
Investment Summary
- Monthly Cash Flow
- -$582
- Cap Rate
- 4.8%
- Cash-on-Cash Return
- -5.9%
- Debt Coverage Ratio
- 0.78
- Internal Rate of Return (5 years)
- -1.7%
Cash Flow
Net Operating Income (NOI) minus mortgage payments.
Calculation:
NOI - Mortgage Payments
Cap Rate (Market Value)
Capitalization Rate is a rate of return that compares the yearly Net Operating Income (NOI) to the market value.
Calculation:
NOI / Market Value
Cash-on-Cash Return (CoC)
Annual Cash Flow / Cash Invested
Calculation:
Annual cash flow divided by initial cash invested.
Debt Coverage Ratio (DCR)
Net Operating Income (NOI) divided by total debt payments.
Calculation:
NOI / Total Debt Payments
Internal Rate of Return (IRR)
A metric for assessing profitability over time. IRR is the discount rate at which the net present value (NPV) of all future cash flows (positive and negative) from an investment equals zero — including both periodic cash flow (such as rent) and a projected sale at the end of the holding period. It represents the expected annualized return, accounting for income, expenses, and the recovery of capital through a future sale.
Purchase Details
Purchase PriceThe price paid for the property. Purchase price:
| $515,000 |
|---|---|
Amount FinancedThe amount of the purchase financed through a loan. Amount financed:
| -$412,000 |
Down paymentThe initial payment made towards the purchase. Down payment:
| $103,000 |
Closing CostsFees and expenses associated with purchasing a property, typically ranging from 2% to 5% of the home’s purchase price, paid at the end of a home purchase to cover services like lending, title transfer, and taxes. Closing costs:
| $15,450 |
Rehab CostsCosts incurred to repair or improve the property, including: roof, flooring, exterior siding, kitchen, exterior paint, bathrooms, etc. Rehab costs:
| $0 |
Initial Cash InvestedThe total initial cash invested in the property. Calculation:Down payment + Buying costs + Rehab costs Initial cash invested:
| $118,450 |
Square Feet (SQFT)The total square footage of the property. Square feet:
| 2,878 |
Cost Per Square FootCost per square foot of the property. Calculation:Purchase Price / Square Feet Cost per square foot:
| $179 |
Monthly Rent Per Square FootMonthly rent divided by the number of square feet. This ratio helps investors compare rental income efficiency across properties, markets, and unit sizes Calculation:Monthly Rent / Square Feet Monthly rent per square foot:
| $1.11 |
Financing Details
Loan AmountThe total sum of money borrowed from a lender to finance a property purchase. Calculation:Purchase Price - Down Payment
Loan amount:
| $412,000 |
|---|---|
Loan to Value Ratio (LTV)Loan amount divided by the market value of the property. Calculation:Loan Amount / Market Value
Loan to value ratio:
| 80.0% |
Loan TypeThe type of loan (e.g., fixed, adjustable).
Loan type:
| Amortizing |
TermThe loan repayment period in years.
Term:
| 30 years |
Interest RateThe percentage a lender charges on the borrowed amount of a loan, determining the cost of borrowing money.
Interest rate:
| 6.625% |
Principal & Interest (PI)The principal is the portion of the loan payment that reduces the loan balance. The interest is the lender's charge for borrowing money. Calculation:(P * r * (1 + r) ** n) / ((1 + r) ** n - 1) Where:
P = Loan amount (principal)
Principal & interest:
| $2,638 |
Property TaxesAnnual taxes levied by local governments on real estate properties. These taxes fund public services like schools, roads, and emergency services.
Property tax:
| $69 |
InsuranceThe costs for insurance coverage to protect against financial losses due to risks like fire, natural disasters, theft, liability, or tenant-related damages. Calculation:Assumes 7% of gross rental income, unless insurance rates are specified.
Insurance:
| $224 |
Private Mortgage Insurance (PMI)A fee that borrowers pay when they take out a conventional loan with a loan-to-value (LTV) ratio above 80%.
Private mortgage insurance (PMI):
| $0 |
Monthly PaymentThe fixed amount a borrower pays each month to repay a loan. It typically includes principal and interest (P&I) and may also cover property taxes, insurance, HOA fees, and PMI if escrowed. Monthly payment:
| $2,931 |
Operating Income
| % Rent | Monthly | Yearly | |
|---|---|---|---|
Gross RentThe total rental income received from tenants before deducting any expenses. Includes base rent, late fees, pet fees, parking fees, and other recurring charges.
Gross rent:
| $3,200 | $38,400 | |
Vacancy LossExpected loss of rent due to vacancies.
Vacancy loss:
(6%)
| 6% | -$192 | -$2,304 |
Operating IncomeGross rental income minus vacancy loss. Calculation:Gross rent - Vacancy loss
Operating income:
| $3,008 | $36,096 |
Operating Expenses
| % Rent | Monthly | Yearly | |
|---|---|---|---|
Property TaxesAnnual taxes levied by local governments on real estate properties. These taxes fund public services like schools, roads, and emergency services. | 2% | -$69 | -$833 |
InsuranceThe costs for insurance coverage to protect against financial losses due to risks like fire, natural disasters, theft, liability, or tenant-related damages. Calculation:Assumes 7% of gross rental income, unless insurance rates are specified. | 7% | -$224 | -$2,688 |
Property ManagementThe costs associated with hiring a property manager to handle the day-to-day operations of a rental property. Includes management fees, leasing fes, eviction fees, etc. Calculation:Assumes 8% of gross rental income. | 8% | -$256 | -$3,072 |
Repairs & MaintenanceOngoing costs for routine upkeep and minor fixes needed to keep a property in good working condition. Calculation:Assumes 5% of gross rental income. Varies by property age and condition. | 5% | -$160 | -$1,920 |
Capital ExpensesLarge, infrequent costs for major improvements or replacements, like a new roof, HVAC system, or appliances. Calculation:Assumes 5% of gross rental income. Varies by property age. | 5% | -$160 | -$1,920 |
HOA FeesRegular dues paid to a Homeowners Association for community maintenance, amenities, and management. Similar fees include: Condo Association Fees, Co-op Maintenance Fees, etc. | 3% | -$83 | -$996 |
Operating ExpensesRecurring costs required to maintain and manage a rental property, including property taxes, insurance, maintenance, repairs, utilities (if paid by the owner), property management fees, and other day-to-day expenses. Calculation:Insurance + Property Taxes + Property Management + Repairs & Maintenance + Capital Expenditures + HOA Fees | 30% | -$952 | -$11,429 |
Cash Flow
| Monthly | Yearly | |
|---|---|---|
Net Operating Income (NOI)The income generated from a property after deducting all operating expenses but before deducting mortgage payments, taxes, and capital expenditures. Calculation:Gross Operating Income - Operating Expenses
Net operating income:
| $2,056 | $24,672 |
Mortgage PaymentThe fixed amount a borrower pays each month to repay a loan. It typically includes principal and interest (P&I) and may also cover property taxes, insurance, HOA fees, and PMI if escrowed. | -$2,638 | -$31,656 |
Cash FlowNet Operating Income (NOI) minus mortgage payments. Calculation:NOI - Mortgage Payments | -$582 | -$6,984 |