$745,000
Investment Summary
- Monthly Cash Flow
- -$1,703
- Cap Rate
- 3.3%
- Cash-on-Cash Return
- -11.9%
- Debt Coverage Ratio
- 0.55
- Internal Rate of Return (5 years)
- -7.5%
Cash Flow
Net Operating Income (NOI) minus mortgage payments.
Calculation:
NOI - Mortgage Payments
Cap Rate (Market Value)
Capitalization Rate is a rate of return that compares the yearly Net Operating Income (NOI) to the market value.
Calculation:
NOI / Market Value
Cash-on-Cash Return (CoC)
Annual Cash Flow / Cash Invested
Calculation:
Annual cash flow divided by initial cash invested.
Debt Coverage Ratio (DCR)
Net Operating Income (NOI) divided by total debt payments.
Calculation:
NOI / Total Debt Payments
Internal Rate of Return (IRR)
A metric for assessing profitability over time. IRR is the discount rate at which the net present value (NPV) of all future cash flows (positive and negative) from an investment equals zero — including both periodic cash flow (such as rent) and a projected sale at the end of the holding period. It represents the expected annualized return, accounting for income, expenses, and the recovery of capital through a future sale.
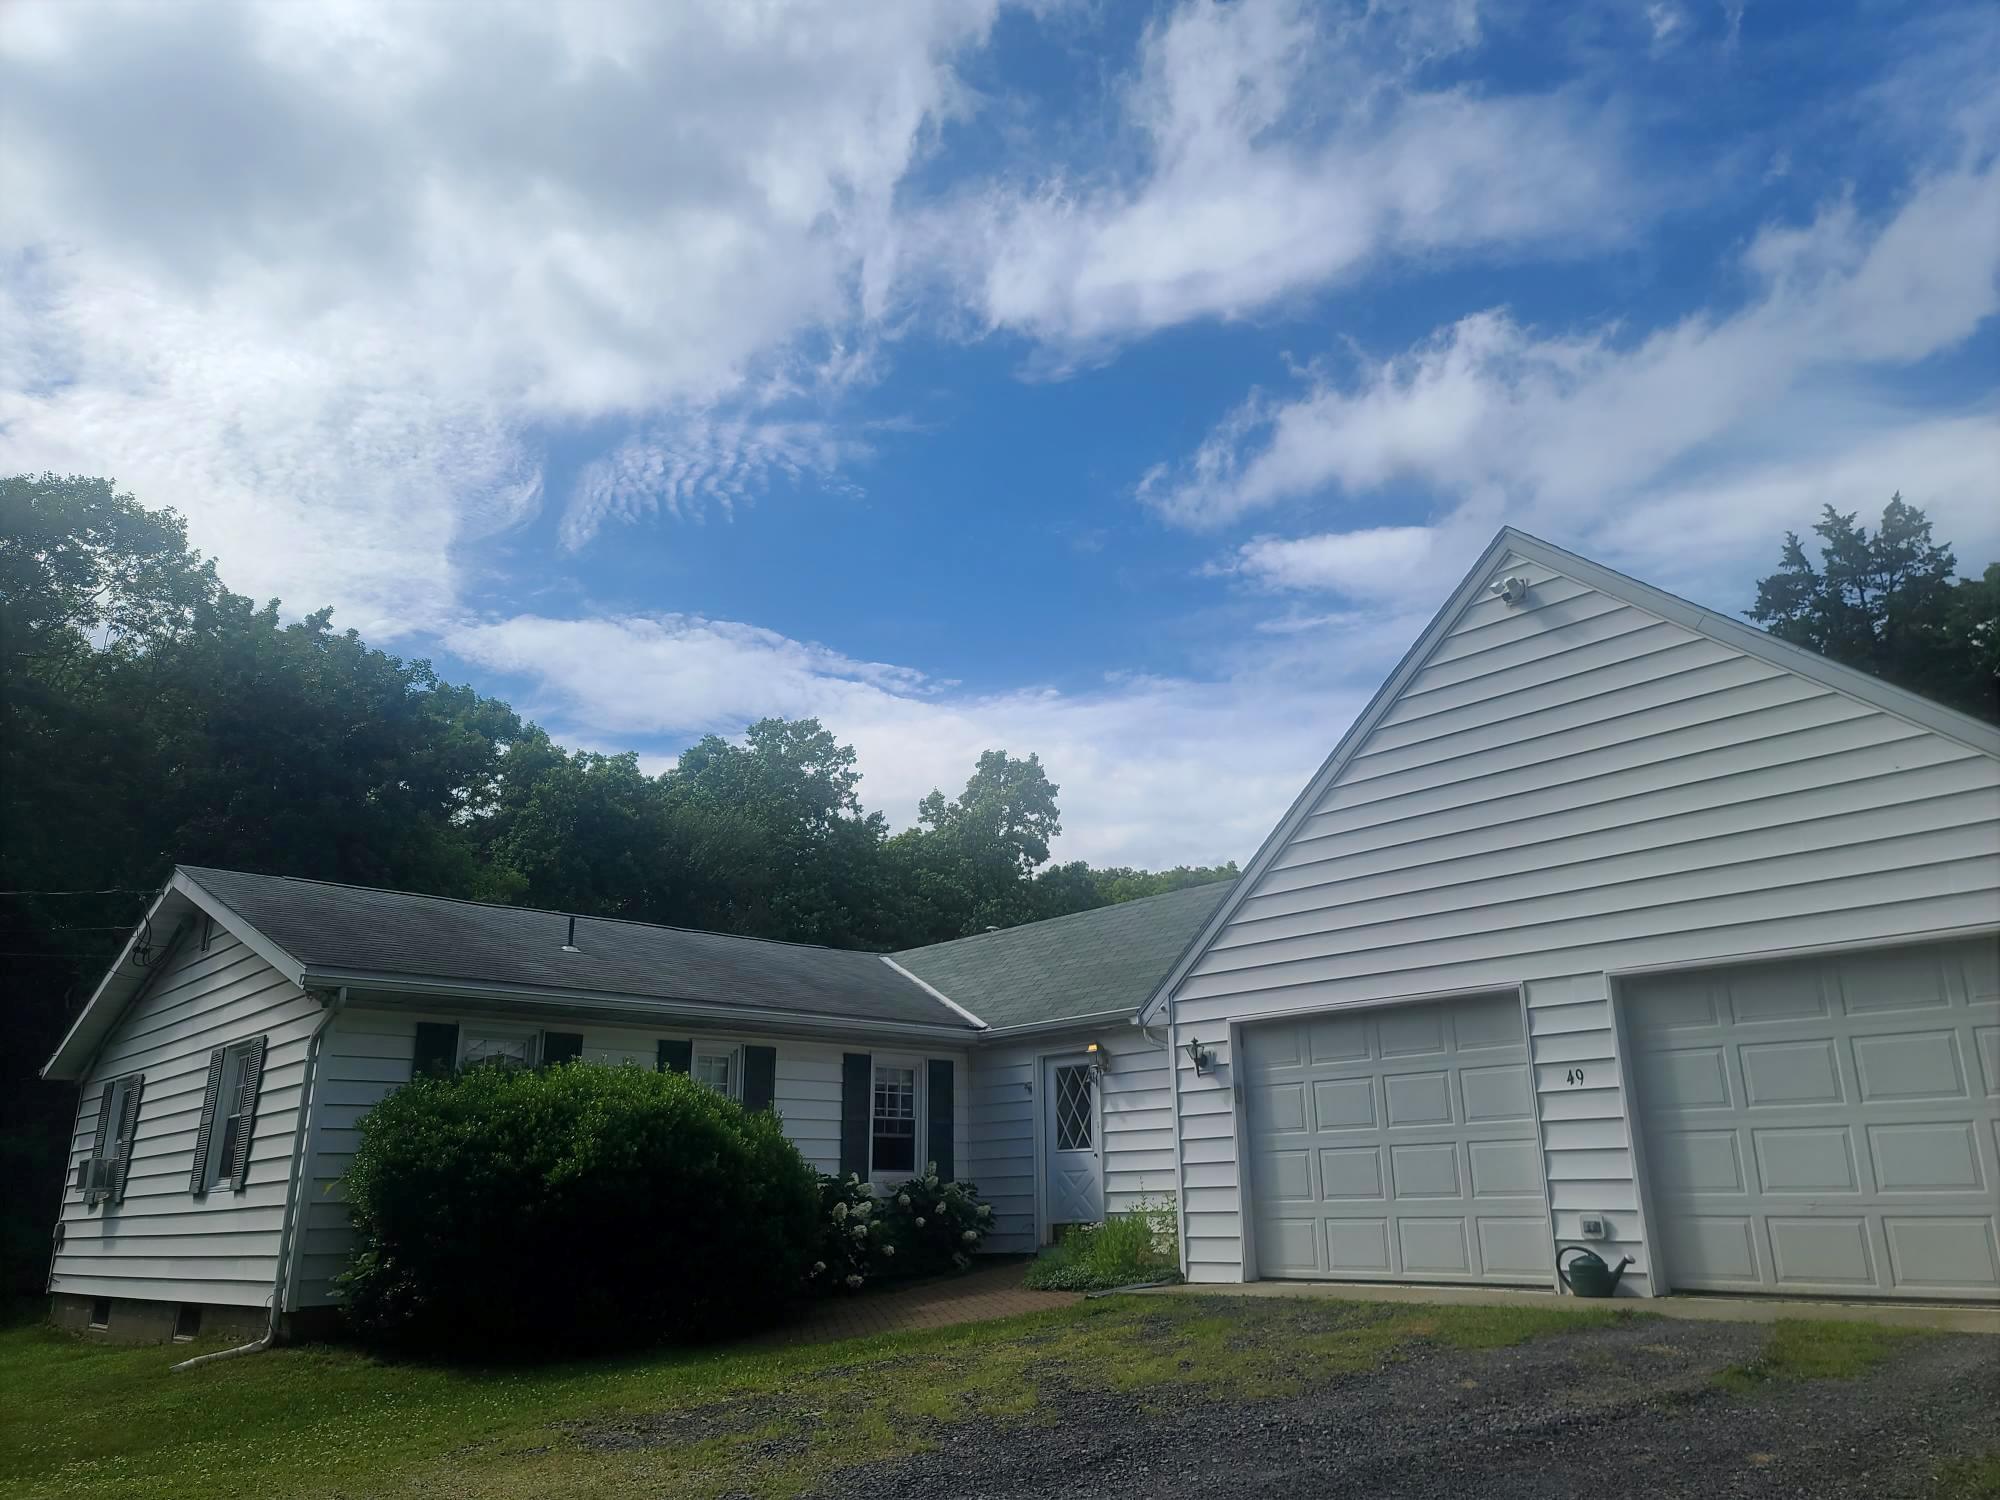
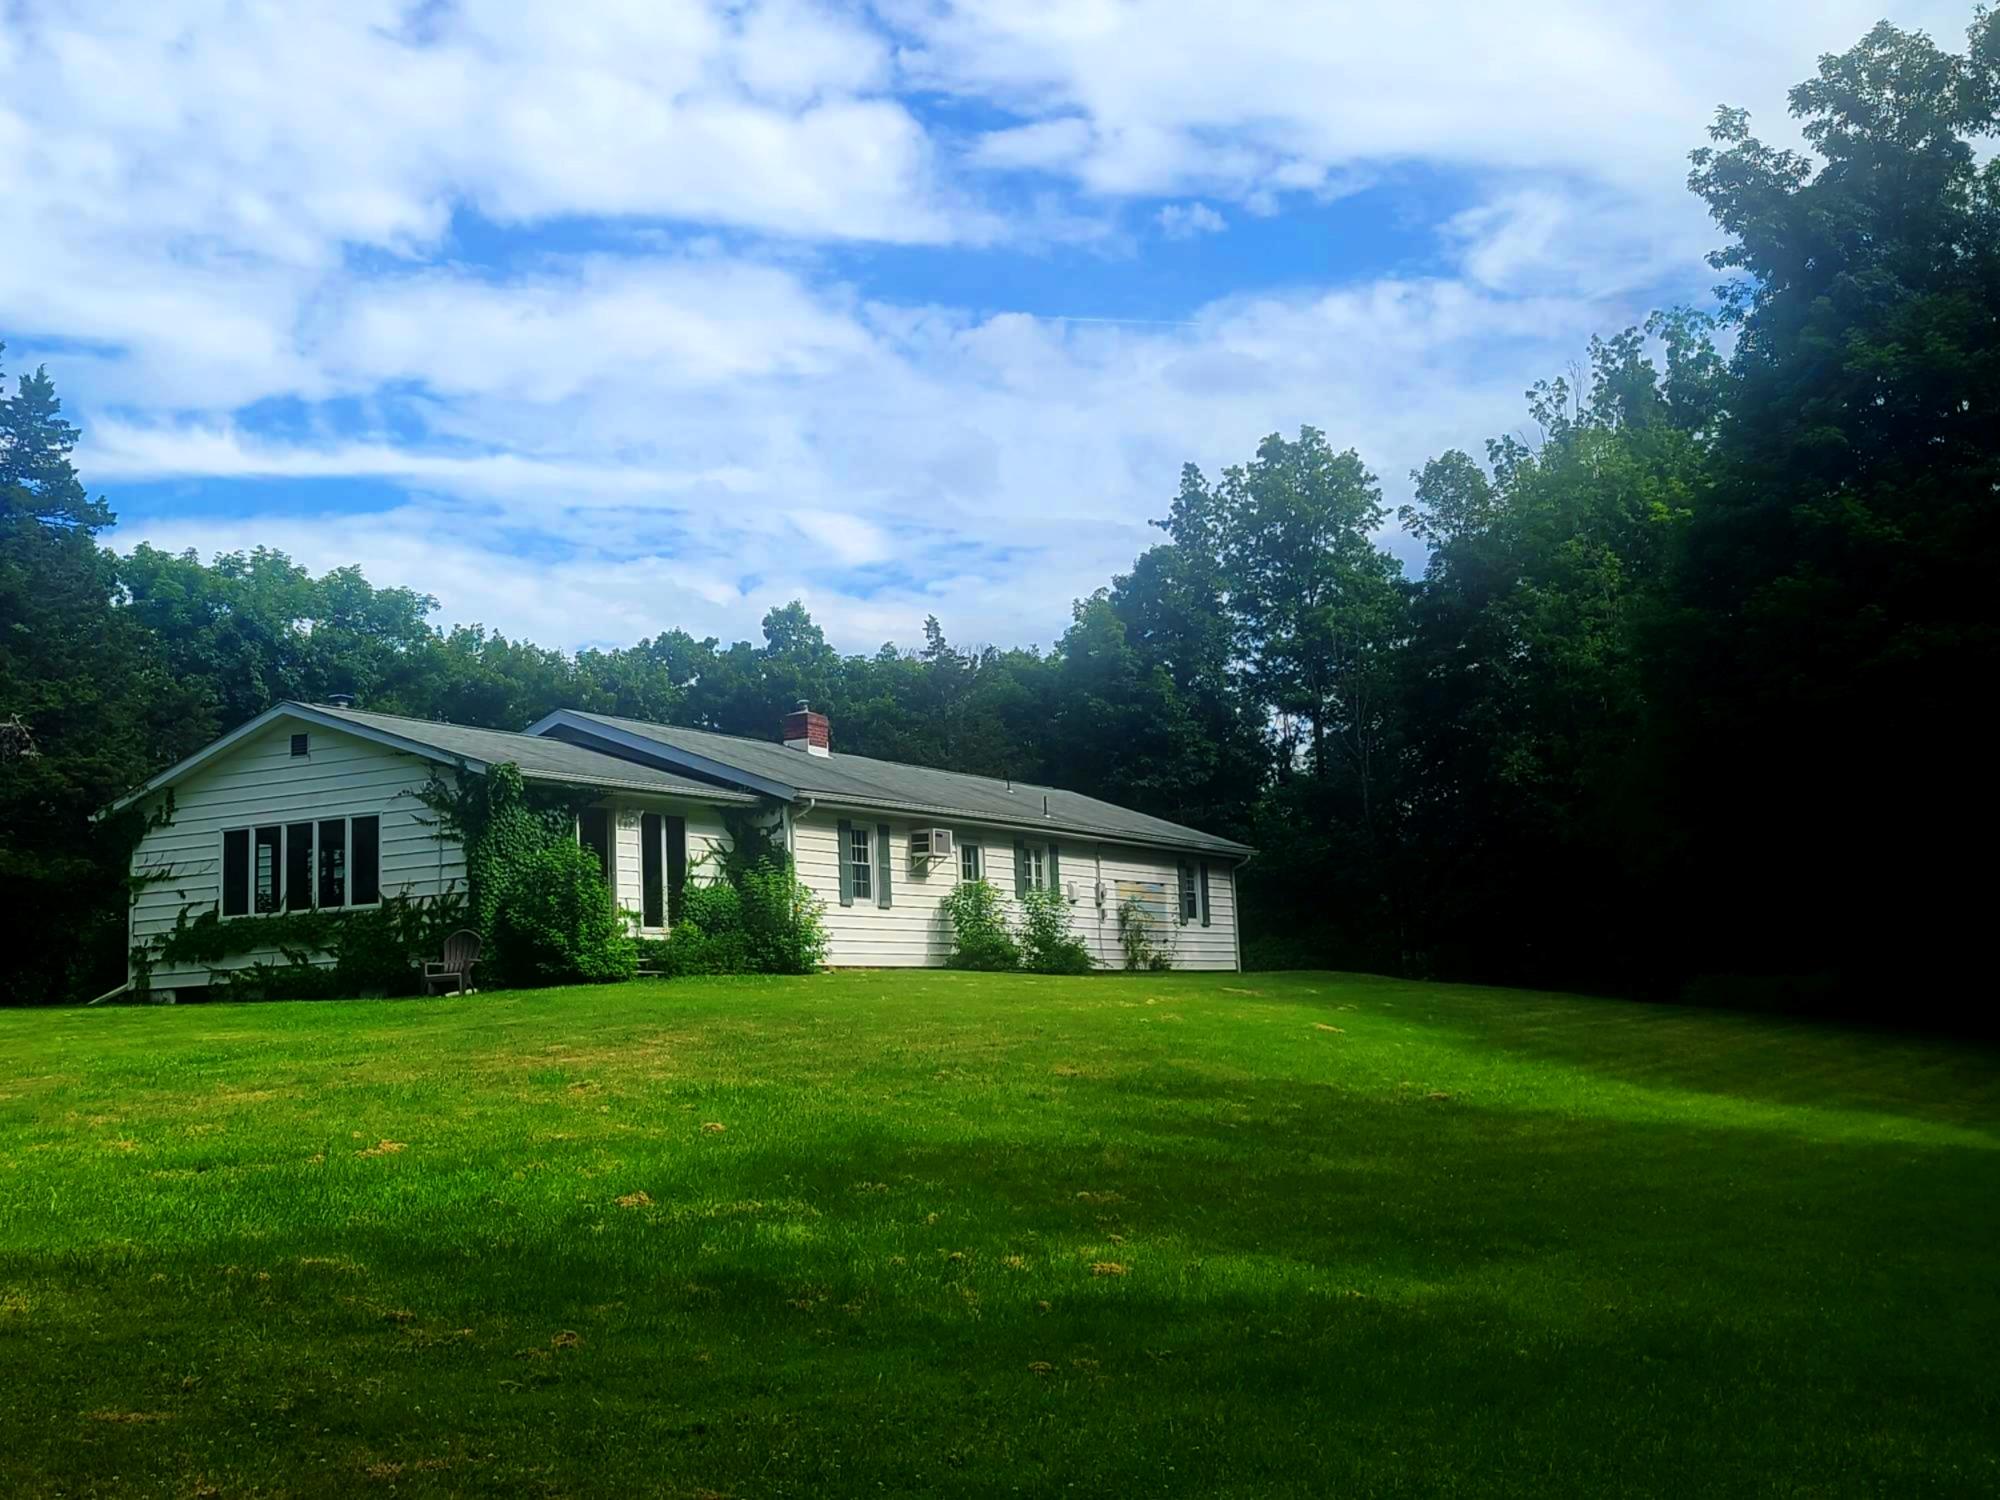
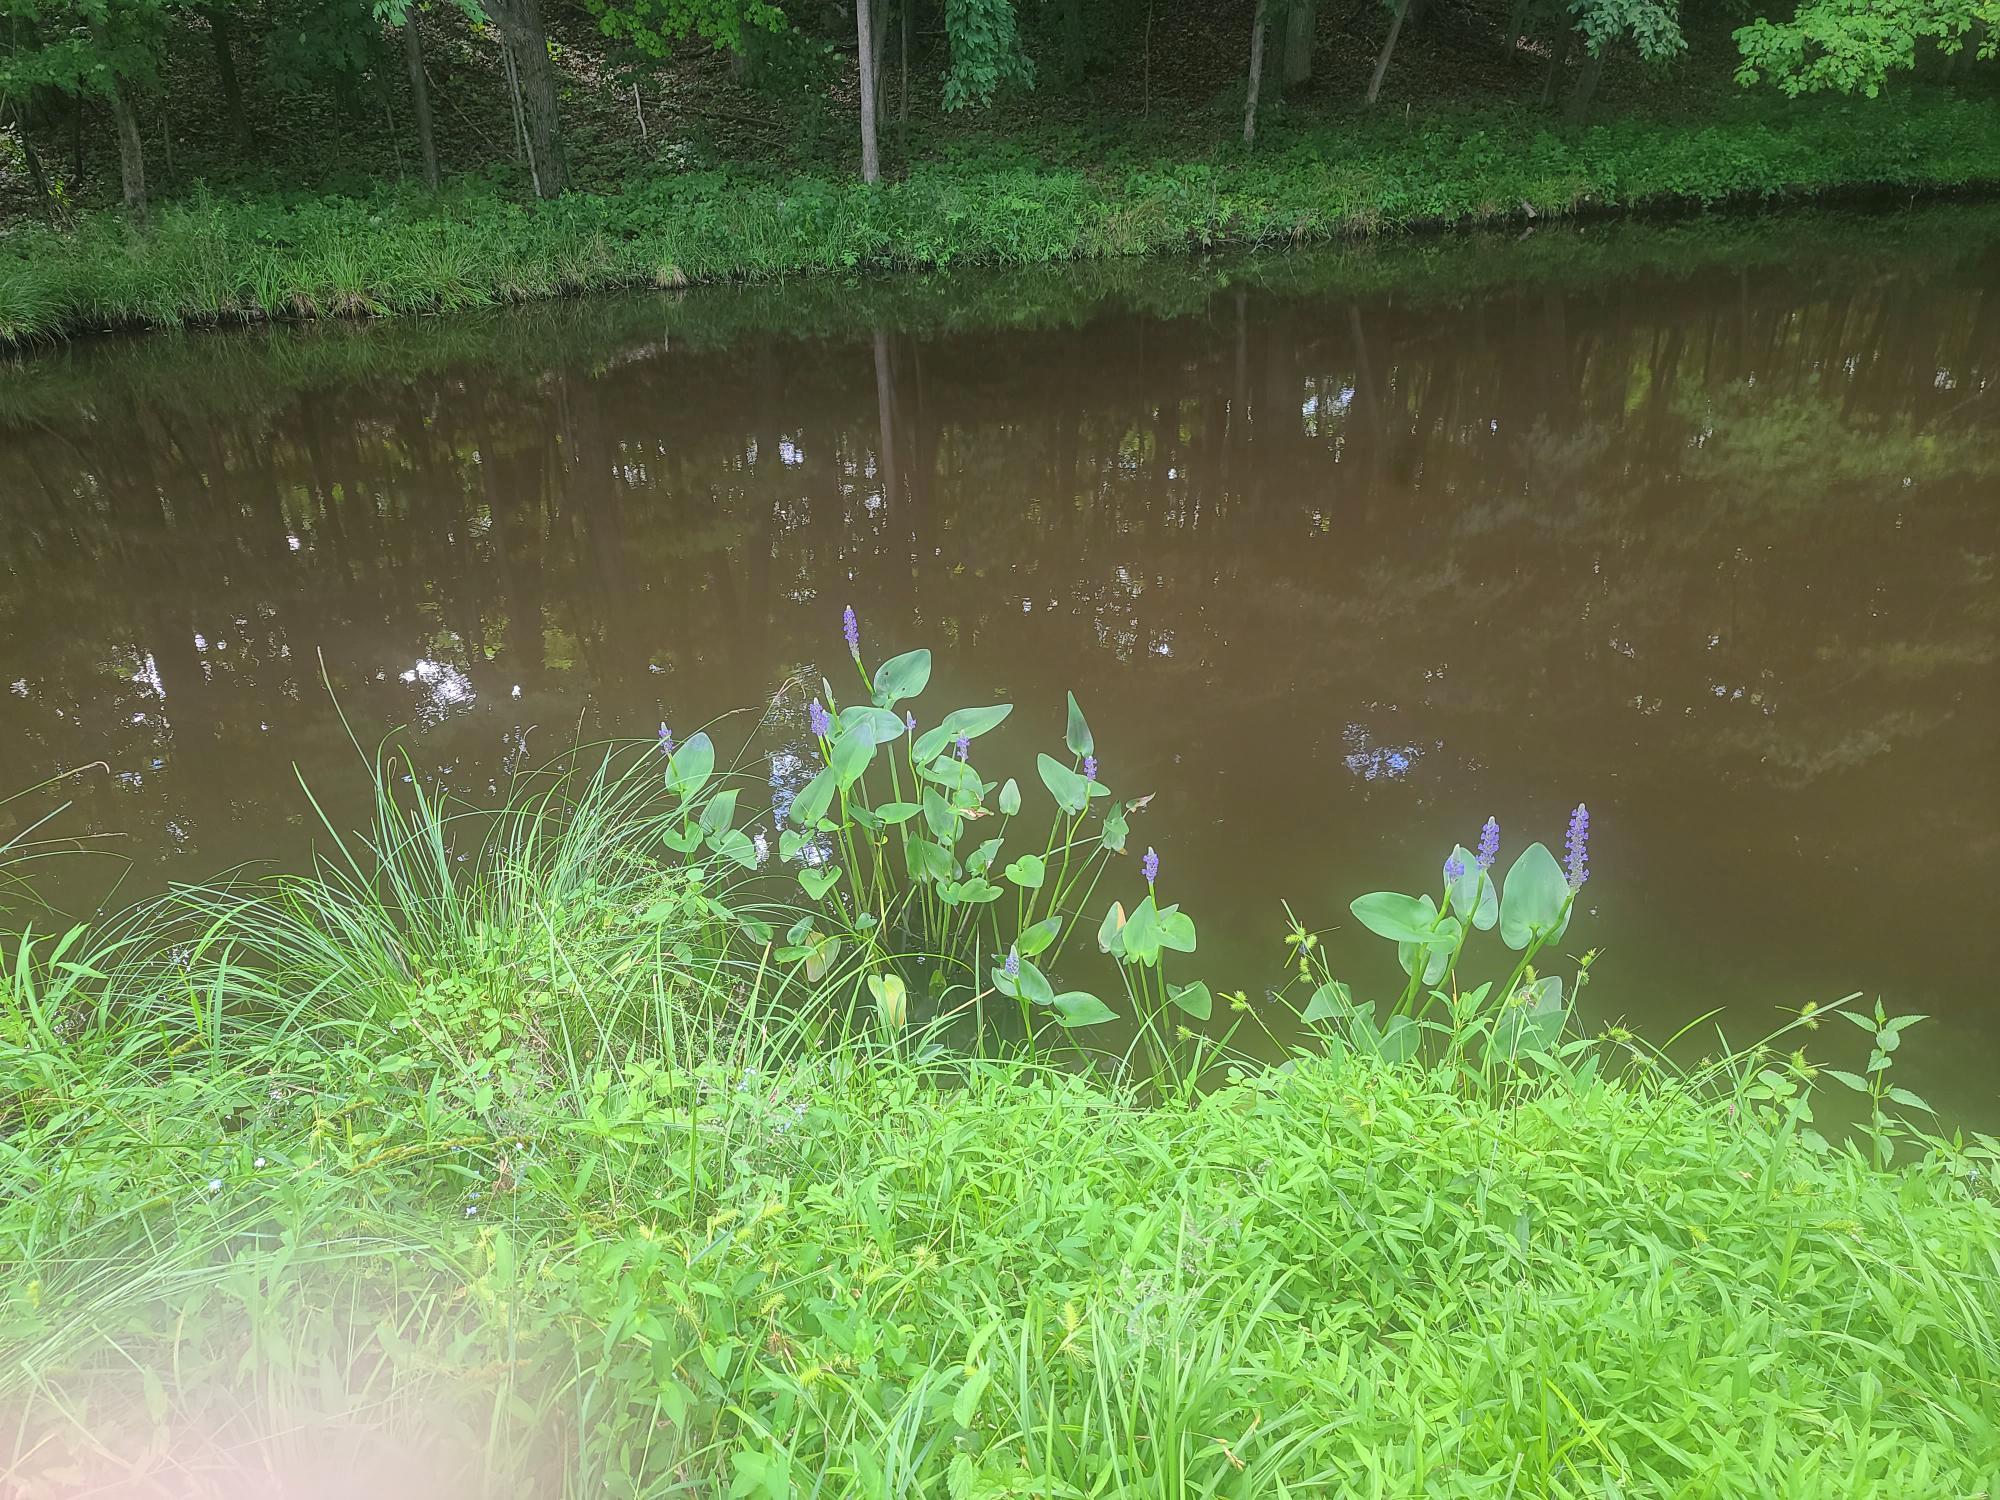
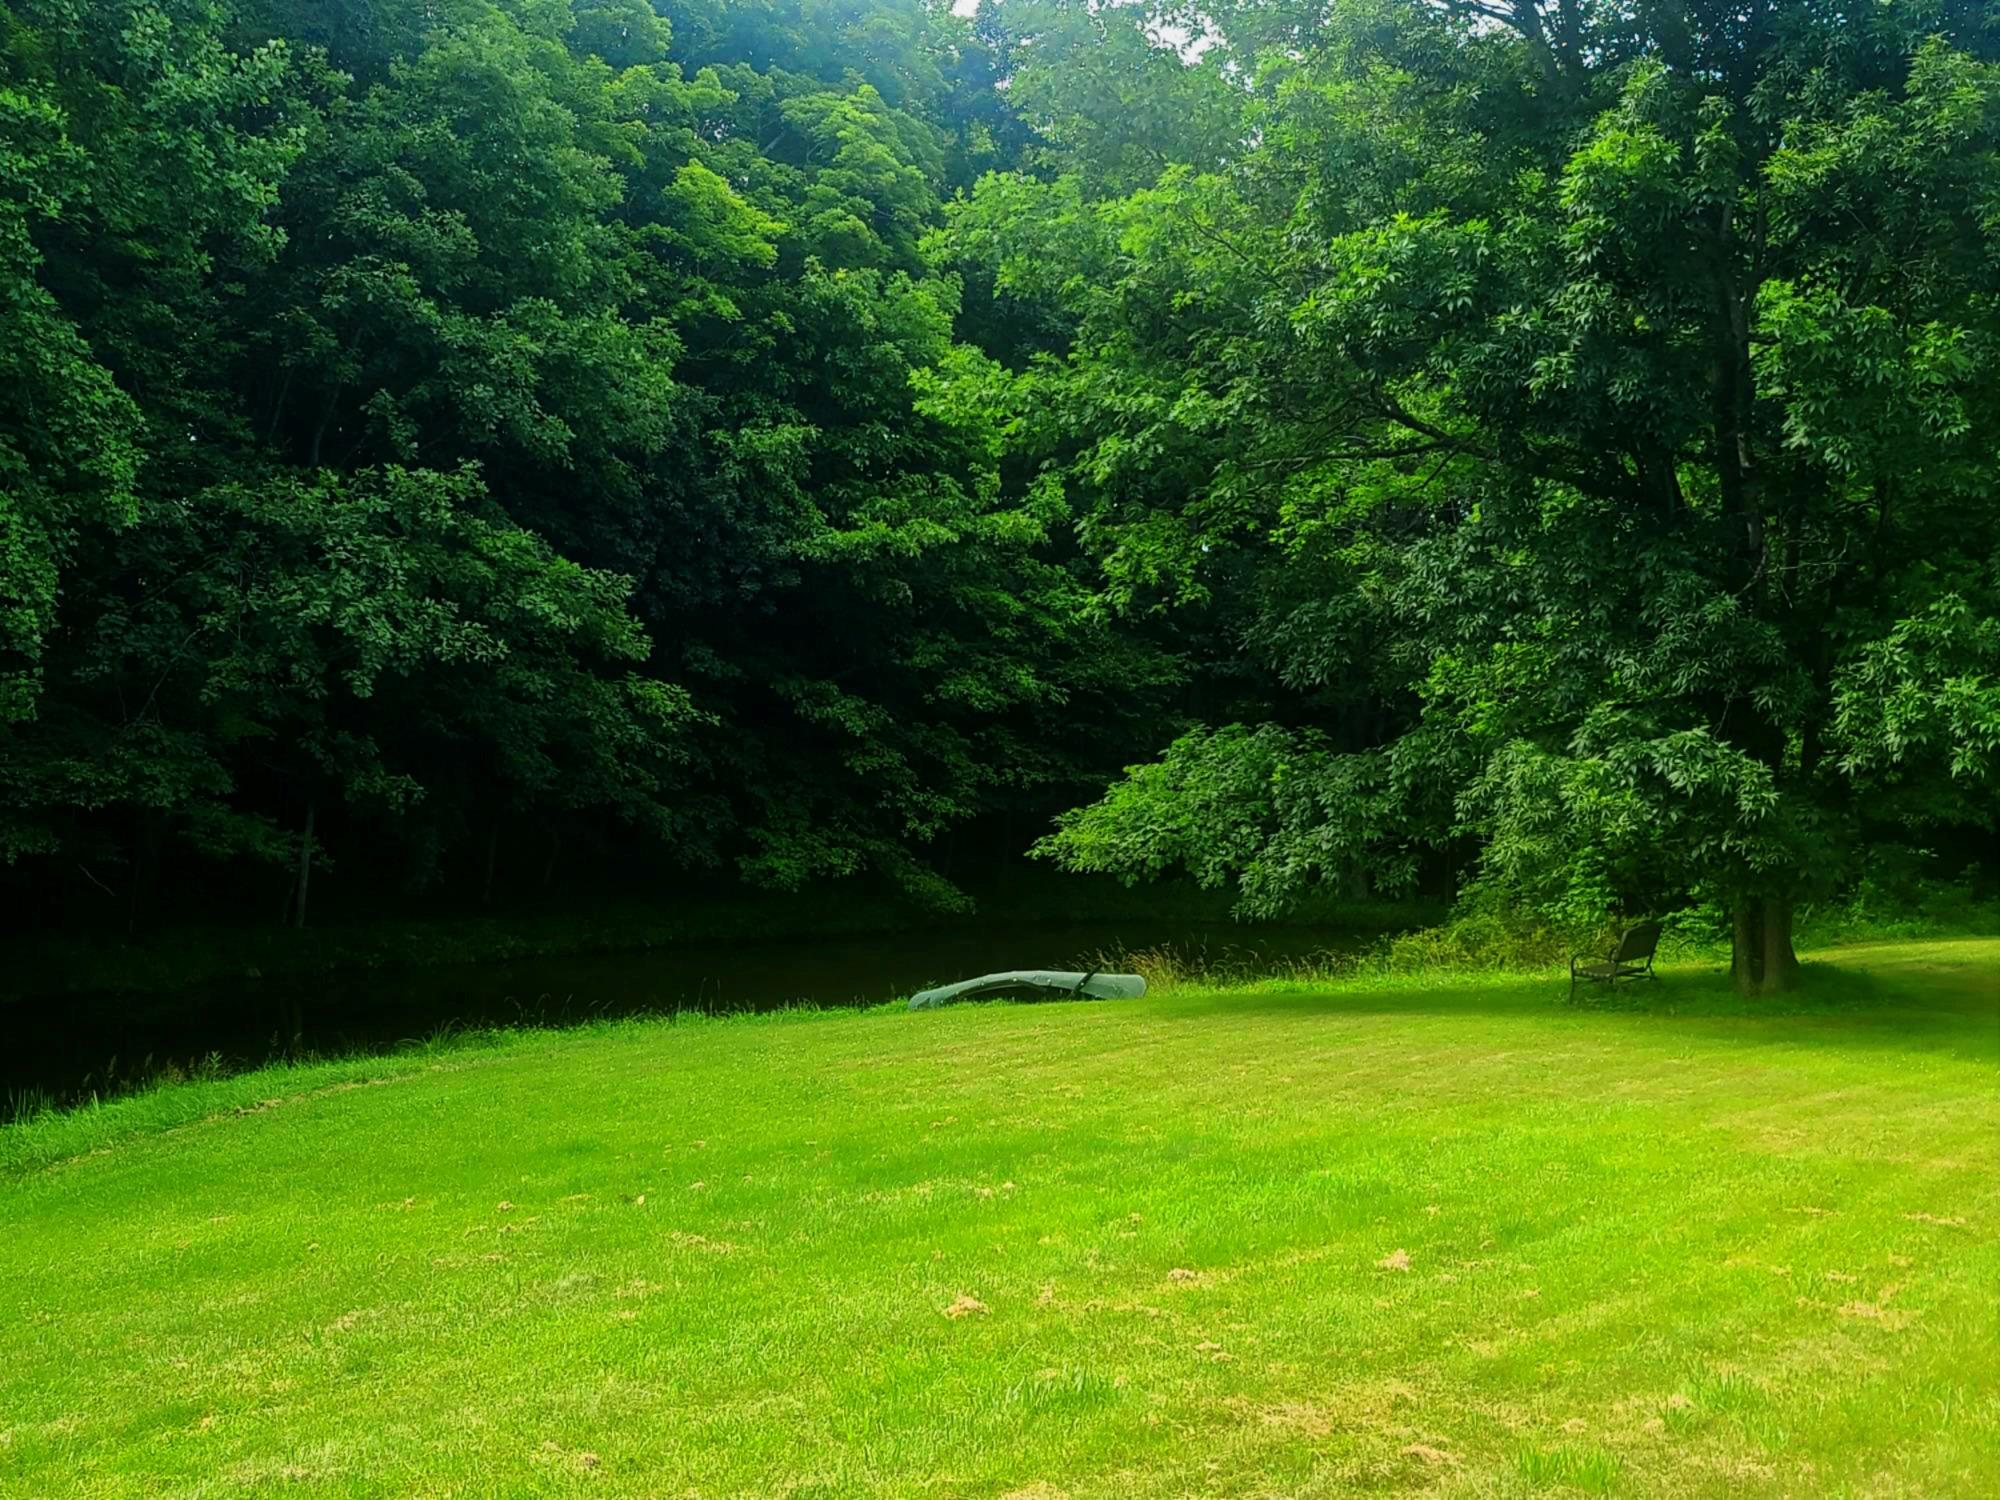
Property Description
LIVING IS EASY in this low maintenance luxury ranch on almost 8 acres of privacy and tranquility. If you are looking for a full time base, a weekend escape, or just solitude with room to roam, 49 Old Farm Road in Rhinebeck delivers. This no-nonsense property offers the freedom of open land, the privacy of woods and a home built for real living, not just for show. This 3 bedroom, 2 bath ranch-style home offers a private and tranquil living environment on nearly 8 acres of land. Prominent features of the property are a private pond stocked with koi fish and a sunroom with panoramic views of the property. A highlight of the home, the sunroom features windows on three sides, providing ample natural light and views of the surrounding landscape, an ideal space for morning coffee or an evening retreat. Situated in a rural setting, the property offers privacy and space for practical living and enjoyment of the outdoors. The living room serves as a central gathering space and features a fireplace. Adjacent to the living room is an office or den, providing a secluded area for work or relaxation. The layout connects the dining room and kitchen to the living room, creating an open feel. The sunroom, filled with natural light, extends from the main living area and provides access to both the backyard and side yard. The kitchen is designed for efficiency and elbow room, while also accommodating the laundry facilities. Two of the bedrooms share a full "Jack and Jill" bathroom. The large foyer or mudroom connects the house to the two-car garage, which includes storage space. The exterior of the property is enhanced by perennial cottage gardens and mature foliage. The landscaping is designed to offer aesthetic appeal while minimizing maintenance, allowing for relaxation and enjoyment of the surroundings. The acreage surrounding the home provides a high degree of privacy. Additional details to consider: Privacy: The large acreage provides a buffer from neighbors and external noise, enhancing the sense of seclusion and privacy. Outdoor Features: The pond with koi fish adds a unique and appealing element to the property. Layout: The open layout of the living room, dining room, and kitchen are beneficial for entertaining and family interaction. The presence of a separate office/den provides a dedicated workspace. Garage and Storage: The over-sized two-car garage with storage space offers practical solutions for vehicle storage and organizational needs. Landscaping: The perennial gardens and foliage contribute to the property's aesthetic appeal and require relatively low maintenance. Sunroom: The sunroom provides a bright and versatile space that can be used for various purposes, such as reading, writing or painting, for musicians or hobbyists, or just for additional living space for peace and quiet. Location: The property's privacy and proximity to amenities and schools assures a most desirable location just minutes from Rhinebeck Village. Overall appeal: The property is designed for relaxed living with an emphasis on privacy and enjoying the natural surroundings, where substance meets style.
Build Your Team
Quickly find investor-friendly professionals who can help you succeed in real estate investing at any stage of the investing journey.


Agents
Match with investor-friendly agents who can help you find, analyze, and close your next deal


Lenders
Get the best funding…find investor-friendly lenders who specialize in your deal strategy


Property Managers
Transition to passive investing. Find a trusted property management partnership that lasts.


Tax Pros & Accountants
Taxes and financial reporting made easy—find experts to create tax savings strategies, file taxes, and more
Location
Property Details
Parking
- Description: Attached, Garage
- Details: Attached, Driveway, Garage Door Opener, Off Street, Oversized, Private, Storage
- Garage Spaces: 2
- Spaces Total: 4
Bedroom Information
- # of Bedrooms: 3
Bathroom Information
- # of Baths (Full): 2
- # of Baths (Total): 2.0
Interior Features
- # of Rooms: 8
- # of Stories: 1
- Basement Description: Crawl Space
- Fireplace: Yes
Exterior Features
- Exterior Walls Materials: Siding (Alum/Vinyl)
Land Information
- Land Use: Residential
- Land Use Subtype: Single Family Residential
Lot Information
- Parcel ID: 1350896371005001980000
- Lot Size: 345866 sqft
Property Information
- Property Type: Single Family Residence
- Style: Ranch
- Year Built: 1970
Tax Information
- Annual Tax: $11,662
Utilities
- Water & Sewer: Private, Well
- Heating: Baseboard, Hot Water
- Cooling: Wall/Window Unit(s)
Location
- County: Dutchess
Listing Details
Investment Summary
- Monthly Cash Flow
- -$1,703
- Cap Rate
- 3.3%
- Cash-on-Cash Return
- -11.9%
- Debt Coverage Ratio
- 0.55
- Internal Rate of Return (5 years)
- -7.5%
Cash Flow
Net Operating Income (NOI) minus mortgage payments.
Calculation:
NOI - Mortgage Payments
Cap Rate (Market Value)
Capitalization Rate is a rate of return that compares the yearly Net Operating Income (NOI) to the market value.
Calculation:
NOI / Market Value
Cash-on-Cash Return (CoC)
Annual Cash Flow / Cash Invested
Calculation:
Annual cash flow divided by initial cash invested.
Debt Coverage Ratio (DCR)
Net Operating Income (NOI) divided by total debt payments.
Calculation:
NOI / Total Debt Payments
Internal Rate of Return (IRR)
A metric for assessing profitability over time. IRR is the discount rate at which the net present value (NPV) of all future cash flows (positive and negative) from an investment equals zero — including both periodic cash flow (such as rent) and a projected sale at the end of the holding period. It represents the expected annualized return, accounting for income, expenses, and the recovery of capital through a future sale.
Purchase Details
Purchase PriceThe price paid for the property. Purchase price:
| $745,000 |
|---|---|
Amount FinancedThe amount of the purchase financed through a loan. Amount financed:
| -$596,000 |
Down paymentThe initial payment made towards the purchase. Down payment:
| $149,000 |
Closing CostsFees and expenses associated with purchasing a property, typically ranging from 2% to 5% of the home’s purchase price, paid at the end of a home purchase to cover services like lending, title transfer, and taxes. Closing costs:
| $22,350 |
Rehab CostsCosts incurred to repair or improve the property, including: roof, flooring, exterior siding, kitchen, exterior paint, bathrooms, etc. Rehab costs:
| $0 |
Initial Cash InvestedThe total initial cash invested in the property. Calculation:Down payment + Buying costs + Rehab costs Initial cash invested:
| $171,350 |
Square Feet (SQFT)The total square footage of the property. Square feet:
| 2,348 |
Cost Per Square FootCost per square foot of the property. Calculation:Purchase Price / Square Feet Cost per square foot:
| $317 |
Monthly Rent Per Square FootMonthly rent divided by the number of square feet. This ratio helps investors compare rental income efficiency across properties, markets, and unit sizes Calculation:Monthly Rent / Square Feet Monthly rent per square foot:
| $1.87 |
Financing Details
Loan AmountThe total sum of money borrowed from a lender to finance a property purchase. Calculation:Purchase Price - Down Payment
Loan amount:
| $596,000 |
|---|---|
Loan to Value Ratio (LTV)Loan amount divided by the market value of the property. Calculation:Loan Amount / Market Value
Loan to value ratio:
| 80.0% |
Loan TypeThe type of loan (e.g., fixed, adjustable).
Loan type:
| Amortizing |
TermThe loan repayment period in years.
Term:
| 30 years |
Interest RateThe percentage a lender charges on the borrowed amount of a loan, determining the cost of borrowing money.
Interest rate:
| 6.500% |
Principal & Interest (PI)The principal is the portion of the loan payment that reduces the loan balance. The interest is the lender's charge for borrowing money. Calculation:(P * r * (1 + r) ** n) / ((1 + r) ** n - 1) Where:
P = Loan amount (principal)
Principal & interest:
| $3,767 |
Property TaxesAnnual taxes levied by local governments on real estate properties. These taxes fund public services like schools, roads, and emergency services.
Property tax:
| $972 |
InsuranceThe costs for insurance coverage to protect against financial losses due to risks like fire, natural disasters, theft, liability, or tenant-related damages. Calculation:Assumes 7% of gross rental income, unless insurance rates are specified.
Insurance:
| $308 |
Private Mortgage Insurance (PMI)A fee that borrowers pay when they take out a conventional loan with a loan-to-value (LTV) ratio above 80%.
Private mortgage insurance (PMI):
| $0 |
Monthly PaymentThe fixed amount a borrower pays each month to repay a loan. It typically includes principal and interest (P&I) and may also cover property taxes, insurance, HOA fees, and PMI if escrowed. Monthly payment:
| $5,047 |
Operating Income
| % Rent | Monthly | Yearly | |
|---|---|---|---|
Gross RentThe total rental income received from tenants before deducting any expenses. Includes base rent, late fees, pet fees, parking fees, and other recurring charges.
Gross rent:
| $4,400 | $52,800 | |
Vacancy LossExpected loss of rent due to vacancies.
Vacancy loss:
(6%)
| 6% | -$264 | -$3,168 |
Operating IncomeGross rental income minus vacancy loss. Calculation:Gross rent - Vacancy loss
Operating income:
| $4,136 | $49,632 |
Operating Expenses
| % Rent | Monthly | Yearly | |
|---|---|---|---|
Property TaxesAnnual taxes levied by local governments on real estate properties. These taxes fund public services like schools, roads, and emergency services. | 22% | -$972 | -$11,663 |
InsuranceThe costs for insurance coverage to protect against financial losses due to risks like fire, natural disasters, theft, liability, or tenant-related damages. Calculation:Assumes 7% of gross rental income, unless insurance rates are specified. | 7% | -$308 | -$3,696 |
Property ManagementThe costs associated with hiring a property manager to handle the day-to-day operations of a rental property. Includes management fees, leasing fes, eviction fees, etc. Calculation:Assumes 8% of gross rental income. | 8% | -$352 | -$4,224 |
Repairs & MaintenanceOngoing costs for routine upkeep and minor fixes needed to keep a property in good working condition. Calculation:Assumes 5% of gross rental income. Varies by property age and condition. | 5% | -$220 | -$2,640 |
Capital ExpensesLarge, infrequent costs for major improvements or replacements, like a new roof, HVAC system, or appliances. Calculation:Assumes 5% of gross rental income. Varies by property age. | 5% | -$220 | -$2,640 |
HOA FeesRegular dues paid to a Homeowners Association for community maintenance, amenities, and management. Similar fees include: Condo Association Fees, Co-op Maintenance Fees, etc. | n/a | n/a | n/a |
Operating ExpensesRecurring costs required to maintain and manage a rental property, including property taxes, insurance, maintenance, repairs, utilities (if paid by the owner), property management fees, and other day-to-day expenses. Calculation:Insurance + Property Taxes + Property Management + Repairs & Maintenance + Capital Expenditures + HOA Fees | 47% | -$2,072 | -$24,863 |
Cash Flow
| Monthly | Yearly | |
|---|---|---|
Net Operating Income (NOI)The income generated from a property after deducting all operating expenses but before deducting mortgage payments, taxes, and capital expenditures. Calculation:Gross Operating Income - Operating Expenses
Net operating income:
| $2,064 | $24,768 |
Mortgage PaymentThe fixed amount a borrower pays each month to repay a loan. It typically includes principal and interest (P&I) and may also cover property taxes, insurance, HOA fees, and PMI if escrowed. | -$3,767 | -$45,204 |
Cash FlowNet Operating Income (NOI) minus mortgage payments. Calculation:NOI - Mortgage Payments | -$1,703 | -$20,436 |