
$1,190,000
Investment Summary
- Monthly Cash Flow
- -$4,443
- Cap Rate
- 1.8%
- Cash-on-Cash Return
- -19.5%
- Debt Coverage Ratio
- 0.28
- Internal Rate of Return (5 years)
- -14.8%
Cash Flow
Net Operating Income (NOI) minus mortgage payments.
Calculation:
NOI - Mortgage Payments
Cap Rate (Market Value)
Capitalization Rate is a rate of return that compares the yearly Net Operating Income (NOI) to the market value.
Calculation:
NOI / Market Value
Cash-on-Cash Return (CoC)
Annual Cash Flow / Cash Invested
Calculation:
Annual cash flow divided by initial cash invested.
Debt Coverage Ratio (DCR)
Net Operating Income (NOI) divided by total debt payments.
Calculation:
NOI / Total Debt Payments
Internal Rate of Return (IRR)
A metric for assessing profitability over time. IRR is the discount rate at which the net present value (NPV) of all future cash flows (positive and negative) from an investment equals zero — including both periodic cash flow (such as rent) and a projected sale at the end of the holding period. It represents the expected annualized return, accounting for income, expenses, and the recovery of capital through a future sale.
Property Description
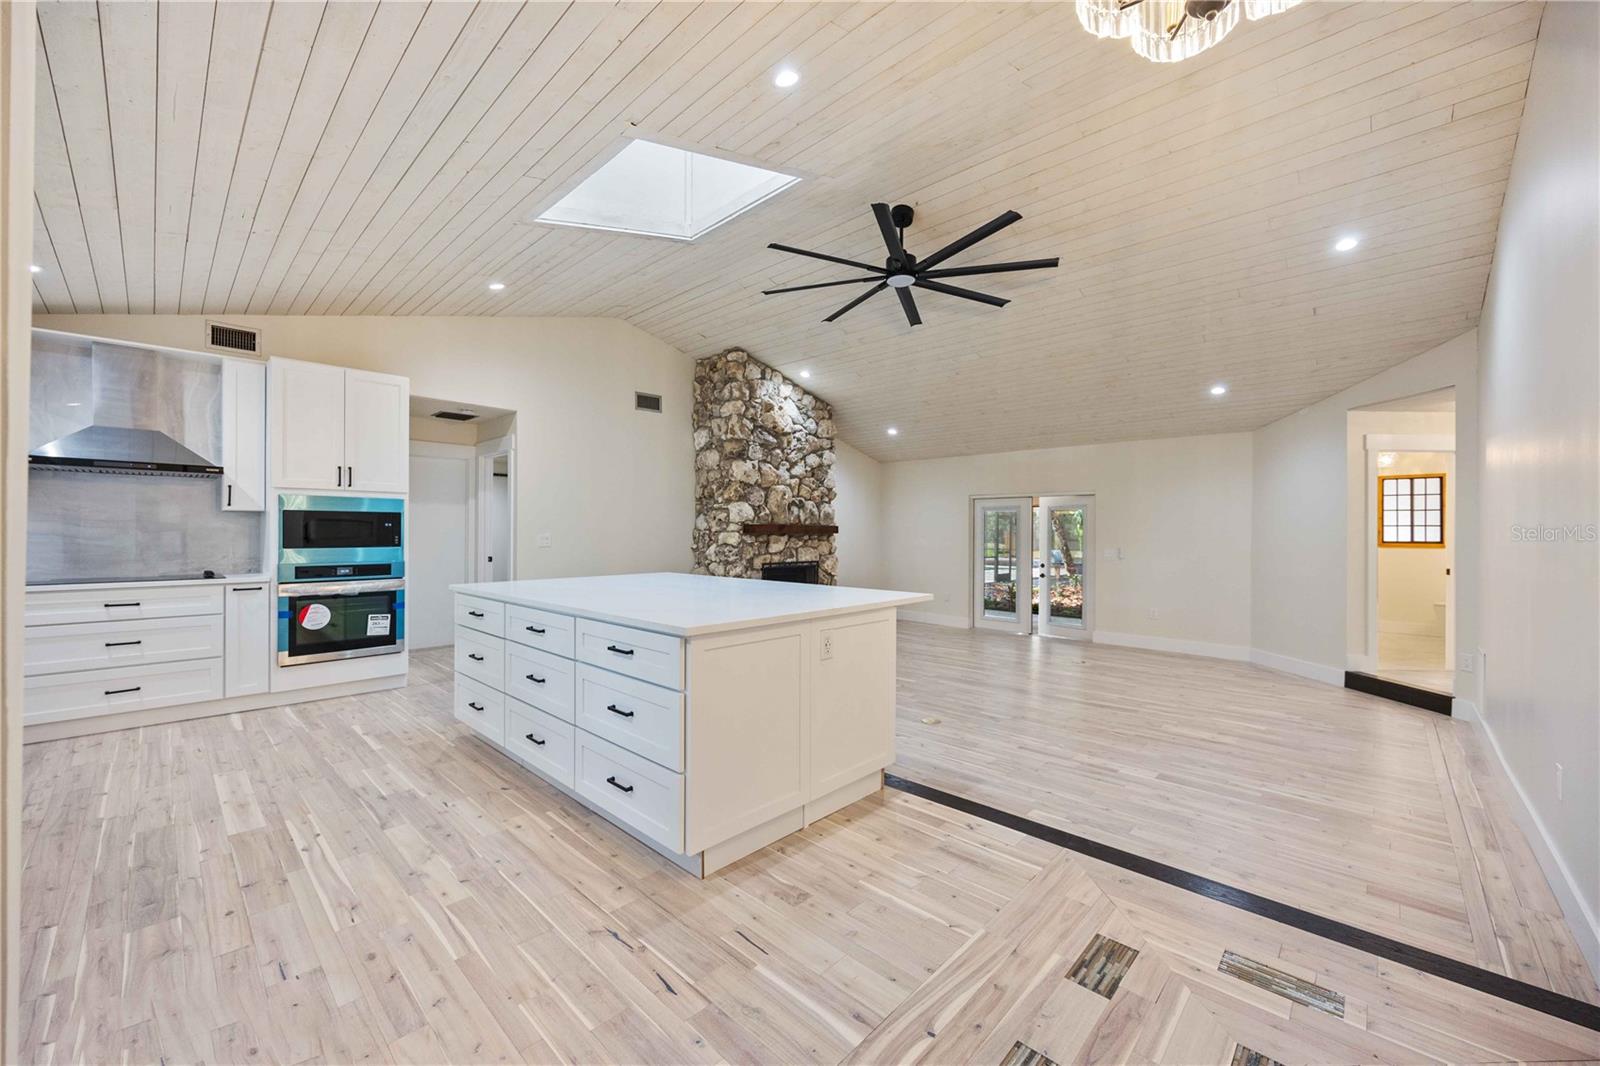
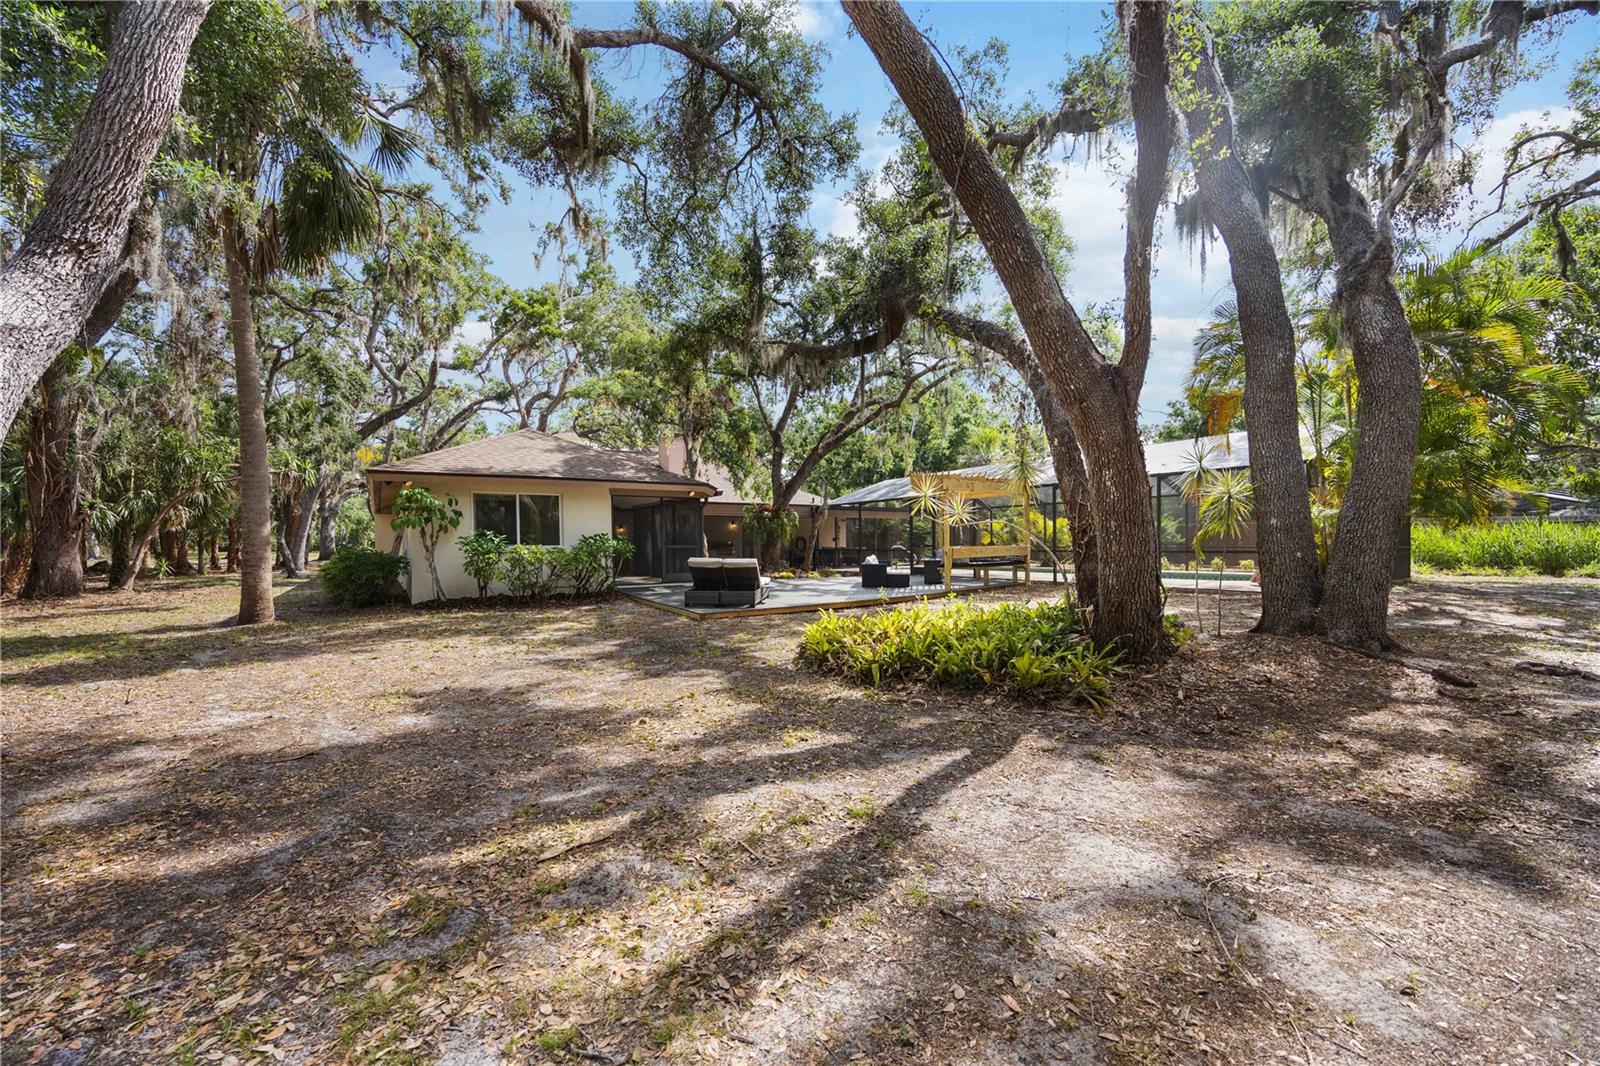
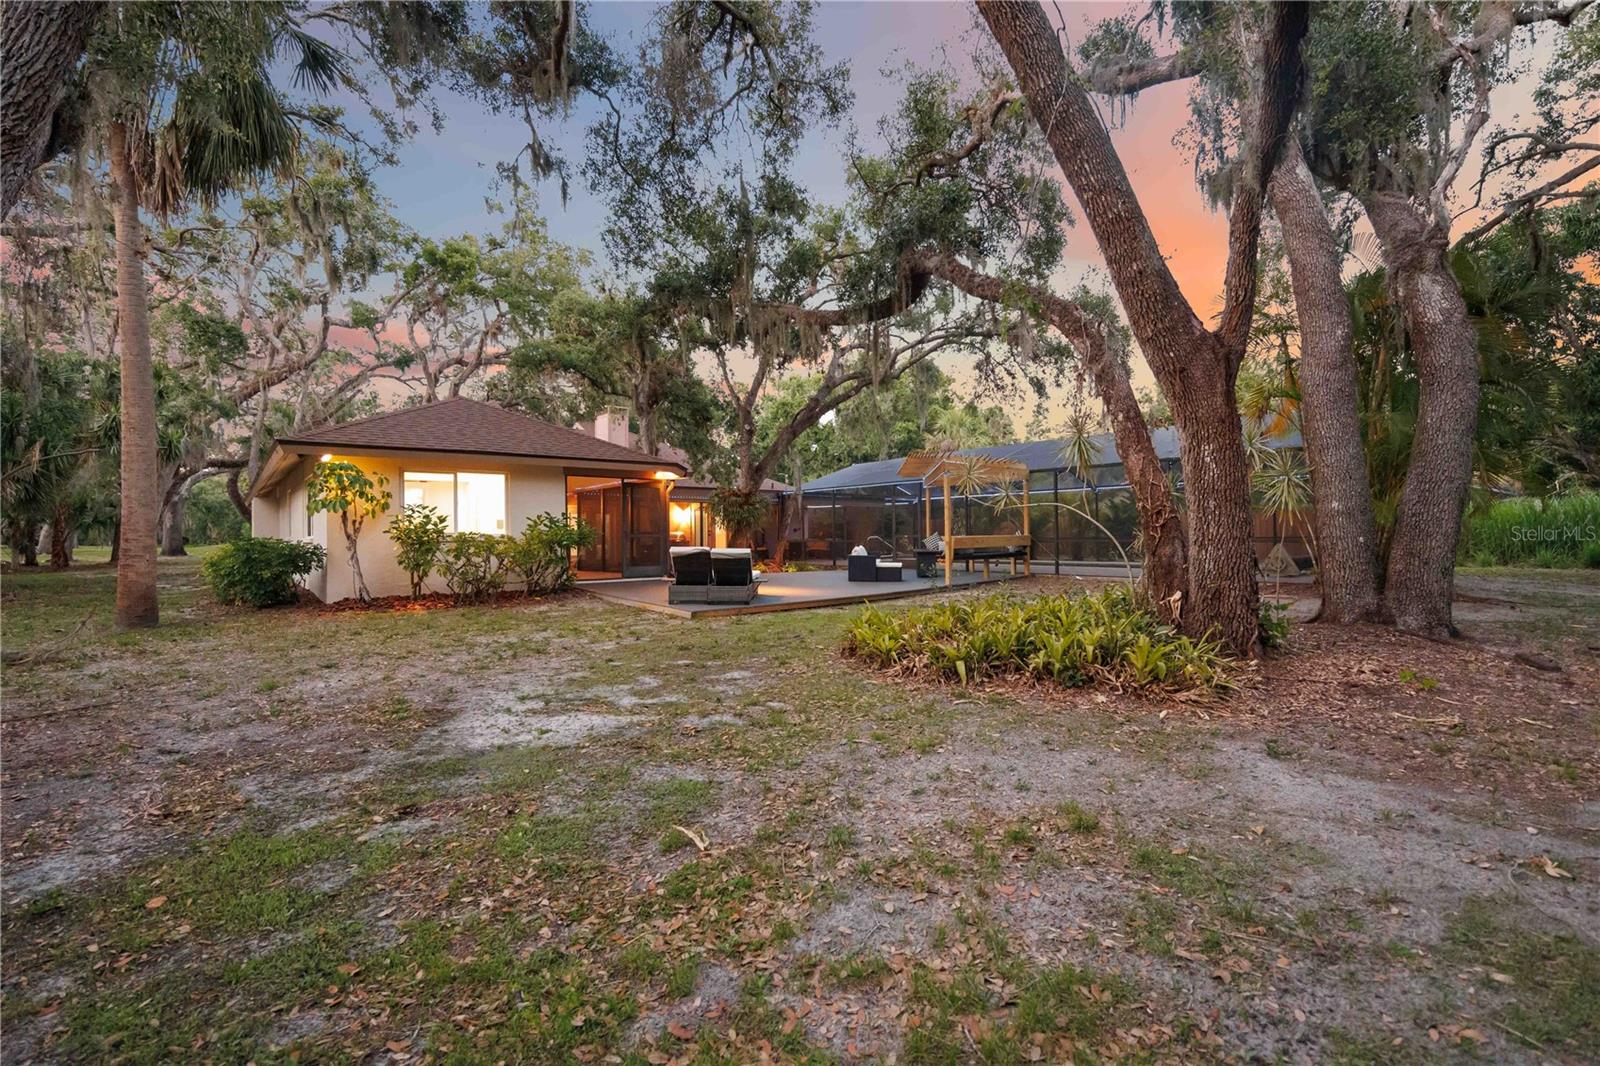
One or more photo(s) has been virtually staged. Welcome to a one-of-a-kind, rebuilt residence nestled on a full acre in the highly desirable community of Hidden Oaks Estates. Rarely does a property of this caliber become available—offering the benefits of brand-new construction in an established, beautifully wooded neighborhood just minutes from everything. This 5-bedroom, 3-bathroom home has been meticulously transformed with top-of-the-line finishes and thoughtful craftsmanship throughout, creating a move-in ready haven for the most discerning buyer. From the moment you step inside, you’ll notice the quality and attention to detail that defines this home. The heart of the home is the all-new kitchen, featuring high-end appliances, custom cabinetry, quartz countertops, and designer fixtures, all opening seamlessly to the spacious great room—ideal for both entertaining and everyday living. Hickory wood flooring flows throughout every room, while distressed shiplap ceilings add warmth and charm. Every bathroom has been completely remodeled with luxury materials, stylish tilework, and modern finishes. Step outside to enjoy the Florida lifestyle on the newly built, expansive deck—just steps from the sparkling, refreshing pool with a paver brick surround, perfect for lounging and soaking up the sun. The outdoor living space is a true showstopper, featuring over 1,200 sq ft of outdoor living including a stylish pergola, built-in bench seating, comfortable outdoor furniture, and a cozy fire pit. And for the ultimate in al fresco entertaining, the outdoor kitchen is fully equipped with a built-in BBQ, beverage refrigerator, and pizza oven—perfect for hosting everything from casual family dinners to lively weekend gatherings. Whether you're relaxing in the sun, cooking up a feast, or enjoying quiet evenings in your private backyard oasis, this thoughtfully designed outdoor area blends comfort and style in a serene natural setting. With plenty of room to garden, play, or expand, the full acre lot offers a rare combination of privacy, versatility, and beauty. Additional highlights include a 3-year-old roof, 16 inches of insulation for superior energy efficiency, an electric pool heater, and a garage upgraded with waterproof laminate flooring, travertine, and cabinets. This home also offers a split floor plan ideal for multi-generational living, guests, or a home office setup. Outside, you’ll find yourself immersed in a private retreat surrounded by mature oaks and lush Florida landscaping, with plenty of space to play, garden, or simply unwind. Located in the charming, deed-restricted community of Hidden Oaks Estates, residents enjoy a peaceful, park-like atmosphere with mature trees, and architectural variety. A standout feature of the neighborhood is the community tennis court—providing a perfect space for friendly matches, active recreation, or simply enjoying the outdoors with neighbors. Hidden Oaks Estates is known for its large custom-built homes, tranquil setting, and unbeatable convenience—just ten minutes from downtown Sarasota, minutes to I-75, and close to beaches, parks, golf courses, schools, shopping, and restaurants. This is a rare opportunity to own a like-new home on a sprawling lot in one of Sarasota’s most beloved neighborhoods. The work has already been done—just move in and start
Build Your Team
Quickly find investor-friendly professionals who can help you succeed in real estate investing at any stage of the investing journey.


Agents
Match with investor-friendly agents who can help you find, analyze, and close your next deal


Lenders
Get the best funding…find investor-friendly lenders who specialize in your deal strategy


Property Managers
Transition to passive investing. Find a trusted property management partnership that lasts.


Tax Pros & Accountants
Taxes and financial reporting made easy—find experts to create tax savings strategies, file taxes, and more
Location
Property Details
Parking
- Description: Garage Faces Rear, Garage Faces Side, Open
- Details: Driveway, Garage Door Opener, Garage Faces Side, Attached
- Garage Spaces: 2
- Spaces Total: 0
Bedroom Information
- # of Bedrooms: 5
Bathroom Information
- # of Baths (Full): 3
- # of Baths (Total): 3.0
Interior Features
- # of Rooms: 10
- # of Stories: 1
- Fireplace: Yes
Exterior Features
- Exterior Walls Materials: Stucco
- Foundation: Block
- Roof Type: Hip
- Roof Material: Shingle
- Pool: Yes
HOA
- Has HOA: Yes
- Association: Ben Hatcher
- HOA Fee: $700/annually
Land Information
- Land Use: Residential
- Land Use Subtype: Single Family Residential
Lot Information
- Parcel ID: 0051080008
- Lot Size: 44967 sqft
Property Information
- Property Type: Single Family Residence
- Year Built: 1979
Tax Information
- Annual Tax: $3,732
Utilities
- Water & Sewer: Public
- Heating: Central, Electric
- Cooling: Central Air
Location
- County: Sarasota
Listing Details
Investment Summary
- Monthly Cash Flow
- -$4,443
- Cap Rate
- 1.8%
- Cash-on-Cash Return
- -19.5%
- Debt Coverage Ratio
- 0.28
- Internal Rate of Return (5 years)
- -14.8%
Cash Flow
Net Operating Income (NOI) minus mortgage payments.
Calculation:
NOI - Mortgage Payments
Cap Rate (Market Value)
Capitalization Rate is a rate of return that compares the yearly Net Operating Income (NOI) to the market value.
Calculation:
NOI / Market Value
Cash-on-Cash Return (CoC)
Annual Cash Flow / Cash Invested
Calculation:
Annual cash flow divided by initial cash invested.
Debt Coverage Ratio (DCR)
Net Operating Income (NOI) divided by total debt payments.
Calculation:
NOI / Total Debt Payments
Internal Rate of Return (IRR)
A metric for assessing profitability over time. IRR is the discount rate at which the net present value (NPV) of all future cash flows (positive and negative) from an investment equals zero — including both periodic cash flow (such as rent) and a projected sale at the end of the holding period. It represents the expected annualized return, accounting for income, expenses, and the recovery of capital through a future sale.
Purchase Details
Purchase PriceThe price paid for the property. Purchase price:
| $1,190,000 |
|---|---|
Amount FinancedThe amount of the purchase financed through a loan. Amount financed:
| -$952,000 |
Down paymentThe initial payment made towards the purchase. Down payment:
| $238,000 |
Closing CostsFees and expenses associated with purchasing a property, typically ranging from 2% to 5% of the home’s purchase price, paid at the end of a home purchase to cover services like lending, title transfer, and taxes. Closing costs:
| $35,700 |
Rehab CostsCosts incurred to repair or improve the property, including: roof, flooring, exterior siding, kitchen, exterior paint, bathrooms, etc. Rehab costs:
| $0 |
Initial Cash InvestedThe total initial cash invested in the property. Calculation:Down payment + Buying costs + Rehab costs Initial cash invested:
| $273,700 |
Square Feet (SQFT)The total square footage of the property. Square feet:
| 2,082 |
Cost Per Square FootCost per square foot of the property. Calculation:Purchase Price / Square Feet Cost per square foot:
| $572 |
Monthly Rent Per Square FootMonthly rent divided by the number of square feet. This ratio helps investors compare rental income efficiency across properties, markets, and unit sizes Calculation:Monthly Rent / Square Feet Monthly rent per square foot:
| $1.49 |
Financing Details
Loan AmountThe total sum of money borrowed from a lender to finance a property purchase. Calculation:Purchase Price - Down Payment
Loan amount:
| $952,000 |
|---|---|
Loan to Value Ratio (LTV)Loan amount divided by the market value of the property. Calculation:Loan Amount / Market Value
Loan to value ratio:
| 80.0% |
Loan TypeThe type of loan (e.g., fixed, adjustable).
Loan type:
| Amortizing |
TermThe loan repayment period in years.
Term:
| 30 years |
Interest RateThe percentage a lender charges on the borrowed amount of a loan, determining the cost of borrowing money.
Interest rate:
| 6.810% |
Principal & Interest (PI)The principal is the portion of the loan payment that reduces the loan balance. The interest is the lender's charge for borrowing money. Calculation:(P * r * (1 + r) ** n) / ((1 + r) ** n - 1) Where:
P = Loan amount (principal)
Principal & interest:
| $6,213 |
Property TaxesAnnual taxes levied by local governments on real estate properties. These taxes fund public services like schools, roads, and emergency services.
Property tax:
| $311 |
InsuranceThe costs for insurance coverage to protect against financial losses due to risks like fire, natural disasters, theft, liability, or tenant-related damages. Calculation:Assumes 7% of gross rental income, unless insurance rates are specified.
Insurance:
| $217 |
Private Mortgage Insurance (PMI)A fee that borrowers pay when they take out a conventional loan with a loan-to-value (LTV) ratio above 80%.
Private mortgage insurance (PMI):
| $0 |
Monthly PaymentThe fixed amount a borrower pays each month to repay a loan. It typically includes principal and interest (P&I) and may also cover property taxes, insurance, HOA fees, and PMI if escrowed. Monthly payment:
| $6,741 |
Operating Income
| % Rent | Monthly | Yearly | |
|---|---|---|---|
Gross RentThe total rental income received from tenants before deducting any expenses. Includes base rent, late fees, pet fees, parking fees, and other recurring charges.
Gross rent:
| $3,100 | $37,200 | |
Vacancy LossExpected loss of rent due to vacancies.
Vacancy loss:
(6%)
| 6% | -$186 | -$2,232 |
Operating IncomeGross rental income minus vacancy loss. Calculation:Gross rent - Vacancy loss
Operating income:
| $2,914 | $34,968 |
Operating Expenses
| % Rent | Monthly | Yearly | |
|---|---|---|---|
Property TaxesAnnual taxes levied by local governments on real estate properties. These taxes fund public services like schools, roads, and emergency services. | 10% | -$311 | -$3,733 |
InsuranceThe costs for insurance coverage to protect against financial losses due to risks like fire, natural disasters, theft, liability, or tenant-related damages. Calculation:Assumes 7% of gross rental income, unless insurance rates are specified. | 7% | -$217 | -$2,604 |
Property ManagementThe costs associated with hiring a property manager to handle the day-to-day operations of a rental property. Includes management fees, leasing fes, eviction fees, etc. Calculation:Assumes 8% of gross rental income. | 8% | -$248 | -$2,976 |
Repairs & MaintenanceOngoing costs for routine upkeep and minor fixes needed to keep a property in good working condition. Calculation:Assumes 5% of gross rental income. Varies by property age and condition. | 5% | -$155 | -$1,860 |
Capital ExpensesLarge, infrequent costs for major improvements or replacements, like a new roof, HVAC system, or appliances. Calculation:Assumes 5% of gross rental income. Varies by property age. | 5% | -$155 | -$1,860 |
HOA FeesRegular dues paid to a Homeowners Association for community maintenance, amenities, and management. Similar fees include: Condo Association Fees, Co-op Maintenance Fees, etc. | 2% | -$58 | -$696 |
Operating ExpensesRecurring costs required to maintain and manage a rental property, including property taxes, insurance, maintenance, repairs, utilities (if paid by the owner), property management fees, and other day-to-day expenses. Calculation:Insurance + Property Taxes + Property Management + Repairs & Maintenance + Capital Expenditures + HOA Fees | 37% | -$1,144 | -$13,729 |
Cash Flow
| Monthly | Yearly | |
|---|---|---|
Net Operating Income (NOI)The income generated from a property after deducting all operating expenses but before deducting mortgage payments, taxes, and capital expenditures. Calculation:Gross Operating Income - Operating Expenses
Net operating income:
| $1,770 | $21,240 |
Mortgage PaymentThe fixed amount a borrower pays each month to repay a loan. It typically includes principal and interest (P&I) and may also cover property taxes, insurance, HOA fees, and PMI if escrowed. | -$6,213 | -$74,556 |
Cash FlowNet Operating Income (NOI) minus mortgage payments. Calculation:NOI - Mortgage Payments | $4,443 | $53,316 |