$584,900
Investment Summary
- Monthly Cash Flow
- -$1,564
- Cap Rate
- 3.1%
- Cash-on-Cash Return
- -14.0%
- Debt Coverage Ratio
- 0.49
- Internal Rate of Return (5 years)
- -9.5%
Cash Flow
Net Operating Income (NOI) minus mortgage payments.
Calculation:
NOI - Mortgage Payments
Cap Rate (Market Value)
Capitalization Rate is a rate of return that compares the yearly Net Operating Income (NOI) to the market value.
Calculation:
NOI / Market Value
Cash-on-Cash Return (CoC)
Annual Cash Flow / Cash Invested
Calculation:
Annual cash flow divided by initial cash invested.
Debt Coverage Ratio (DCR)
Net Operating Income (NOI) divided by total debt payments.
Calculation:
NOI / Total Debt Payments
Internal Rate of Return (IRR)
A metric for assessing profitability over time. IRR is the discount rate at which the net present value (NPV) of all future cash flows (positive and negative) from an investment equals zero — including both periodic cash flow (such as rent) and a projected sale at the end of the holding period. It represents the expected annualized return, accounting for income, expenses, and the recovery of capital through a future sale.
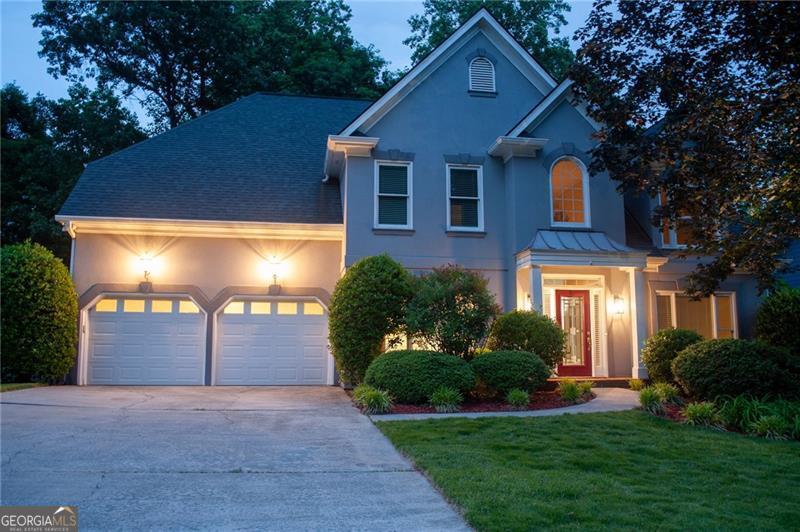
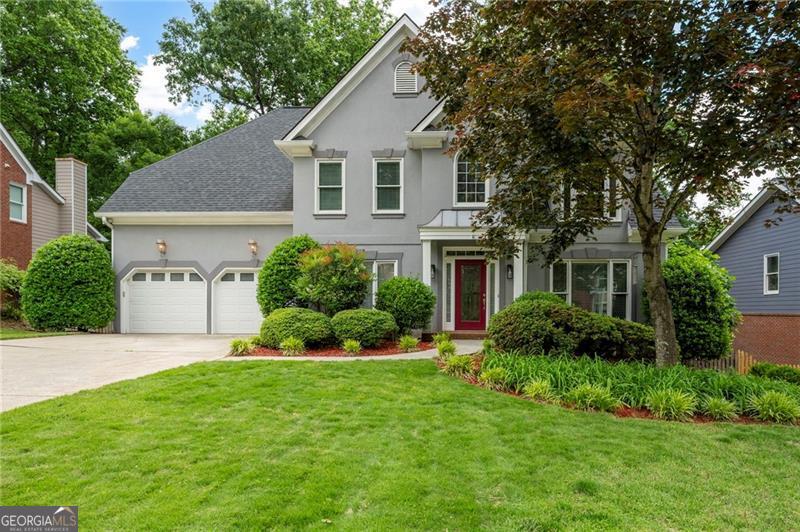
Property Description
Tucked away in a private, treehouse-like setting, this 5-bedroom, 5-bathroom, 4,521 sq. ft. home is a rare find in the highly sought-after neighborhood of Chestnut Hill. Truly exceptional, this property is one of the few in the community that offers real backyard privacy, with stunning views of a lush, thriving canopy and a beautiful creek. Offering the best of both worlds, the home blends secluded natural beauty with the convenience of in-town living. The expansive, fenced-in backyard features over 800 sq. ft. of deck space, a hot tub, and an outdoor shower-making every day feel like a retreat. The outdoor area is nothing short of magical, with beautifully designed landscaping and deck lighting that creates a warm, inviting glow after sunset. Whether you're unwinding under the stars or entertaining guests by the firepit, this serene retreat is a nature lover's dream. Inside, you'll find gorgeous red oak hardwood floors on the main level, brand-new carpet in the bedrooms, and tile flooring in the fully finished rec room in the basement. The main floor seamlessly connects the dining room, family room, and updated kitchen, which features granite countertops and stainless steel gas appliances. Every detail has been thoughtfully updated-from the kitchen to the primary suite. The spacious master bedroom includes double walk-in closets, a sitting area, and an incredible spa-like bathroom with a free-standing tub and a tiled walk-in shower. The fully finished walk-out basement includes a full bath, a recreation room, and a flexible bonus room that can serve as a sixth bedroom or office. It also features a private entrance with its own sidewalk-ideal for guests, in-laws, or potential rental income. If you work from home or just enjoy lightning-fast internet, the home is smart-enabled with Cat 6 wiring in every room and supports AT&T Fiber, making it both modern and highly functional. Energy efficiency is another highlight, with all LED recessed lighting, updated windows, an attic fan for circulation, and brand-new two-stage AC units and furnace. The roof is just eight years old and features 30-year architectural shingles for worry-free living. Located in the desirable Chestnut Hill community, you'll enjoy access to incredible amenities, including two private lakes, a Jr. Olympic-sized swimming pool, eight tennis courts, pickleball, a shaded playground, walking trails, and a clubhouse with a catering kitchen. Plus, you're just minutes from Hwy 92, I-575, and I-75, offering quick access to downtown Woodstock, Kennesaw, and Acworth for shopping, dining, and entertainment. This hidden gem won't stay secret for long-schedule your tour today!
Build Your Team
Quickly find investor-friendly professionals who can help you succeed in real estate investing at any stage of the investing journey.


Agents
Match with investor-friendly agents who can help you find, analyze, and close your next deal


Lenders
Get the best funding…find investor-friendly lenders who specialize in your deal strategy


Property Managers
Transition to passive investing. Find a trusted property management partnership that lasts.


Tax Pros & Accountants
Taxes and financial reporting made easy—find experts to create tax savings strategies, file taxes, and more
Location
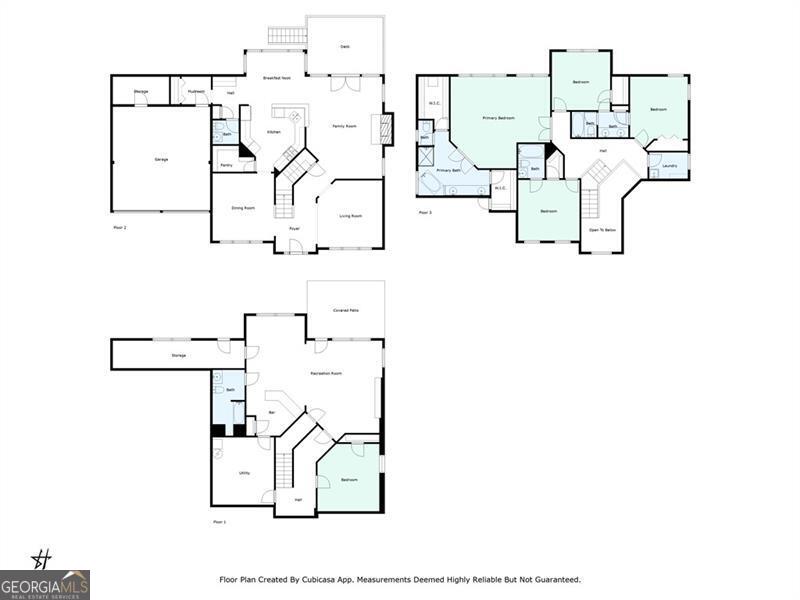
Property Details
Parking
- Description: Attached, Garage, Garage Door Opener, Kitchen Level, Level Driveway
- Details: Garage Door Opener, Garage, Attached
- Garage Spaces: 6
- Spaces Total: 6
Bedroom Information
- # of Bedrooms: 5
Bathroom Information
- # of Baths (Full): 4
- # of Baths (Total): 0.0
Interior Features
- # of Rooms: 9
- # of Stories: 2
- Basement: Yes
- Basement Description: Daylight, Interior Entry, Exterior Entry, Finished, Full
- Fireplace: Yes
Exterior Features
- Exterior Walls Materials: Wood
- Roof Material: Composition
HOA
- Has HOA: Yes
- HOA Fee: $675/annually
Land Information
- Land Use: Residential
- Land Use Subtype: Single Family Residential
Lot Information
- Parcel ID: 16007200620
- Lot Size: 0 sqft
Property Information
- Property Type: Single Family Residence
- Style: Traditional, Craftsman
- Year Built: 1996
Tax Information
- Annual Tax: $5,356
Utilities
- Water & Sewer: Public
- Heating: Natural Gas
- Cooling: Ceiling Fan(s), Central Air
Location
- County: Cobb
Investment Summary
- Monthly Cash Flow
- -$1,564
- Cap Rate
- 3.1%
- Cash-on-Cash Return
- -14.0%
- Debt Coverage Ratio
- 0.49
- Internal Rate of Return (5 years)
- -9.5%
Cash Flow
Net Operating Income (NOI) minus mortgage payments.
Calculation:
NOI - Mortgage Payments
Cap Rate (Market Value)
Capitalization Rate is a rate of return that compares the yearly Net Operating Income (NOI) to the market value.
Calculation:
NOI / Market Value
Cash-on-Cash Return (CoC)
Annual Cash Flow / Cash Invested
Calculation:
Annual cash flow divided by initial cash invested.
Debt Coverage Ratio (DCR)
Net Operating Income (NOI) divided by total debt payments.
Calculation:
NOI / Total Debt Payments
Internal Rate of Return (IRR)
A metric for assessing profitability over time. IRR is the discount rate at which the net present value (NPV) of all future cash flows (positive and negative) from an investment equals zero — including both periodic cash flow (such as rent) and a projected sale at the end of the holding period. It represents the expected annualized return, accounting for income, expenses, and the recovery of capital through a future sale.
Purchase Details
Purchase PriceThe price paid for the property. Purchase price:
| $584,900 |
|---|---|
Amount FinancedThe amount of the purchase financed through a loan. Amount financed:
| -$467,920 |
Down paymentThe initial payment made towards the purchase. Down payment:
| $116,980 |
Closing CostsFees and expenses associated with purchasing a property, typically ranging from 2% to 5% of the home’s purchase price, paid at the end of a home purchase to cover services like lending, title transfer, and taxes. Closing costs:
| $17,547 |
Rehab CostsCosts incurred to repair or improve the property, including: roof, flooring, exterior siding, kitchen, exterior paint, bathrooms, etc. Rehab costs:
| $0 |
Initial Cash InvestedThe total initial cash invested in the property. Calculation:Down payment + Buying costs + Rehab costs Initial cash invested:
| $134,527 |
Square Feet (SQFT)The total square footage of the property. Square feet:
| 4,521 |
Cost Per Square FootCost per square foot of the property. Calculation:Purchase Price / Square Feet Cost per square foot:
| $129 |
Monthly Rent Per Square FootMonthly rent divided by the number of square feet. This ratio helps investors compare rental income efficiency across properties, markets, and unit sizes Calculation:Monthly Rent / Square Feet Monthly rent per square foot:
| $0.64 |
Financing Details
Loan AmountThe total sum of money borrowed from a lender to finance a property purchase. Calculation:Purchase Price - Down Payment
Loan amount:
| $467,920 |
|---|---|
Loan to Value Ratio (LTV)Loan amount divided by the market value of the property. Calculation:Loan Amount / Market Value
Loan to value ratio:
| 80.0% |
Loan TypeThe type of loan (e.g., fixed, adjustable).
Loan type:
| Amortizing |
TermThe loan repayment period in years.
Term:
| 30 years |
Interest RateThe percentage a lender charges on the borrowed amount of a loan, determining the cost of borrowing money.
Interest rate:
| 6.840% |
Principal & Interest (PI)The principal is the portion of the loan payment that reduces the loan balance. The interest is the lender's charge for borrowing money. Calculation:(P * r * (1 + r) ** n) / ((1 + r) ** n - 1) Where:
P = Loan amount (principal)
Principal & interest:
| $3,063 |
Property TaxesAnnual taxes levied by local governments on real estate properties. These taxes fund public services like schools, roads, and emergency services.
Property tax:
| $446 |
InsuranceThe costs for insurance coverage to protect against financial losses due to risks like fire, natural disasters, theft, liability, or tenant-related damages. Calculation:Assumes 7% of gross rental income, unless insurance rates are specified.
Insurance:
| $203 |
Private Mortgage Insurance (PMI)A fee that borrowers pay when they take out a conventional loan with a loan-to-value (LTV) ratio above 80%.
Private mortgage insurance (PMI):
| $0 |
Monthly PaymentThe fixed amount a borrower pays each month to repay a loan. It typically includes principal and interest (P&I) and may also cover property taxes, insurance, HOA fees, and PMI if escrowed. Monthly payment:
| $3,712 |
Operating Income
| % Rent | Monthly | Yearly | |
|---|---|---|---|
Gross RentThe total rental income received from tenants before deducting any expenses. Includes base rent, late fees, pet fees, parking fees, and other recurring charges.
Gross rent:
| $2,900 | $34,800 | |
Vacancy LossExpected loss of rent due to vacancies.
Vacancy loss:
(6%)
| 6% | -$174 | -$2,088 |
Operating IncomeGross rental income minus vacancy loss. Calculation:Gross rent - Vacancy loss
Operating income:
| $2,726 | $32,712 |
Operating Expenses
| % Rent | Monthly | Yearly | |
|---|---|---|---|
Property TaxesAnnual taxes levied by local governments on real estate properties. These taxes fund public services like schools, roads, and emergency services. | 15% | -$446 | -$5,356 |
InsuranceThe costs for insurance coverage to protect against financial losses due to risks like fire, natural disasters, theft, liability, or tenant-related damages. Calculation:Assumes 7% of gross rental income, unless insurance rates are specified. | 7% | -$203 | -$2,436 |
Property ManagementThe costs associated with hiring a property manager to handle the day-to-day operations of a rental property. Includes management fees, leasing fes, eviction fees, etc. Calculation:Assumes 8% of gross rental income. | 8% | -$232 | -$2,784 |
Repairs & MaintenanceOngoing costs for routine upkeep and minor fixes needed to keep a property in good working condition. Calculation:Assumes 5% of gross rental income. Varies by property age and condition. | 5% | -$145 | -$1,740 |
Capital ExpensesLarge, infrequent costs for major improvements or replacements, like a new roof, HVAC system, or appliances. Calculation:Assumes 5% of gross rental income. Varies by property age. | 5% | -$145 | -$1,740 |
HOA FeesRegular dues paid to a Homeowners Association for community maintenance, amenities, and management. Similar fees include: Condo Association Fees, Co-op Maintenance Fees, etc. | 2% | -$56 | -$672 |
Operating ExpensesRecurring costs required to maintain and manage a rental property, including property taxes, insurance, maintenance, repairs, utilities (if paid by the owner), property management fees, and other day-to-day expenses. Calculation:Insurance + Property Taxes + Property Management + Repairs & Maintenance + Capital Expenditures + HOA Fees | 42% | -$1,227 | -$14,728 |
Cash Flow
| Monthly | Yearly | |
|---|---|---|
Net Operating Income (NOI)The income generated from a property after deducting all operating expenses but before deducting mortgage payments, taxes, and capital expenditures. Calculation:Gross Operating Income - Operating Expenses
Net operating income:
| $1,499 | $17,988 |
Mortgage PaymentThe fixed amount a borrower pays each month to repay a loan. It typically includes principal and interest (P&I) and may also cover property taxes, insurance, HOA fees, and PMI if escrowed. | -$3,063 | -$36,756 |
Cash FlowNet Operating Income (NOI) minus mortgage payments. Calculation:NOI - Mortgage Payments | $1,564 | $18,768 |