$810,000
Investment Summary
- Monthly Cash Flow
- -$1,317
- Cap Rate
- 4.3%
- Cash-on-Cash Return
- -8.5%
- Debt Coverage Ratio
- 0.69
- Internal Rate of Return (5 years)
- -4.2%
Cash Flow
Net Operating Income (NOI) minus mortgage payments.
Calculation:
NOI - Mortgage Payments
Cap Rate (Market Value)
Capitalization Rate is a rate of return that compares the yearly Net Operating Income (NOI) to the market value.
Calculation:
NOI / Market Value
Cash-on-Cash Return (CoC)
Annual Cash Flow / Cash Invested
Calculation:
Annual cash flow divided by initial cash invested.
Debt Coverage Ratio (DCR)
Net Operating Income (NOI) divided by total debt payments.
Calculation:
NOI / Total Debt Payments
Internal Rate of Return (IRR)
A metric for assessing profitability over time. IRR is the discount rate at which the net present value (NPV) of all future cash flows (positive and negative) from an investment equals zero — including both periodic cash flow (such as rent) and a projected sale at the end of the holding period. It represents the expected annualized return, accounting for income, expenses, and the recovery of capital through a future sale.
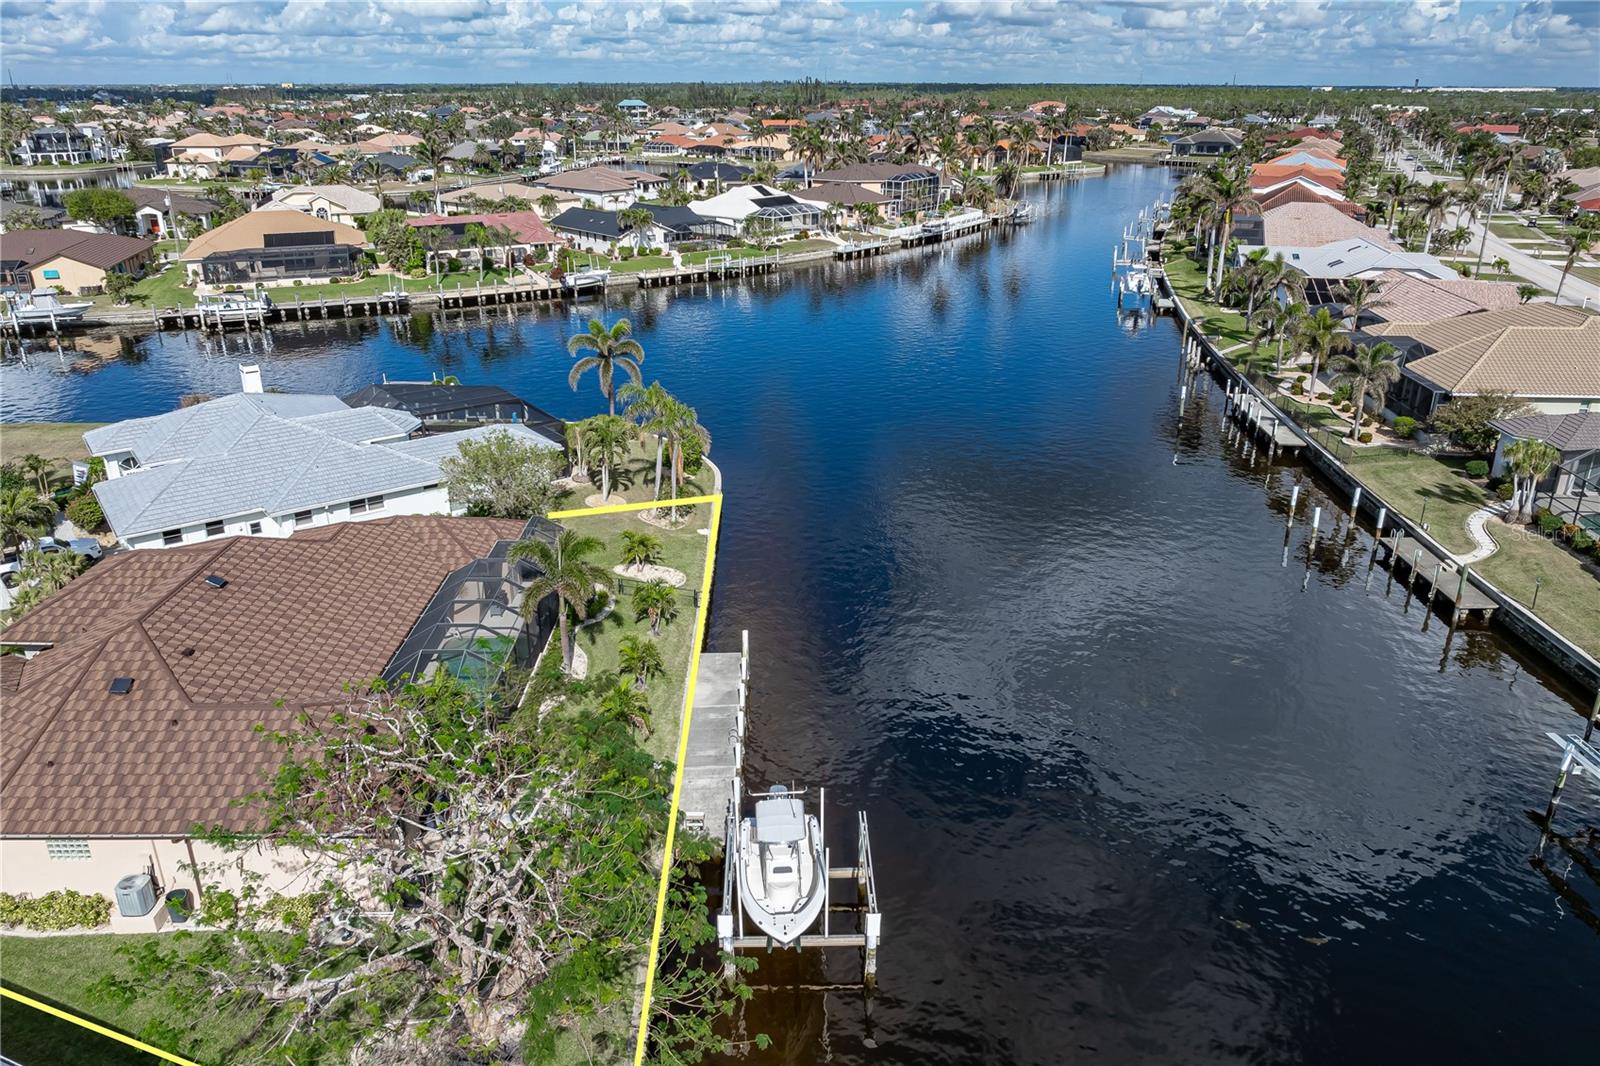
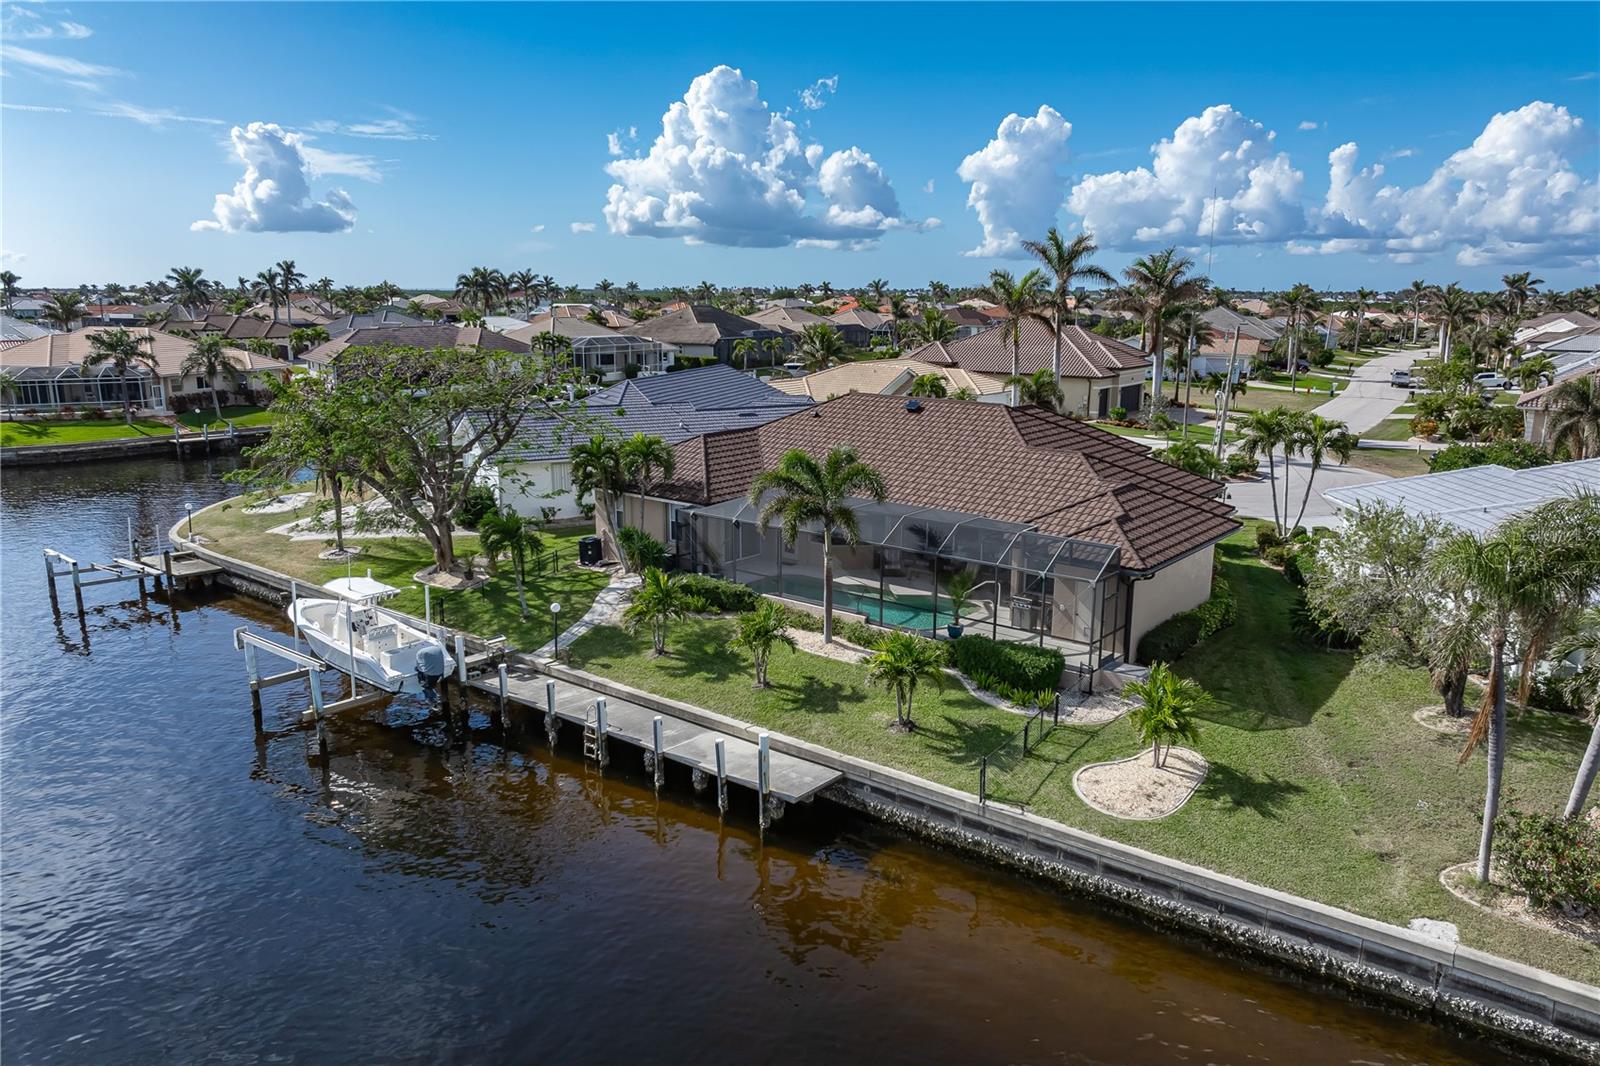
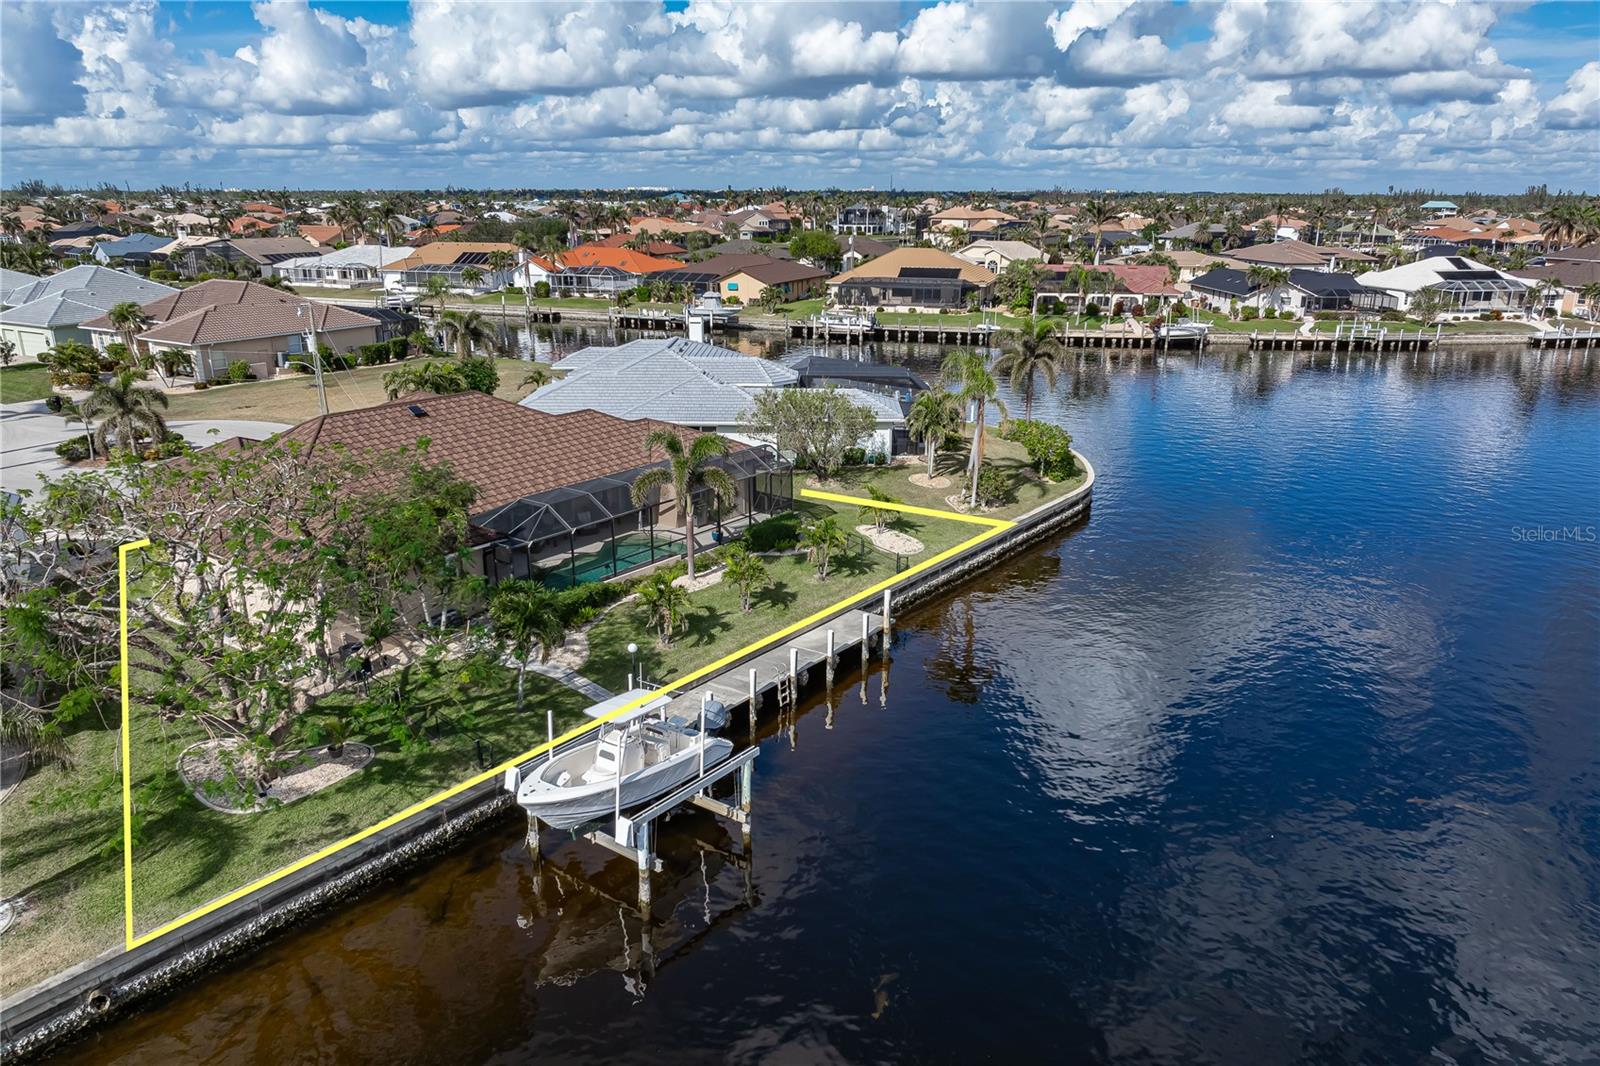
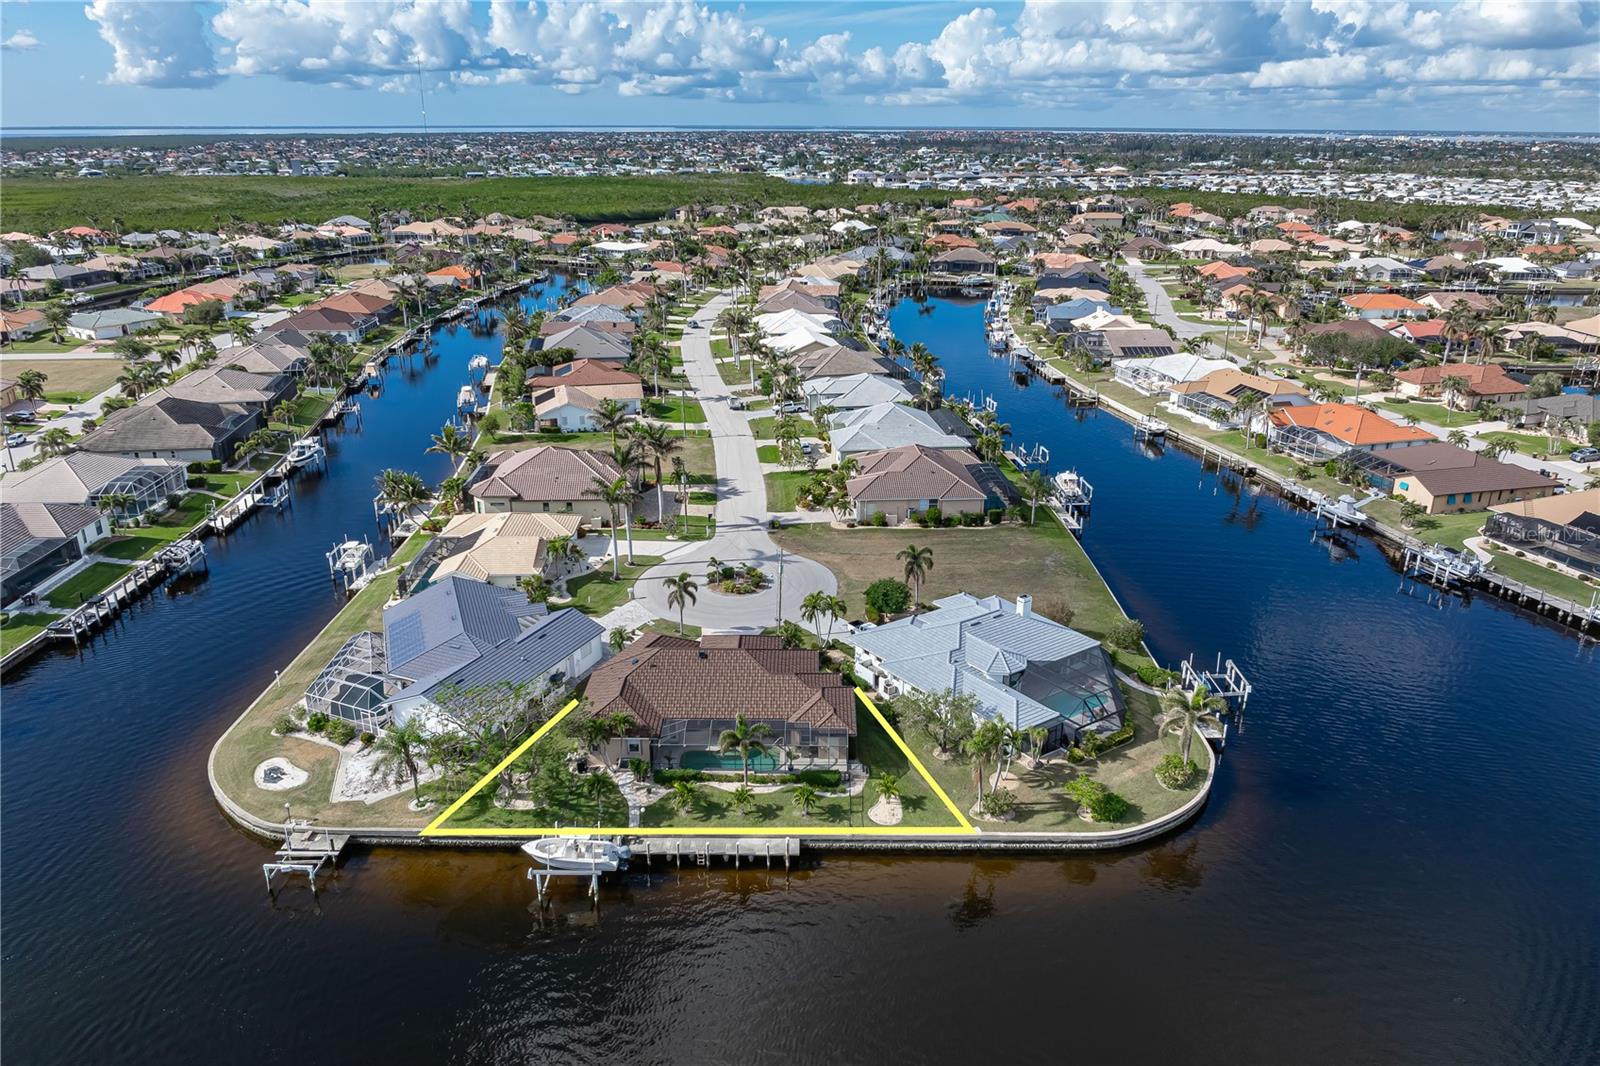
Property Description
CUSTOM WATERFRONT HOME IN BSI ON KEY LOT W/**NEW METAL TILE ROOF** & 140 FT OF SEAWALL! Check out this 3 bed/2 bath, waterfront home w/over 2,200 sq ft of living space in the deed-restricted waterfront & golf community of Burnt Store Isles. Home is located on a quiet cul-de-sac surrounded by friendly neighbors. The interior of the home is bright & airy w/walls of sliding glass doors & large picture windows in almost every room. Architectural details include soaring cathedral ceilings, porcelain tile flooring throughout the main living areas as well as the guest bedroom/den, decorative plant shelves, rectangular transom windows in great room, gourmet kitchen w/adjacent breakfast nook & inviting outdoor living area. The great room features a built-in entertainment center w/lighted display shelves & disappearing sliding glass doors that extend the living space out onto the lanai. Centrally located kitchen offers a wraparound, multi-level breakfast bar, built-in convection oven/convection microwave, cook-top range w/hood plus ample cabinet & counter space. Almost all of the cabinets have pull-out shelves. The kitchen also features a tile back splash & under cabinet lighting. Lots of space for entertaining w/a formal dining area & large breakfast nook. Breakfast nook boasts a mitered aquarium glass window & built-in desk. The master suite offers walk-out access to the lanai, a spa-like master bath & oversized walk-in closet. The master bath has dual sinks, a large linen closet, private WC, a corner tub plus a tile & glass walk-in shower. The split bedroom offers large guest rooms. One guest room has walk-out access to the lanai w/pool & canal views while the other doubles as a home office/den. The guest bath features a combination tub/shower & linen closet. Outside, the lanai offers an in-ground, heated pool & lots of room for outdoor entertaining w/covered seating area & a sun deck off to the side by the outdoor shower & pool storage closet. Sit back & enjoy the canal view - watch as boats & the occasional dolphin or manatee wander past. Two doors from the screened lanai lead out to the fenced back yard. A concrete walkway leads to the 45 ft extended concrete dock w/12,000 lb boat lift. Boat lift perfectly positioned off to the side so as not to block the water view. Water & electric hook-ups are available dockside. Set off on your latest maritime adventure from your own backyard & start enjoying some of the best fishing & boating SW Florida has to offer. Other amenities include whole-house hurricane protection w/accordion shutters, water softener, attached oversized two car garage w/workshop & well-maintained tropical landscaping. Burnt Store Isles has an optional HOA & optional boat club both w/active social calendars. Boat for sale separately.
Build Your Team
Quickly find investor-friendly professionals who can help you succeed in real estate investing at any stage of the investing journey.


Agents
Match with investor-friendly agents who can help you find, analyze, and close your next deal


Lenders
Get the best funding…find investor-friendly lenders who specialize in your deal strategy


Property Managers
Transition to passive investing. Find a trusted property management partnership that lasts.


Tax Pros & Accountants
Taxes and financial reporting made easy—find experts to create tax savings strategies, file taxes, and more
Location
Property Details
Parking
- Description: Garage Door Opener, Oversized, Workshop in Garage
- Details: Garage Door Opener, Oversized, Workshop in Garage, Attached
- Garage Spaces: 2
- Spaces Total: 0
Bedroom Information
- # of Bedrooms: 3
Bathroom Information
- # of Baths (Full): 2
- # of Baths (Total): 2.0
Interior Features
- # of Rooms: 11
- # of Stories: 1
Exterior Features
- Exterior Walls Materials: Concrete Block
- Roof Material: Metal, Tile
- Pool: Yes
HOA
- Has HOA: Yes
- Association: Burnt Store Isles Association
- HOA Fee: $50/annually
Land Information
- Land Use: Residential
- Land Use Subtype: Single Family Residential
Lot Information
- Parcel ID: 412320305005
- Lot Size: 10170 sqft
Property Information
- Property Type: Single Family Residence
- Style: Custom, Florida
- Year Built: 2001
Tax Information
- Annual Tax: $7,079
Utilities
- Water & Sewer: Public
- Heating: Central, Electric
- Cooling: Central Air
Location
- County: Charlotte
Listing Details
Investment Summary
- Monthly Cash Flow
- -$1,317
- Cap Rate
- 4.3%
- Cash-on-Cash Return
- -8.5%
- Debt Coverage Ratio
- 0.69
- Internal Rate of Return (5 years)
- -4.2%
Cash Flow
Net Operating Income (NOI) minus mortgage payments.
Calculation:
NOI - Mortgage Payments
Cap Rate (Market Value)
Capitalization Rate is a rate of return that compares the yearly Net Operating Income (NOI) to the market value.
Calculation:
NOI / Market Value
Cash-on-Cash Return (CoC)
Annual Cash Flow / Cash Invested
Calculation:
Annual cash flow divided by initial cash invested.
Debt Coverage Ratio (DCR)
Net Operating Income (NOI) divided by total debt payments.
Calculation:
NOI / Total Debt Payments
Internal Rate of Return (IRR)
A metric for assessing profitability over time. IRR is the discount rate at which the net present value (NPV) of all future cash flows (positive and negative) from an investment equals zero — including both periodic cash flow (such as rent) and a projected sale at the end of the holding period. It represents the expected annualized return, accounting for income, expenses, and the recovery of capital through a future sale.
Purchase Details
Purchase PriceThe price paid for the property. Purchase price:
| $810,000 |
|---|---|
Amount FinancedThe amount of the purchase financed through a loan. Amount financed:
| -$648,000 |
Down paymentThe initial payment made towards the purchase. Down payment:
| $162,000 |
Closing CostsFees and expenses associated with purchasing a property, typically ranging from 2% to 5% of the home’s purchase price, paid at the end of a home purchase to cover services like lending, title transfer, and taxes. Closing costs:
| $24,300 |
Rehab CostsCosts incurred to repair or improve the property, including: roof, flooring, exterior siding, kitchen, exterior paint, bathrooms, etc. Rehab costs:
| $0 |
Initial Cash InvestedThe total initial cash invested in the property. Calculation:Down payment + Buying costs + Rehab costs Initial cash invested:
| $186,300 |
Square Feet (SQFT)The total square footage of the property. Square feet:
| 2,285 |
Cost Per Square FootCost per square foot of the property. Calculation:Purchase Price / Square Feet Cost per square foot:
| $354 |
Monthly Rent Per Square FootMonthly rent divided by the number of square feet. This ratio helps investors compare rental income efficiency across properties, markets, and unit sizes Calculation:Monthly Rent / Square Feet Monthly rent per square foot:
| $2.23 |
Financing Details
Loan AmountThe total sum of money borrowed from a lender to finance a property purchase. Calculation:Purchase Price - Down Payment
Loan amount:
| $648,000 |
|---|---|
Loan to Value Ratio (LTV)Loan amount divided by the market value of the property. Calculation:Loan Amount / Market Value
Loan to value ratio:
| 80.0% |
Loan TypeThe type of loan (e.g., fixed, adjustable).
Loan type:
| Amortizing |
TermThe loan repayment period in years.
Term:
| 30 years |
Interest RateThe percentage a lender charges on the borrowed amount of a loan, determining the cost of borrowing money.
Interest rate:
| 6.840% |
Principal & Interest (PI)The principal is the portion of the loan payment that reduces the loan balance. The interest is the lender's charge for borrowing money. Calculation:(P * r * (1 + r) ** n) / ((1 + r) ** n - 1) Where:
P = Loan amount (principal)
Principal & interest:
| $4,242 |
Property TaxesAnnual taxes levied by local governments on real estate properties. These taxes fund public services like schools, roads, and emergency services.
Property tax:
| $590 |
InsuranceThe costs for insurance coverage to protect against financial losses due to risks like fire, natural disasters, theft, liability, or tenant-related damages. Calculation:Assumes 7% of gross rental income, unless insurance rates are specified.
Insurance:
| $357 |
Private Mortgage Insurance (PMI)A fee that borrowers pay when they take out a conventional loan with a loan-to-value (LTV) ratio above 80%.
Private mortgage insurance (PMI):
| $0 |
Monthly PaymentThe fixed amount a borrower pays each month to repay a loan. It typically includes principal and interest (P&I) and may also cover property taxes, insurance, HOA fees, and PMI if escrowed. Monthly payment:
| $5,189 |
Operating Income
| % Rent | Monthly | Yearly | |
|---|---|---|---|
Gross RentThe total rental income received from tenants before deducting any expenses. Includes base rent, late fees, pet fees, parking fees, and other recurring charges.
Gross rent:
| $5,100 | $61,200 | |
Vacancy LossExpected loss of rent due to vacancies.
Vacancy loss:
(6%)
| 6% | -$306 | -$3,672 |
Operating IncomeGross rental income minus vacancy loss. Calculation:Gross rent - Vacancy loss
Operating income:
| $4,794 | $57,528 |
Operating Expenses
| % Rent | Monthly | Yearly | |
|---|---|---|---|
Property TaxesAnnual taxes levied by local governments on real estate properties. These taxes fund public services like schools, roads, and emergency services. | 12% | -$590 | -$7,079 |
InsuranceThe costs for insurance coverage to protect against financial losses due to risks like fire, natural disasters, theft, liability, or tenant-related damages. Calculation:Assumes 7% of gross rental income, unless insurance rates are specified. | 7% | -$357 | -$4,284 |
Property ManagementThe costs associated with hiring a property manager to handle the day-to-day operations of a rental property. Includes management fees, leasing fes, eviction fees, etc. Calculation:Assumes 8% of gross rental income. | 8% | -$408 | -$4,896 |
Repairs & MaintenanceOngoing costs for routine upkeep and minor fixes needed to keep a property in good working condition. Calculation:Assumes 5% of gross rental income. Varies by property age and condition. | 5% | -$255 | -$3,060 |
Capital ExpensesLarge, infrequent costs for major improvements or replacements, like a new roof, HVAC system, or appliances. Calculation:Assumes 5% of gross rental income. Varies by property age. | 5% | -$255 | -$3,060 |
HOA FeesRegular dues paid to a Homeowners Association for community maintenance, amenities, and management. Similar fees include: Condo Association Fees, Co-op Maintenance Fees, etc. | 0% | -$4 | -$48 |
Operating ExpensesRecurring costs required to maintain and manage a rental property, including property taxes, insurance, maintenance, repairs, utilities (if paid by the owner), property management fees, and other day-to-day expenses. Calculation:Insurance + Property Taxes + Property Management + Repairs & Maintenance + Capital Expenditures + HOA Fees | 37% | -$1,869 | -$22,427 |
Cash Flow
| Monthly | Yearly | |
|---|---|---|
Net Operating Income (NOI)The income generated from a property after deducting all operating expenses but before deducting mortgage payments, taxes, and capital expenditures. Calculation:Gross Operating Income - Operating Expenses
Net operating income:
| $2,925 | $35,100 |
Mortgage PaymentThe fixed amount a borrower pays each month to repay a loan. It typically includes principal and interest (P&I) and may also cover property taxes, insurance, HOA fees, and PMI if escrowed. | -$4,242 | -$50,904 |
Cash FlowNet Operating Income (NOI) minus mortgage payments. Calculation:NOI - Mortgage Payments | $1,317 | $15,804 |