$1,499,000
Investment Summary
- Monthly Cash Flow
- -$2,897
- Cap Rate
- 4.0%
- Cash-on-Cash Return
- -10.1%
- Debt Coverage Ratio
- 0.63
- Internal Rate of Return (5 years)
- -5.8%
Cash Flow
Net Operating Income (NOI) minus mortgage payments.
Calculation:
NOI - Mortgage Payments
Cap Rate (Market Value)
Capitalization Rate is a rate of return that compares the yearly Net Operating Income (NOI) to the market value.
Calculation:
NOI / Market Value
Cash-on-Cash Return (CoC)
Annual Cash Flow / Cash Invested
Calculation:
Annual cash flow divided by initial cash invested.
Debt Coverage Ratio (DCR)
Net Operating Income (NOI) divided by total debt payments.
Calculation:
NOI / Total Debt Payments
Internal Rate of Return (IRR)
A metric for assessing profitability over time. IRR is the discount rate at which the net present value (NPV) of all future cash flows (positive and negative) from an investment equals zero — including both periodic cash flow (such as rent) and a projected sale at the end of the holding period. It represents the expected annualized return, accounting for income, expenses, and the recovery of capital through a future sale.
Property Description
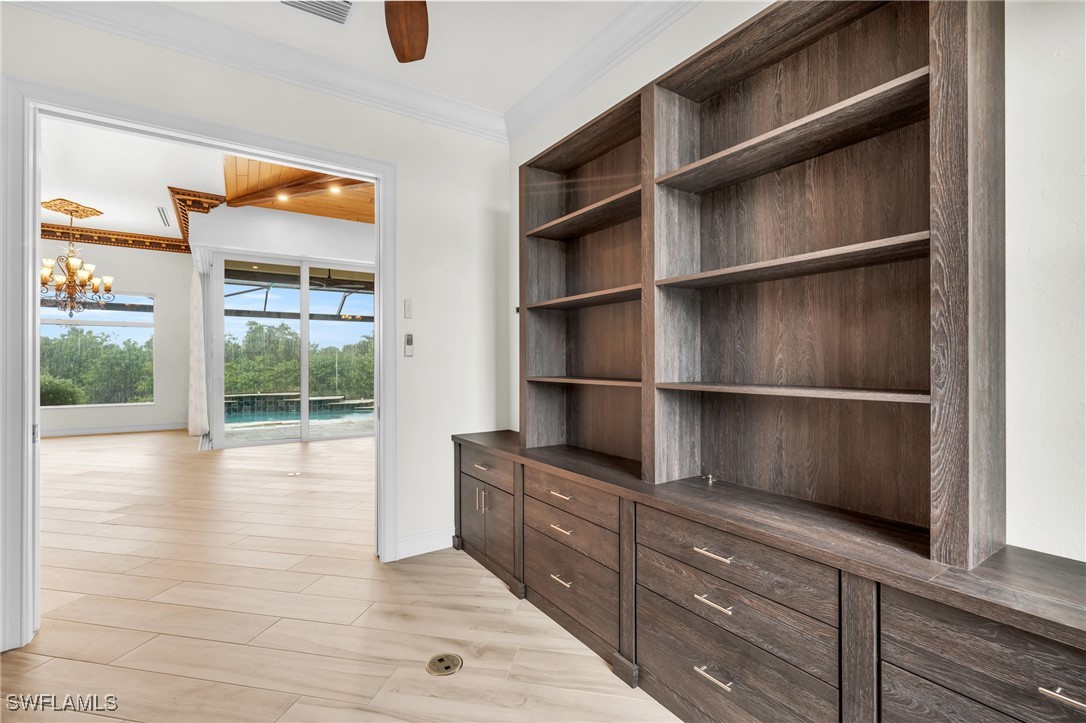
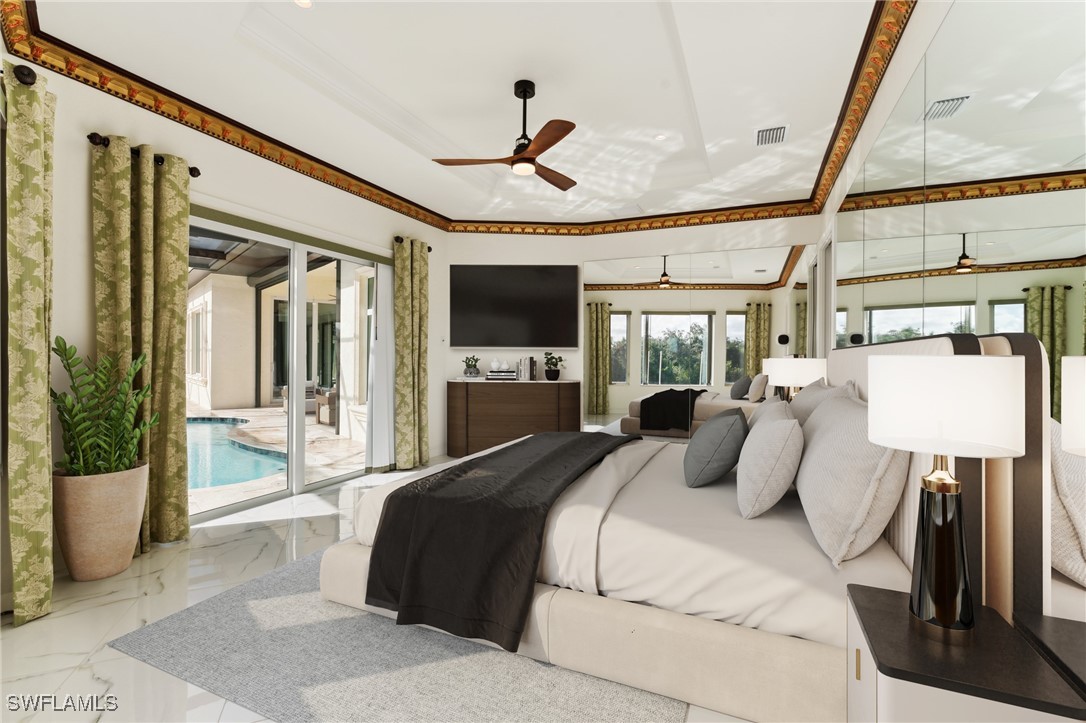
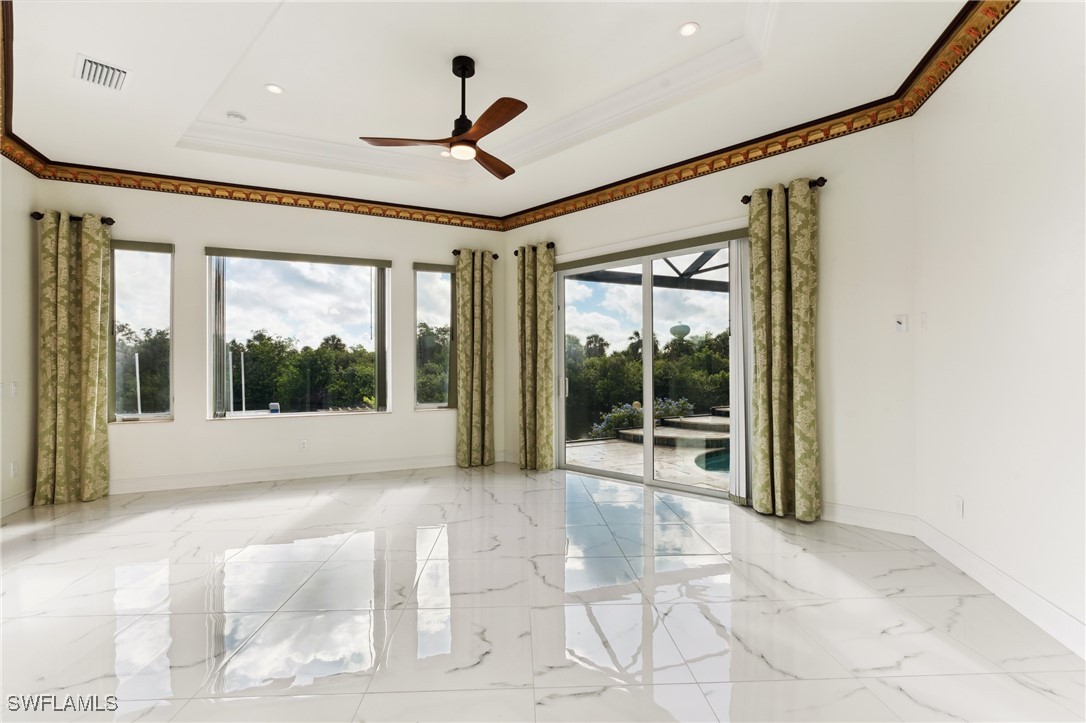
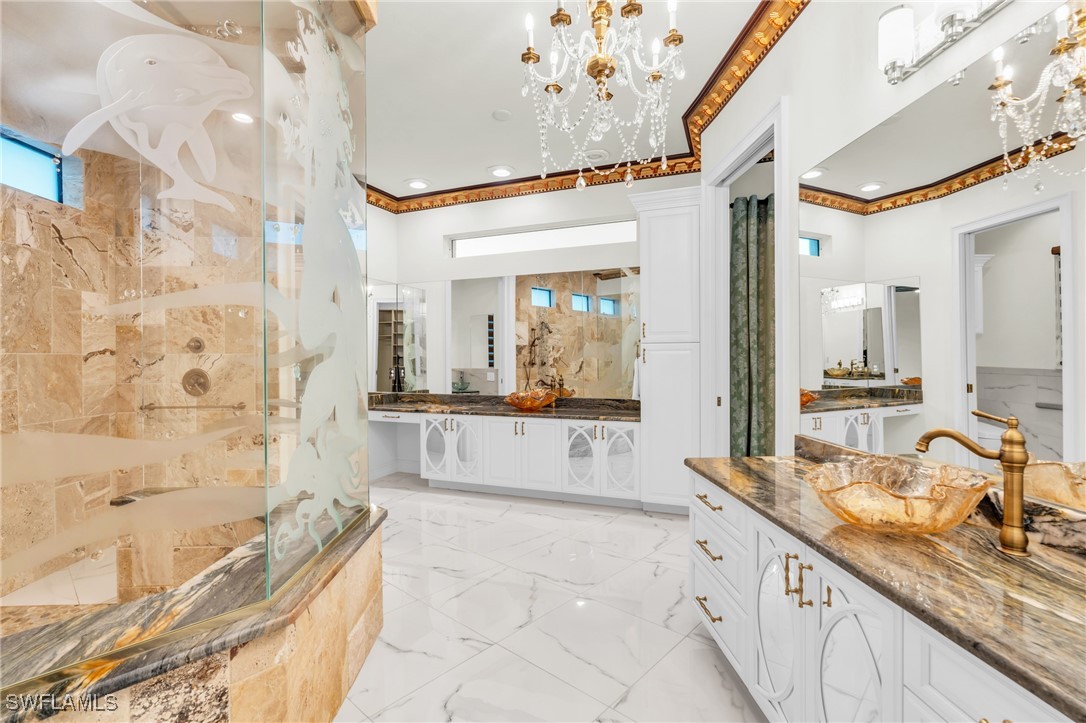
Nestled in the desirable canal community of Burnt Store Isles, this 2020-built custom home is a masterpiece of craftsmanship and elegance. Boasting 140’ on the water and a tranquil rim canal location, this residence offers the luxurious waterfront lifestyle you’ve been waiting for. Step inside through magnificent custom double arched doors made of wrought iron and glass measuring 10ft x 6ft. Once inside the grand foyer, you are drawn into the great room with 14’ cypress ceilings and an open floorplan ideal for entertaining. Grab a cocktail from the beautifully appointed wet bar or the perfect espresso from the built-in Miele coffee system with reverse osmosis water filtration system. The heart of the home is the stunning chef’s kitchen, with solid wood cabinetry, granite counters and a large island that boasts a quartz countertop with waterfall edges. The handmade copper kitchen sink and a striking copper range hood add an artistic touch to this gourmet kitchen. Throughout the rest of home, you will discover a world of bespoke details, from the hand-carved sinks that grace each bathroom to the etched glass showers that elevate your everyday routine. Wake up in the primary suite to the beautiful sunrise overlooking the lanai/pool area as well as the canal and mangroves for a private and relaxed feeling. Step into the luxurious primary bath, which boasts a roman walk-in shower with a hand carved glass surround, dual vanities featuring hand-blown glass sinks and beautiful granite countertops. Just off the bathroom is the large custom closet that has direct access to the spacious laundry room, making laundry a breeze. Perfectly accommodating overnight guests, the second primary suite in the guest wing of the home offers a spa-like retreat, complete with a large custom walk-in closet, luxurious steam bath for ultimate relaxation and direct access to the lanai. Outside, the expansive lanai beckons you to enjoy the Florida lifestyle with a private pool, perfect for lounging or entertaining. The lanai is stunning with its French style Leonardo stone floor surrounding a custom salt-water pool boasting two waterfalls and an outdoor kitchen. Beyond the lanai, a canal-front setting awaits, complete with a private boat dock and an impressive 16,000-pound boat lift, making it a boater’s paradise. Additional features include: Hurricane impact windows and doors, Louis Vuitton Octopus mailbox, 4-zone Amana AC, Thermador and Miele appliances, Toto Japanese bidet/toilets, water saving sprinkler system, climate controlled garage, 20KW Kohler whole house generator with a 500 gallon underground storage tank. This home’s perfect blend of luxury, functionality, and artistic detail creates an unrivaled living experience in one of Punta Gorda’s most sought-after waterfront communities. This is a must-see property, schedule your viewing today and start living in luxury.
Build Your Team
Quickly find investor-friendly professionals who can help you succeed in real estate investing at any stage of the investing journey.


Agents
Match with investor-friendly agents who can help you find, analyze, and close your next deal


Lenders
Get the best funding…find investor-friendly lenders who specialize in your deal strategy


Property Managers
Transition to passive investing. Find a trusted property management partnership that lasts.


Tax Pros & Accountants
Taxes and financial reporting made easy—find experts to create tax savings strategies, file taxes, and more
Location
Property Details
Parking
- Description: Driveway, Garage Door Opener, Oversized
- Details: Attached, Garage, Garage Door Opener
- Garage Spaces: 2
- Spaces Total: 0
Bedroom Information
- # of Bedrooms: 3
Bathroom Information
- # of Baths (Full): 3
- # of Baths (Total): 3.0
Interior Features
- # of Rooms: 8
- # of Stories: 1
Exterior Features
- Exterior Walls Materials: Stucco
- Roof Material: Tile
- Pool: Yes
Land Information
- Land Use: Residential
- Land Use Subtype: Single Family Residential
Lot Information
- Parcel ID: 412329257008
- Lot Size: 0 sqft
Property Information
- Property Type: Single Family Residence
- Style: Ranch, One Story
- Year Built: 2020
Tax Information
- Annual Tax: $1,010
Utilities
- Heating: Central, Electric
- Cooling: Central Air, Ceiling Fan(s), Electric
Location
- County: Charlotte
Listing Details
Investment Summary
- Monthly Cash Flow
- -$2,897
- Cap Rate
- 4.0%
- Cash-on-Cash Return
- -10.1%
- Debt Coverage Ratio
- 0.63
- Internal Rate of Return (5 years)
- -5.8%
Cash Flow
Net Operating Income (NOI) minus mortgage payments.
Calculation:
NOI - Mortgage Payments
Cap Rate (Market Value)
Capitalization Rate is a rate of return that compares the yearly Net Operating Income (NOI) to the market value.
Calculation:
NOI / Market Value
Cash-on-Cash Return (CoC)
Annual Cash Flow / Cash Invested
Calculation:
Annual cash flow divided by initial cash invested.
Debt Coverage Ratio (DCR)
Net Operating Income (NOI) divided by total debt payments.
Calculation:
NOI / Total Debt Payments
Internal Rate of Return (IRR)
A metric for assessing profitability over time. IRR is the discount rate at which the net present value (NPV) of all future cash flows (positive and negative) from an investment equals zero — including both periodic cash flow (such as rent) and a projected sale at the end of the holding period. It represents the expected annualized return, accounting for income, expenses, and the recovery of capital through a future sale.
Purchase Details
Purchase PriceThe price paid for the property. Purchase price:
| $1,499,000 |
|---|---|
Amount FinancedThe amount of the purchase financed through a loan. Amount financed:
| -$1,199,200 |
Down paymentThe initial payment made towards the purchase. Down payment:
| $299,800 |
Closing CostsFees and expenses associated with purchasing a property, typically ranging from 2% to 5% of the home’s purchase price, paid at the end of a home purchase to cover services like lending, title transfer, and taxes. Closing costs:
| $44,970 |
Rehab CostsCosts incurred to repair or improve the property, including: roof, flooring, exterior siding, kitchen, exterior paint, bathrooms, etc. Rehab costs:
| $0 |
Initial Cash InvestedThe total initial cash invested in the property. Calculation:Down payment + Buying costs + Rehab costs Initial cash invested:
| $344,770 |
Square Feet (SQFT)The total square footage of the property. Square feet:
| 2,709 |
Cost Per Square FootCost per square foot of the property. Calculation:Purchase Price / Square Feet Cost per square foot:
| $553 |
Monthly Rent Per Square FootMonthly rent divided by the number of square feet. This ratio helps investors compare rental income efficiency across properties, markets, and unit sizes Calculation:Monthly Rent / Square Feet Monthly rent per square foot:
| $2.69 |
Financing Details
Loan AmountThe total sum of money borrowed from a lender to finance a property purchase. Calculation:Purchase Price - Down Payment
Loan amount:
| $1,199,200 |
|---|---|
Loan to Value Ratio (LTV)Loan amount divided by the market value of the property. Calculation:Loan Amount / Market Value
Loan to value ratio:
| 80.0% |
Loan TypeThe type of loan (e.g., fixed, adjustable).
Loan type:
| Amortizing |
TermThe loan repayment period in years.
Term:
| 30 years |
Interest RateThe percentage a lender charges on the borrowed amount of a loan, determining the cost of borrowing money.
Interest rate:
| 6.840% |
Principal & Interest (PI)The principal is the portion of the loan payment that reduces the loan balance. The interest is the lender's charge for borrowing money. Calculation:(P * r * (1 + r) ** n) / ((1 + r) ** n - 1) Where:
P = Loan amount (principal)
Principal & interest:
| $7,850 |
Property TaxesAnnual taxes levied by local governments on real estate properties. These taxes fund public services like schools, roads, and emergency services.
Property tax:
| $84 |
InsuranceThe costs for insurance coverage to protect against financial losses due to risks like fire, natural disasters, theft, liability, or tenant-related damages. Calculation:Assumes 7% of gross rental income, unless insurance rates are specified.
Insurance:
| $511 |
Private Mortgage Insurance (PMI)A fee that borrowers pay when they take out a conventional loan with a loan-to-value (LTV) ratio above 80%.
Private mortgage insurance (PMI):
| $0 |
Monthly PaymentThe fixed amount a borrower pays each month to repay a loan. It typically includes principal and interest (P&I) and may also cover property taxes, insurance, HOA fees, and PMI if escrowed. Monthly payment:
| $8,445 |
Operating Income
| % Rent | Monthly | Yearly | |
|---|---|---|---|
Gross RentThe total rental income received from tenants before deducting any expenses. Includes base rent, late fees, pet fees, parking fees, and other recurring charges.
Gross rent:
| $7,300 | $87,600 | |
Vacancy LossExpected loss of rent due to vacancies.
Vacancy loss:
(6%)
| 6% | -$438 | -$5,256 |
Operating IncomeGross rental income minus vacancy loss. Calculation:Gross rent - Vacancy loss
Operating income:
| $6,862 | $82,344 |
Operating Expenses
| % Rent | Monthly | Yearly | |
|---|---|---|---|
Property TaxesAnnual taxes levied by local governments on real estate properties. These taxes fund public services like schools, roads, and emergency services. | 1% | -$84 | -$1,010 |
InsuranceThe costs for insurance coverage to protect against financial losses due to risks like fire, natural disasters, theft, liability, or tenant-related damages. Calculation:Assumes 7% of gross rental income, unless insurance rates are specified. | 7% | -$511 | -$6,132 |
Property ManagementThe costs associated with hiring a property manager to handle the day-to-day operations of a rental property. Includes management fees, leasing fes, eviction fees, etc. Calculation:Assumes 8% of gross rental income. | 8% | -$584 | -$7,008 |
Repairs & MaintenanceOngoing costs for routine upkeep and minor fixes needed to keep a property in good working condition. Calculation:Assumes 5% of gross rental income. Varies by property age and condition. | 5% | -$365 | -$4,380 |
Capital ExpensesLarge, infrequent costs for major improvements or replacements, like a new roof, HVAC system, or appliances. Calculation:Assumes 5% of gross rental income. Varies by property age. | 5% | -$365 | -$4,380 |
HOA FeesRegular dues paid to a Homeowners Association for community maintenance, amenities, and management. Similar fees include: Condo Association Fees, Co-op Maintenance Fees, etc. | n/a | n/a | n/a |
Operating ExpensesRecurring costs required to maintain and manage a rental property, including property taxes, insurance, maintenance, repairs, utilities (if paid by the owner), property management fees, and other day-to-day expenses. Calculation:Insurance + Property Taxes + Property Management + Repairs & Maintenance + Capital Expenditures + HOA Fees | 26% | -$1,909 | -$22,910 |
Cash Flow
| Monthly | Yearly | |
|---|---|---|
Net Operating Income (NOI)The income generated from a property after deducting all operating expenses but before deducting mortgage payments, taxes, and capital expenditures. Calculation:Gross Operating Income - Operating Expenses
Net operating income:
| $4,953 | $59,436 |
Mortgage PaymentThe fixed amount a borrower pays each month to repay a loan. It typically includes principal and interest (P&I) and may also cover property taxes, insurance, HOA fees, and PMI if escrowed. | -$7,850 | -$94,200 |
Cash FlowNet Operating Income (NOI) minus mortgage payments. Calculation:NOI - Mortgage Payments | $2,897 | $34,764 |