
$1,475,000
Investment Summary
- Monthly Cash Flow
- -$6,120
- Cap Rate
- 1.2%
- Cash-on-Cash Return
- -21.6%
- Debt Coverage Ratio
- 0.19
- Internal Rate of Return (5 years)
- -16.9%
Cash Flow
Net Operating Income (NOI) minus mortgage payments.
Calculation:
NOI - Mortgage Payments
Cap Rate (Market Value)
Capitalization Rate is a rate of return that compares the yearly Net Operating Income (NOI) to the market value.
Calculation:
NOI / Market Value
Cash-on-Cash Return (CoC)
Annual Cash Flow / Cash Invested
Calculation:
Annual cash flow divided by initial cash invested.
Debt Coverage Ratio (DCR)
Net Operating Income (NOI) divided by total debt payments.
Calculation:
NOI / Total Debt Payments
Internal Rate of Return (IRR)
A metric for assessing profitability over time. IRR is the discount rate at which the net present value (NPV) of all future cash flows (positive and negative) from an investment equals zero — including both periodic cash flow (such as rent) and a projected sale at the end of the holding period. It represents the expected annualized return, accounting for income, expenses, and the recovery of capital through a future sale.
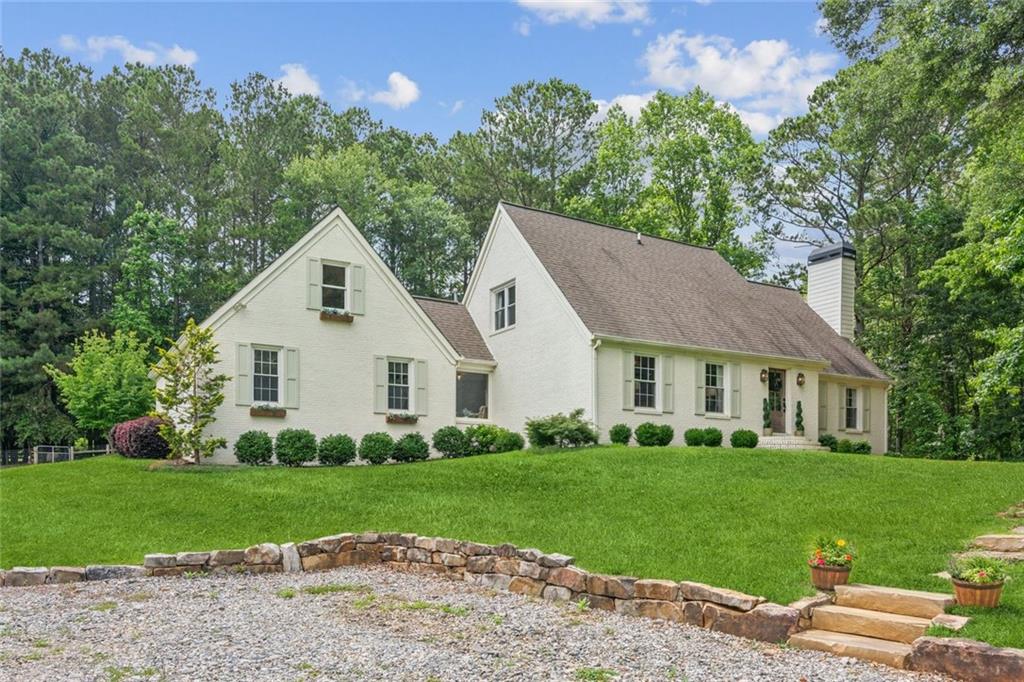
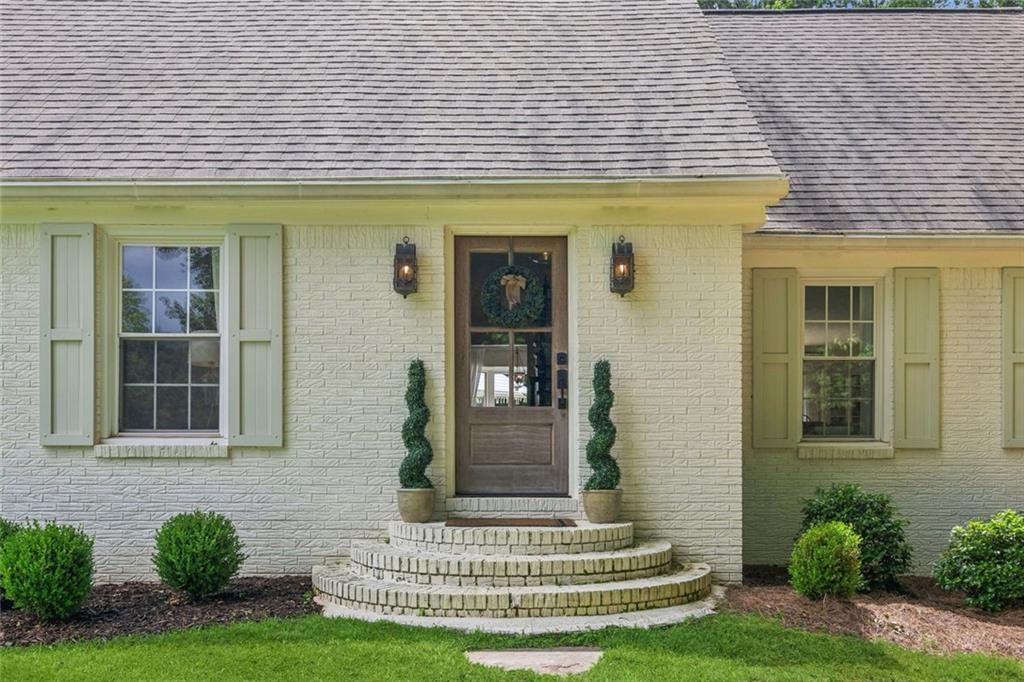
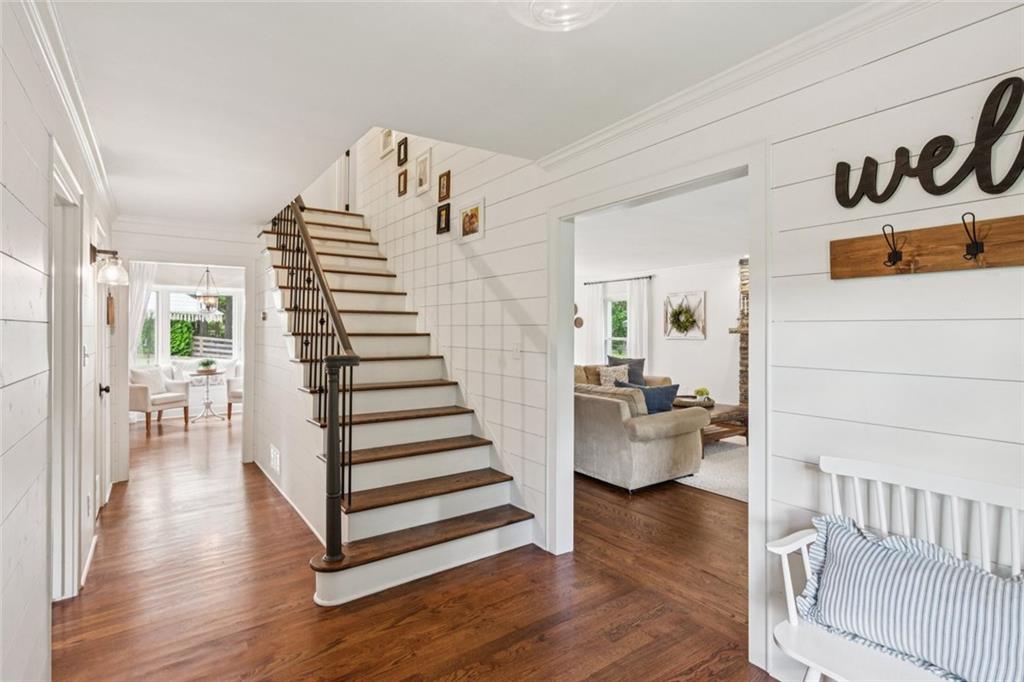
Property Description
Experience timeless design and modern luxury in this beautifully renovated 4-bedroom, 2.5-bath Cape Cod home set on 5.45 acres of open pastures, mature landscaping, and resort-style outdoor living. This custom home boasts hardwood floors throughout and elegant touches such as board and batten, shiplap, and detailed molding. The gourmet kitchen is outfitted with high-end Bertazzoni appliances, quartz countertops, a Kohler farm sink, pot filler, and custom cabinetry. Enjoy stunning views of the backyard and pool from the kitchen, which flows into a fully custom butler’s pantry and laundry room featuring another farm sink and a unique craft pullout table. A charming Dutch door connects the pantry to a spacious screened porch, creating seamless indoor-outdoor living. The mudroom features herringbone brick flooring and ample storage. Above the garage, a private staircase leads to a flexible loft space with its own bedroom or office—perfect for remote work or guests. The main-level primary suite offers tranquil views of the property and a luxurious en-suite bath with a spacious walk-in shower and rain shower head. Secondary bedrooms are bright and generously sized, both are enhanced with skylights. A large unfinished basement offers endless potential and includes a garage door for boat or equipment storage. Smart home upgrades include Nest thermostats and smoke detectors. The 2-car garage is equipped with a 220V EV charging outlet. The backyard is a true retreat, featuring a 2-year-old, 40-foot freeform Gunite pool with: 8-person chip-face stone spa and waterfall, 8’ deep end with jumping rock, Tanning ledge with bubblers, LED lighting and Hayward pool equipment and heater with OmniLogic phone-controlled operating system. Relax or entertain on the 1,500 sq. ft. Belgard paver patio with a chip-face stone propane fire pit. The entire backyard is professionally landscaped, fully fenced, and irrigated by a Rain Bird 7-zone system, also with phone controls. A 500-gallon buried propane tank supports outdoor amenities. This property is ideal for animal lovers, hobby farmers, or anyone seeking space and serenity. Property features include: flat, open pastures perfect for horses and a fenced pasture near the home with a chicken coop, There is even a meandering creek along the edge of the property, along with peaceful views of neighboring farmland, This one-of-a-kind estate blends refined living with the beauty of the outdoors—offering luxury, space, and flexibility in every detail. Schedule your private showing today!
Build Your Team
Quickly find investor-friendly professionals who can help you succeed in real estate investing at any stage of the investing journey.


Agents
Match with investor-friendly agents who can help you find, analyze, and close your next deal


Lenders
Get the best funding…find investor-friendly lenders who specialize in your deal strategy


Property Managers
Transition to passive investing. Find a trusted property management partnership that lasts.


Tax Pros & Accountants
Taxes and financial reporting made easy—find experts to create tax savings strategies, file taxes, and more
Location
Property Details
Parking
- Description: Attached, Garage, Garage Door Opener, Garage Faces Side, Level Driveway
- Details: Garage, Attached, Garage Door Opener, Kitchen Level, Driveway
- Garage Spaces: 3
- Spaces Total: 9
Bedroom Information
- # of Bedrooms: 4
Bathroom Information
- # of Baths (Full): 2
- # of Baths (Total): 3.0
Interior Features
- # of Stories: 2
- Basement: Yes
- Basement Description: Exterior Entry, Unfinished, Walk-Out Access
- Fireplace: Yes
Exterior Features
- Exterior Walls Materials: Brick
- Foundation: None
- Roof Material: Composition
- Pool: Yes
Land Information
- Land Use: Residential
- Land Use Subtype: Single Family Residential
Lot Information
- Parcel ID: 122017
- Lot Size: 0 sqft
Property Information
- Property Type: Single Family Residence
- Style: Cottage, Farmhouse, Cape Cod
- Year Built: 1978
Tax Information
- Annual Tax: $8,439
Utilities
- Water & Sewer: Private, Well
- Heating: Central
- Cooling: Ceiling Fan(s), Central Air
Location
- County: Forsyth
Listing Details
Investment Summary
- Monthly Cash Flow
- -$6,120
- Cap Rate
- 1.2%
- Cash-on-Cash Return
- -21.6%
- Debt Coverage Ratio
- 0.19
- Internal Rate of Return (5 years)
- -16.9%
Cash Flow
Net Operating Income (NOI) minus mortgage payments.
Calculation:
NOI - Mortgage Payments
Cap Rate (Market Value)
Capitalization Rate is a rate of return that compares the yearly Net Operating Income (NOI) to the market value.
Calculation:
NOI / Market Value
Cash-on-Cash Return (CoC)
Annual Cash Flow / Cash Invested
Calculation:
Annual cash flow divided by initial cash invested.
Debt Coverage Ratio (DCR)
Net Operating Income (NOI) divided by total debt payments.
Calculation:
NOI / Total Debt Payments
Internal Rate of Return (IRR)
A metric for assessing profitability over time. IRR is the discount rate at which the net present value (NPV) of all future cash flows (positive and negative) from an investment equals zero — including both periodic cash flow (such as rent) and a projected sale at the end of the holding period. It represents the expected annualized return, accounting for income, expenses, and the recovery of capital through a future sale.
Purchase Details
Purchase PriceThe price paid for the property. Purchase price:
| $1,475,000 |
|---|---|
Amount FinancedThe amount of the purchase financed through a loan. Amount financed:
| -$1,180,000 |
Down paymentThe initial payment made towards the purchase. Down payment:
| $295,000 |
Closing CostsFees and expenses associated with purchasing a property, typically ranging from 2% to 5% of the home’s purchase price, paid at the end of a home purchase to cover services like lending, title transfer, and taxes. Closing costs:
| $44,250 |
Rehab CostsCosts incurred to repair or improve the property, including: roof, flooring, exterior siding, kitchen, exterior paint, bathrooms, etc. Rehab costs:
| $0 |
Initial Cash InvestedThe total initial cash invested in the property. Calculation:Down payment + Buying costs + Rehab costs Initial cash invested:
| $339,250 |
Square Feet (SQFT)The total square footage of the property. Square feet:
| 3,181 |
Cost Per Square FootCost per square foot of the property. Calculation:Purchase Price / Square Feet Cost per square foot:
| $464 |
Monthly Rent Per Square FootMonthly rent divided by the number of square feet. This ratio helps investors compare rental income efficiency across properties, markets, and unit sizes Calculation:Monthly Rent / Square Feet Monthly rent per square foot:
| $0.97 |
Financing Details
Loan AmountThe total sum of money borrowed from a lender to finance a property purchase. Calculation:Purchase Price - Down Payment
Loan amount:
| $1,180,000 |
|---|---|
Loan to Value Ratio (LTV)Loan amount divided by the market value of the property. Calculation:Loan Amount / Market Value
Loan to value ratio:
| 80.0% |
Loan TypeThe type of loan (e.g., fixed, adjustable).
Loan type:
| Amortizing |
TermThe loan repayment period in years.
Term:
| 30 years |
Interest RateThe percentage a lender charges on the borrowed amount of a loan, determining the cost of borrowing money.
Interest rate:
| 6.625% |
Principal & Interest (PI)The principal is the portion of the loan payment that reduces the loan balance. The interest is the lender's charge for borrowing money. Calculation:(P * r * (1 + r) ** n) / ((1 + r) ** n - 1) Where:
P = Loan amount (principal)
Principal & interest:
| $7,556 |
Property TaxesAnnual taxes levied by local governments on real estate properties. These taxes fund public services like schools, roads, and emergency services.
Property tax:
| $703 |
InsuranceThe costs for insurance coverage to protect against financial losses due to risks like fire, natural disasters, theft, liability, or tenant-related damages. Calculation:Assumes 7% of gross rental income, unless insurance rates are specified.
Insurance:
| $217 |
Private Mortgage Insurance (PMI)A fee that borrowers pay when they take out a conventional loan with a loan-to-value (LTV) ratio above 80%.
Private mortgage insurance (PMI):
| $0 |
Monthly PaymentThe fixed amount a borrower pays each month to repay a loan. It typically includes principal and interest (P&I) and may also cover property taxes, insurance, HOA fees, and PMI if escrowed. Monthly payment:
| $8,476 |
Operating Income
| % Rent | Monthly | Yearly | |
|---|---|---|---|
Gross RentThe total rental income received from tenants before deducting any expenses. Includes base rent, late fees, pet fees, parking fees, and other recurring charges.
Gross rent:
| $3,100 | $37,200 | |
Vacancy LossExpected loss of rent due to vacancies.
Vacancy loss:
(6%)
| 6% | -$186 | -$2,232 |
Operating IncomeGross rental income minus vacancy loss. Calculation:Gross rent - Vacancy loss
Operating income:
| $2,914 | $34,968 |
Operating Expenses
| % Rent | Monthly | Yearly | |
|---|---|---|---|
Property TaxesAnnual taxes levied by local governments on real estate properties. These taxes fund public services like schools, roads, and emergency services. | 23% | -$703 | -$8,439 |
InsuranceThe costs for insurance coverage to protect against financial losses due to risks like fire, natural disasters, theft, liability, or tenant-related damages. Calculation:Assumes 7% of gross rental income, unless insurance rates are specified. | 7% | -$217 | -$2,604 |
Property ManagementThe costs associated with hiring a property manager to handle the day-to-day operations of a rental property. Includes management fees, leasing fes, eviction fees, etc. Calculation:Assumes 8% of gross rental income. | 8% | -$248 | -$2,976 |
Repairs & MaintenanceOngoing costs for routine upkeep and minor fixes needed to keep a property in good working condition. Calculation:Assumes 5% of gross rental income. Varies by property age and condition. | 5% | -$155 | -$1,860 |
Capital ExpensesLarge, infrequent costs for major improvements or replacements, like a new roof, HVAC system, or appliances. Calculation:Assumes 5% of gross rental income. Varies by property age. | 5% | -$155 | -$1,860 |
HOA FeesRegular dues paid to a Homeowners Association for community maintenance, amenities, and management. Similar fees include: Condo Association Fees, Co-op Maintenance Fees, etc. | n/a | n/a | n/a |
Operating ExpensesRecurring costs required to maintain and manage a rental property, including property taxes, insurance, maintenance, repairs, utilities (if paid by the owner), property management fees, and other day-to-day expenses. Calculation:Insurance + Property Taxes + Property Management + Repairs & Maintenance + Capital Expenditures + HOA Fees | 48% | -$1,478 | -$17,739 |
Cash Flow
| Monthly | Yearly | |
|---|---|---|
Net Operating Income (NOI)The income generated from a property after deducting all operating expenses but before deducting mortgage payments, taxes, and capital expenditures. Calculation:Gross Operating Income - Operating Expenses
Net operating income:
| $1,436 | $17,232 |
Mortgage PaymentThe fixed amount a borrower pays each month to repay a loan. It typically includes principal and interest (P&I) and may also cover property taxes, insurance, HOA fees, and PMI if escrowed. | -$7,556 | -$90,672 |
Cash FlowNet Operating Income (NOI) minus mortgage payments. Calculation:NOI - Mortgage Payments | $6,120 | $73,440 |