
$975,000
Investment Summary
- Monthly Cash Flow
- -$3,006
- Cap Rate
- 2.0%
- Cash-on-Cash Return
- -16.1%
- Debt Coverage Ratio
- 0.35
- Internal Rate of Return (5 years)
- -11.6%
Cash Flow
Net Operating Income (NOI) minus mortgage payments.
Calculation:
NOI - Mortgage Payments
Cap Rate (Market Value)
Capitalization Rate is a rate of return that compares the yearly Net Operating Income (NOI) to the market value.
Calculation:
NOI / Market Value
Cash-on-Cash Return (CoC)
Annual Cash Flow / Cash Invested
Calculation:
Annual cash flow divided by initial cash invested.
Debt Coverage Ratio (DCR)
Net Operating Income (NOI) divided by total debt payments.
Calculation:
NOI / Total Debt Payments
Internal Rate of Return (IRR)
A metric for assessing profitability over time. IRR is the discount rate at which the net present value (NPV) of all future cash flows (positive and negative) from an investment equals zero — including both periodic cash flow (such as rent) and a projected sale at the end of the holding period. It represents the expected annualized return, accounting for income, expenses, and the recovery of capital through a future sale.
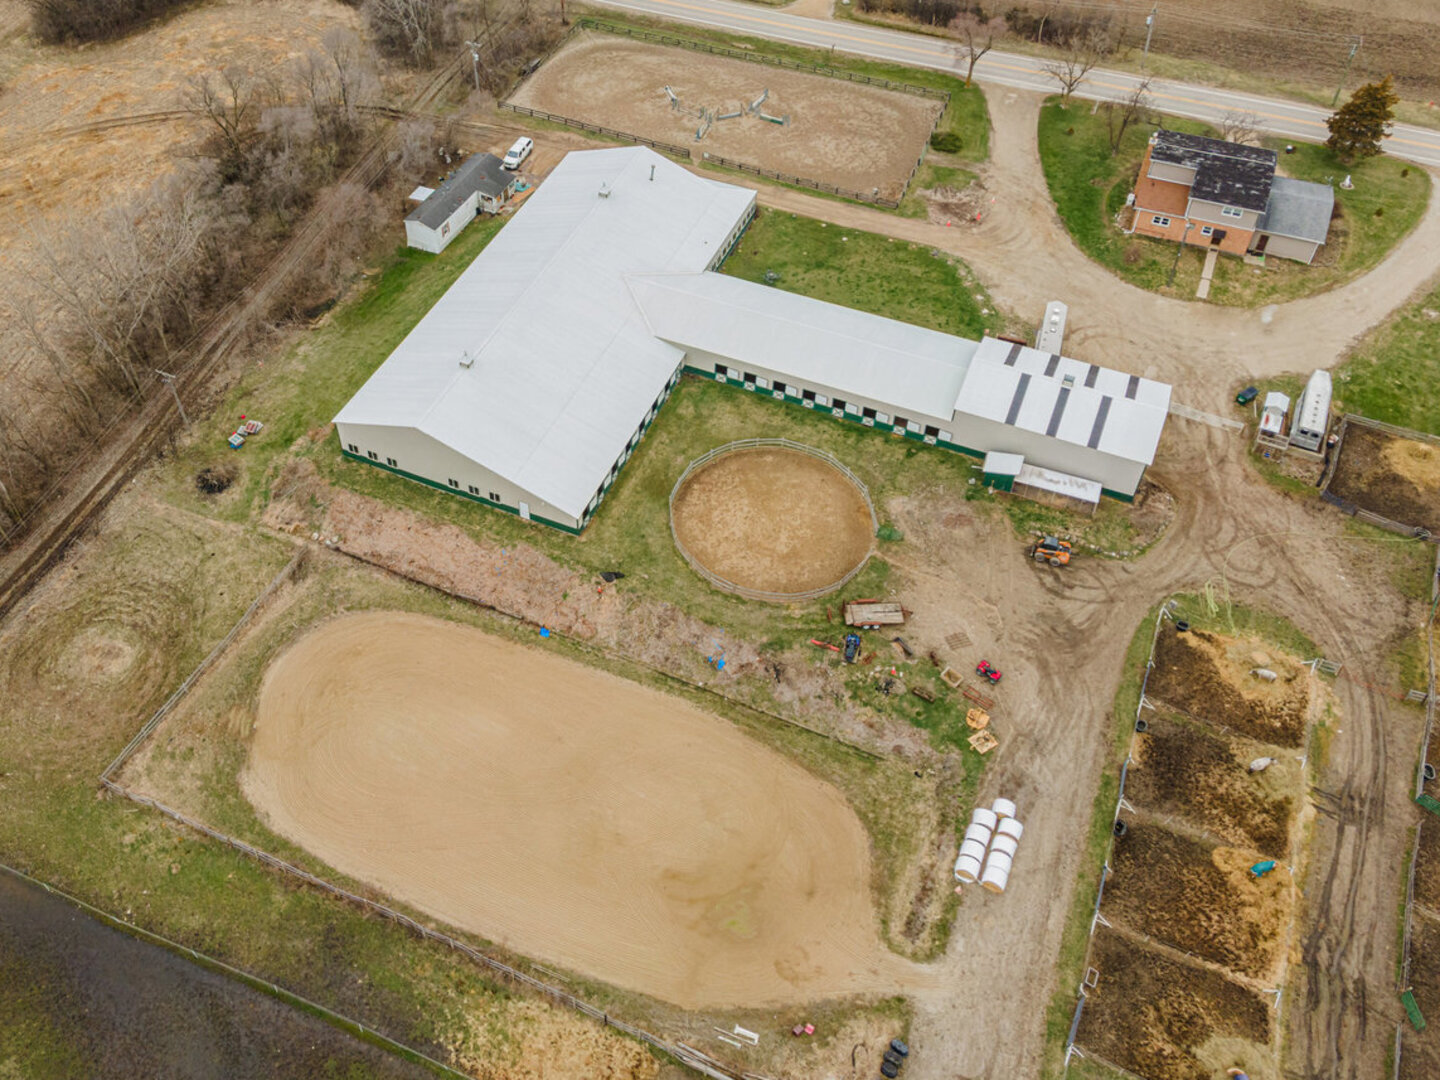
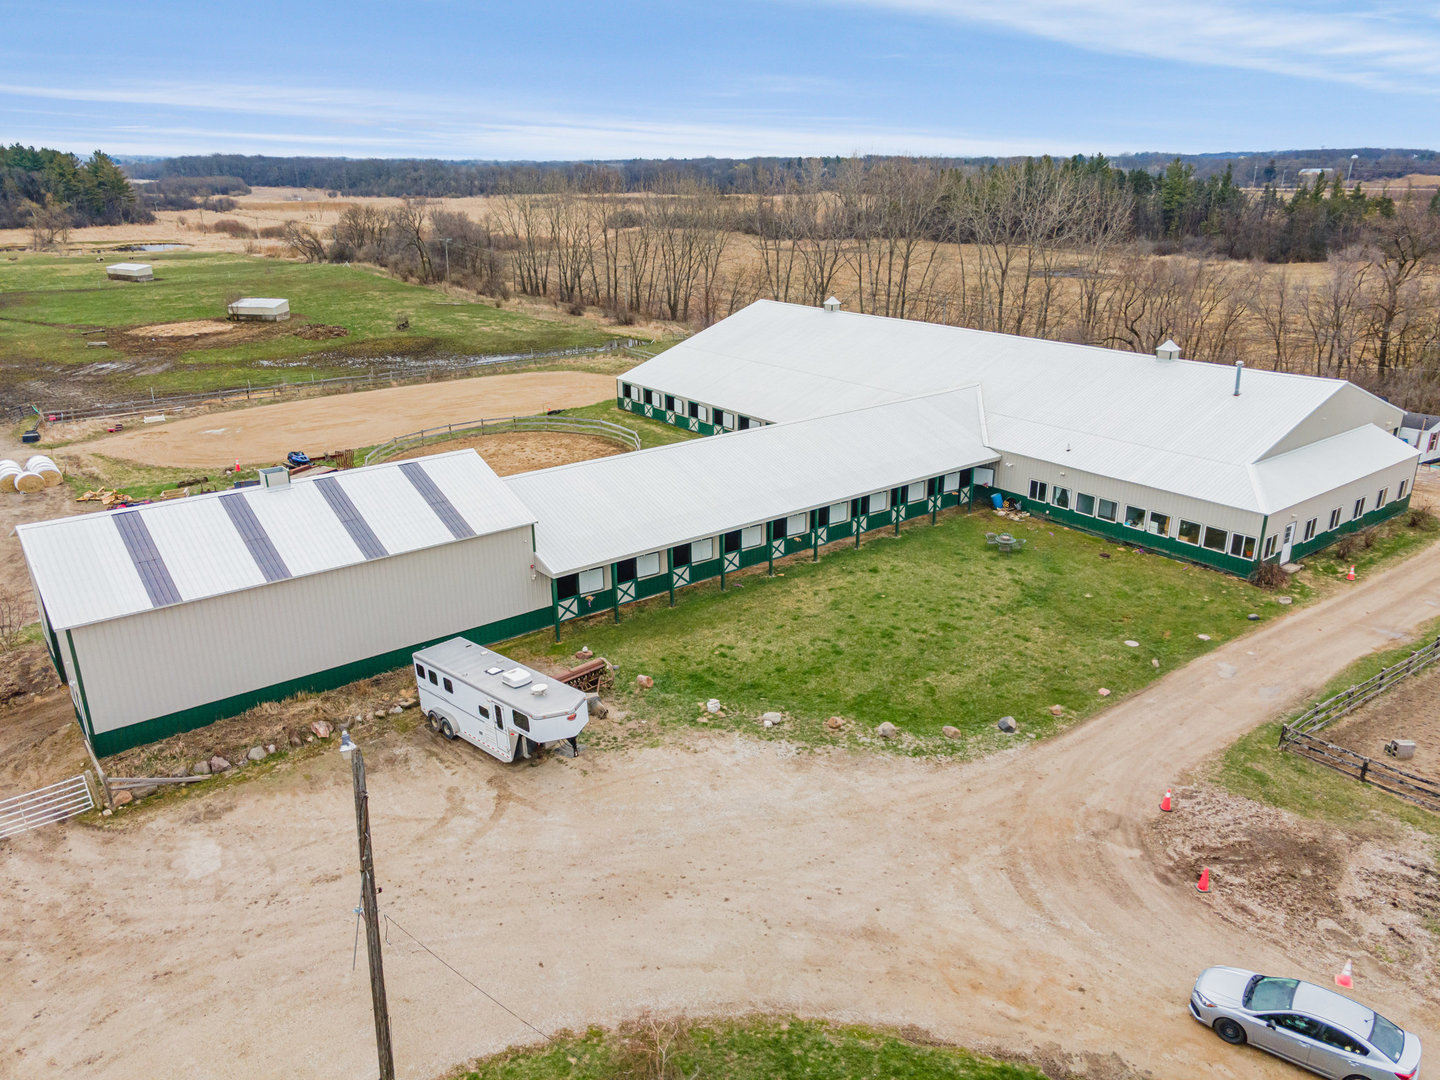
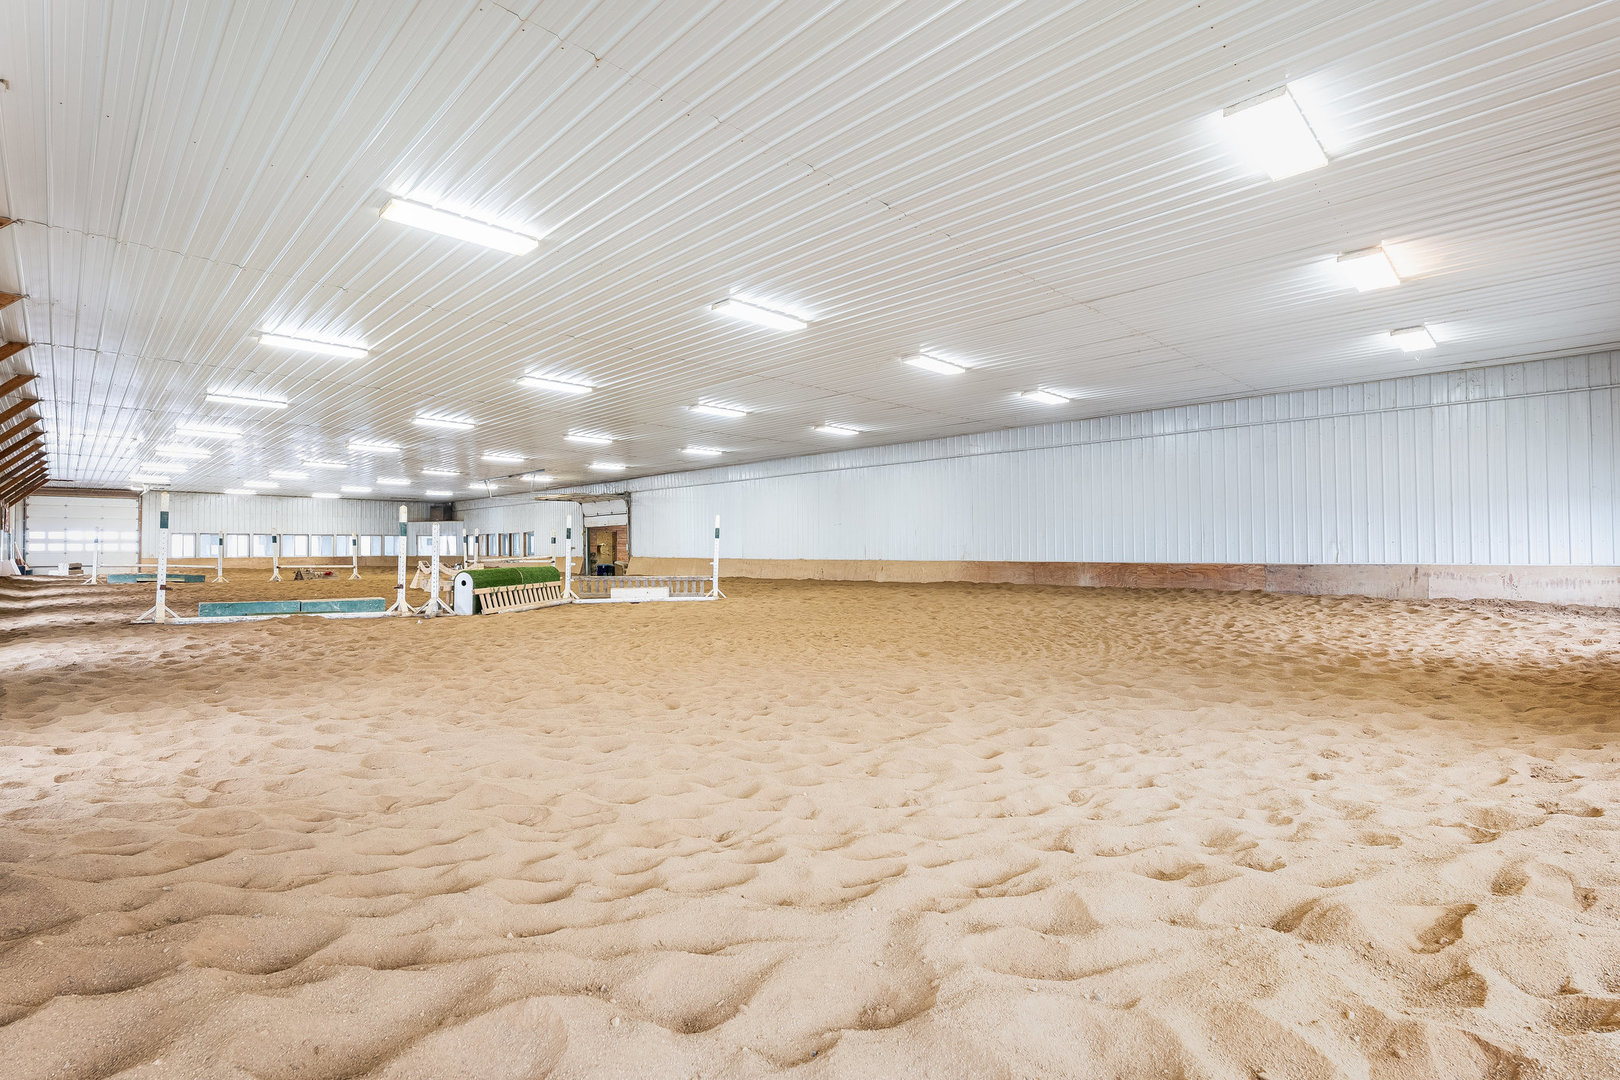
Property Description
BEST VALUE ON THE MARKET - 10 ACRE HORSE PROPERTY with HOUSE, 25 STALLS, INDOOR and OUTDOOR ARENAS plus ROUND PEN on NATURAL GAS and ZONED A-1; AGRICULTURE. Whether you're a professional equestrian or simply looking for a private horse property that can help pay for itself, this one checks all the boxes! This QUALITY SHOW BARN was built in 2015 and was designed with the serious horseperson in mind. Work year-round in this ALL-HEATED FACILITY! It features 25 tongue-and-groove wood stalls (12x10 and 10x10), each outfitted with a dutch door, mats, automatic waterers, electrical outlet and blanket rack. The barn also includes a well-organized tack room, two grooming stalls and a wash rack (hot and cold water). The INDOOR ARENA is 72x180 with fully insulated walls and ceiling, kickboards and sand footing. The Viewing Room, Offices Half Bath and Laundry have radiant floor heat. The HAY / EQUIPMENT STORAGE SHED is 36 x 60; extra tall and can be closed off when needed. TWO OUTDOOR ARENAS (80 x 180 & 75 x 165) plus a 60 Ft ROUND PEN; all with sand footing. TURNOUT OPTIONS include 4 small and 6 medium sized paddocks and 3 large grass pastures (with 2-Lean-tos) and one with cross country jumps. (NOTE: Some of the turnouts are on an additional 5 acres of leased land from Comed at less than $300/year.) Access the Bridle Path behind the mobile home...follows the fence line and is approximately 1 mile. The horseshoe shaped drive makes pulling trailers in and out, a breeze! The HOUSE is 2300 sq ft with a Kitchen that has Dining space and opens to the Living Room with a beautiful stone fireplace. There is also a formal living room and office. The 3 Bedrooms are upstairs and all are a generous size with hardwood floors. One of them boasts a private balcony with stunning western views-ideal for relaxing after a day at the barn. 2 Full baths, Extra Deep Attached 2-Car Garage, a large mudroom, 1st floor laundry and a Basement that's good for storage. WHOLE HOUSE GENERATOR - powers the well during outages. The MOBILE HOME with 2 Bedrooms for the farm help is currently rented at $900/month. Not a trainer? Use some stalls for your own horses and lease a block of stalls to a trainer to generate income and have the property help pay for itself! CONVENIENTLY LOCATED equal distance between Lamplight and Ledges show facilities as well as the towns of Woodstock and Crystal Lake offering convenient access to shopping, restaurants, transportation and other amenities. **HAVE ANOTHER VISION? Add fencing to give every horse it's own individual paddock. Add temporary stalls to the hay barn when needed. In the House...need a 1st Floor Bedroom? Convert the Front Living Room and Back Office into a Bedroom and 3rd Bathroom. ** ROLL YOUR DESIRED IMPROVEMENTS INTO YOUR LOAN! Ask us for recommendations of Agricultural lenders have a program for this! * BE SURE TO CLICK ON THE VIRTUAL TOURS OF THE BARN AND HOUSE!
Build Your Team
Quickly find investor-friendly professionals who can help you succeed in real estate investing at any stage of the investing journey.


Agents
Match with investor-friendly agents who can help you find, analyze, and close your next deal


Lenders
Get the best funding…find investor-friendly lenders who specialize in your deal strategy


Property Managers
Transition to passive investing. Find a trusted property management partnership that lasts.


Tax Pros & Accountants
Taxes and financial reporting made easy—find experts to create tax savings strategies, file taxes, and more
Location
Property Details
Parking
- Description: Garage
- Details: Gravel, On Site, Attached, Garage
- Garage Spaces: 2
- Spaces Total: 10
Bedroom Information
- # of Bedrooms: 3
Bathroom Information
- # of Baths (Full): 2
- # of Baths (Total): 2.0
Interior Features
- # of Rooms: 8
- # of Stories: 2
- Basement: Yes
- Basement Description: Unfinished, Full
- Fireplace: Yes
Exterior Features
- Exterior Walls Materials: Masonry
- Foundation: Stone
Land Information
- Land Use: Residential
- Land Use Subtype: Rural/Agricultural
Lot Information
- Parcel ID: 1334200002
- Lot Size: 0 sqft
Property Information
- Property Type: Single Family Residence
- Year Built: 1900
Tax Information
- Annual Tax: $7,200
Utilities
- Water & Sewer: Well
- Heating: Natural Gas
- Cooling: None
Location
- County: Mc Henry
Listing Details
Investment Summary
- Monthly Cash Flow
- -$3,006
- Cap Rate
- 2.0%
- Cash-on-Cash Return
- -16.1%
- Debt Coverage Ratio
- 0.35
- Internal Rate of Return (5 years)
- -11.6%
Cash Flow
Net Operating Income (NOI) minus mortgage payments.
Calculation:
NOI - Mortgage Payments
Cap Rate (Market Value)
Capitalization Rate is a rate of return that compares the yearly Net Operating Income (NOI) to the market value.
Calculation:
NOI / Market Value
Cash-on-Cash Return (CoC)
Annual Cash Flow / Cash Invested
Calculation:
Annual cash flow divided by initial cash invested.
Debt Coverage Ratio (DCR)
Net Operating Income (NOI) divided by total debt payments.
Calculation:
NOI / Total Debt Payments
Internal Rate of Return (IRR)
A metric for assessing profitability over time. IRR is the discount rate at which the net present value (NPV) of all future cash flows (positive and negative) from an investment equals zero — including both periodic cash flow (such as rent) and a projected sale at the end of the holding period. It represents the expected annualized return, accounting for income, expenses, and the recovery of capital through a future sale.
Purchase Details
Purchase PriceThe price paid for the property. Purchase price:
| $975,000 |
|---|---|
Amount FinancedThe amount of the purchase financed through a loan. Amount financed:
| -$780,000 |
Down paymentThe initial payment made towards the purchase. Down payment:
| $195,000 |
Closing CostsFees and expenses associated with purchasing a property, typically ranging from 2% to 5% of the home’s purchase price, paid at the end of a home purchase to cover services like lending, title transfer, and taxes. Closing costs:
| $29,250 |
Rehab CostsCosts incurred to repair or improve the property, including: roof, flooring, exterior siding, kitchen, exterior paint, bathrooms, etc. Rehab costs:
| $0 |
Initial Cash InvestedThe total initial cash invested in the property. Calculation:Down payment + Buying costs + Rehab costs Initial cash invested:
| $224,250 |
Square Feet (SQFT)The total square footage of the property. Square feet:
| 2,300 |
Cost Per Square FootCost per square foot of the property. Calculation:Purchase Price / Square Feet Cost per square foot:
| $424 |
Monthly Rent Per Square FootMonthly rent divided by the number of square feet. This ratio helps investors compare rental income efficiency across properties, markets, and unit sizes Calculation:Monthly Rent / Square Feet Monthly rent per square foot:
| $1.39 |
Financing Details
Loan AmountThe total sum of money borrowed from a lender to finance a property purchase. Calculation:Purchase Price - Down Payment
Loan amount:
| $780,000 |
|---|---|
Loan to Value Ratio (LTV)Loan amount divided by the market value of the property. Calculation:Loan Amount / Market Value
Loan to value ratio:
| 80.0% |
Loan TypeThe type of loan (e.g., fixed, adjustable).
Loan type:
| Amortizing |
TermThe loan repayment period in years.
Term:
| 30 years |
Interest RateThe percentage a lender charges on the borrowed amount of a loan, determining the cost of borrowing money.
Interest rate:
| 5.875% |
Principal & Interest (PI)The principal is the portion of the loan payment that reduces the loan balance. The interest is the lender's charge for borrowing money. Calculation:(P * r * (1 + r) ** n) / ((1 + r) ** n - 1) Where:
P = Loan amount (principal)
Principal & interest:
| $4,614 |
Property TaxesAnnual taxes levied by local governments on real estate properties. These taxes fund public services like schools, roads, and emergency services.
Property tax:
| $600 |
InsuranceThe costs for insurance coverage to protect against financial losses due to risks like fire, natural disasters, theft, liability, or tenant-related damages. Calculation:Assumes 7% of gross rental income, unless insurance rates are specified.
Insurance:
| $224 |
Private Mortgage Insurance (PMI)A fee that borrowers pay when they take out a conventional loan with a loan-to-value (LTV) ratio above 80%.
Private mortgage insurance (PMI):
| $0 |
Monthly PaymentThe fixed amount a borrower pays each month to repay a loan. It typically includes principal and interest (P&I) and may also cover property taxes, insurance, HOA fees, and PMI if escrowed. Monthly payment:
| $5,438 |
Operating Income
| % Rent | Monthly | Yearly | |
|---|---|---|---|
Gross RentThe total rental income received from tenants before deducting any expenses. Includes base rent, late fees, pet fees, parking fees, and other recurring charges.
Gross rent:
| $3,200 | $38,400 | |
Vacancy LossExpected loss of rent due to vacancies.
Vacancy loss:
(6%)
| 6% | -$192 | -$2,304 |
Operating IncomeGross rental income minus vacancy loss. Calculation:Gross rent - Vacancy loss
Operating income:
| $3,008 | $36,096 |
Operating Expenses
| % Rent | Monthly | Yearly | |
|---|---|---|---|
Property TaxesAnnual taxes levied by local governments on real estate properties. These taxes fund public services like schools, roads, and emergency services. | 19% | -$600 | -$7,200 |
InsuranceThe costs for insurance coverage to protect against financial losses due to risks like fire, natural disasters, theft, liability, or tenant-related damages. Calculation:Assumes 7% of gross rental income, unless insurance rates are specified. | 7% | -$224 | -$2,688 |
Property ManagementThe costs associated with hiring a property manager to handle the day-to-day operations of a rental property. Includes management fees, leasing fes, eviction fees, etc. Calculation:Assumes 8% of gross rental income. | 8% | -$256 | -$3,072 |
Repairs & MaintenanceOngoing costs for routine upkeep and minor fixes needed to keep a property in good working condition. Calculation:Assumes 5% of gross rental income. Varies by property age and condition. | 5% | -$160 | -$1,920 |
Capital ExpensesLarge, infrequent costs for major improvements or replacements, like a new roof, HVAC system, or appliances. Calculation:Assumes 5% of gross rental income. Varies by property age. | 5% | -$160 | -$1,920 |
HOA FeesRegular dues paid to a Homeowners Association for community maintenance, amenities, and management. Similar fees include: Condo Association Fees, Co-op Maintenance Fees, etc. | n/a | n/a | n/a |
Operating ExpensesRecurring costs required to maintain and manage a rental property, including property taxes, insurance, maintenance, repairs, utilities (if paid by the owner), property management fees, and other day-to-day expenses. Calculation:Insurance + Property Taxes + Property Management + Repairs & Maintenance + Capital Expenditures + HOA Fees | 44% | -$1,400 | -$16,800 |
Cash Flow
| Monthly | Yearly | |
|---|---|---|
Net Operating Income (NOI)The income generated from a property after deducting all operating expenses but before deducting mortgage payments, taxes, and capital expenditures. Calculation:Gross Operating Income - Operating Expenses
Net operating income:
| $1,608 | $19,296 |
Mortgage PaymentThe fixed amount a borrower pays each month to repay a loan. It typically includes principal and interest (P&I) and may also cover property taxes, insurance, HOA fees, and PMI if escrowed. | -$4,614 | -$55,368 |
Cash FlowNet Operating Income (NOI) minus mortgage payments. Calculation:NOI - Mortgage Payments | $3,006 | $36,072 |