
$1,425,000
Investment Summary
- Monthly Cash Flow
- -$3,598
- Cap Rate
- 3.2%
- Cash-on-Cash Return
- -13.2%
- Debt Coverage Ratio
- 0.52
- Internal Rate of Return (5 years)
- -8.8%
Cash Flow
Net Operating Income (NOI) minus mortgage payments.
Calculation:
NOI - Mortgage Payments
Cap Rate (Market Value)
Capitalization Rate is a rate of return that compares the yearly Net Operating Income (NOI) to the market value.
Calculation:
NOI / Market Value
Cash-on-Cash Return (CoC)
Annual Cash Flow / Cash Invested
Calculation:
Annual cash flow divided by initial cash invested.
Debt Coverage Ratio (DCR)
Net Operating Income (NOI) divided by total debt payments.
Calculation:
NOI / Total Debt Payments
Internal Rate of Return (IRR)
A metric for assessing profitability over time. IRR is the discount rate at which the net present value (NPV) of all future cash flows (positive and negative) from an investment equals zero — including both periodic cash flow (such as rent) and a projected sale at the end of the holding period. It represents the expected annualized return, accounting for income, expenses, and the recovery of capital through a future sale.
Property Description
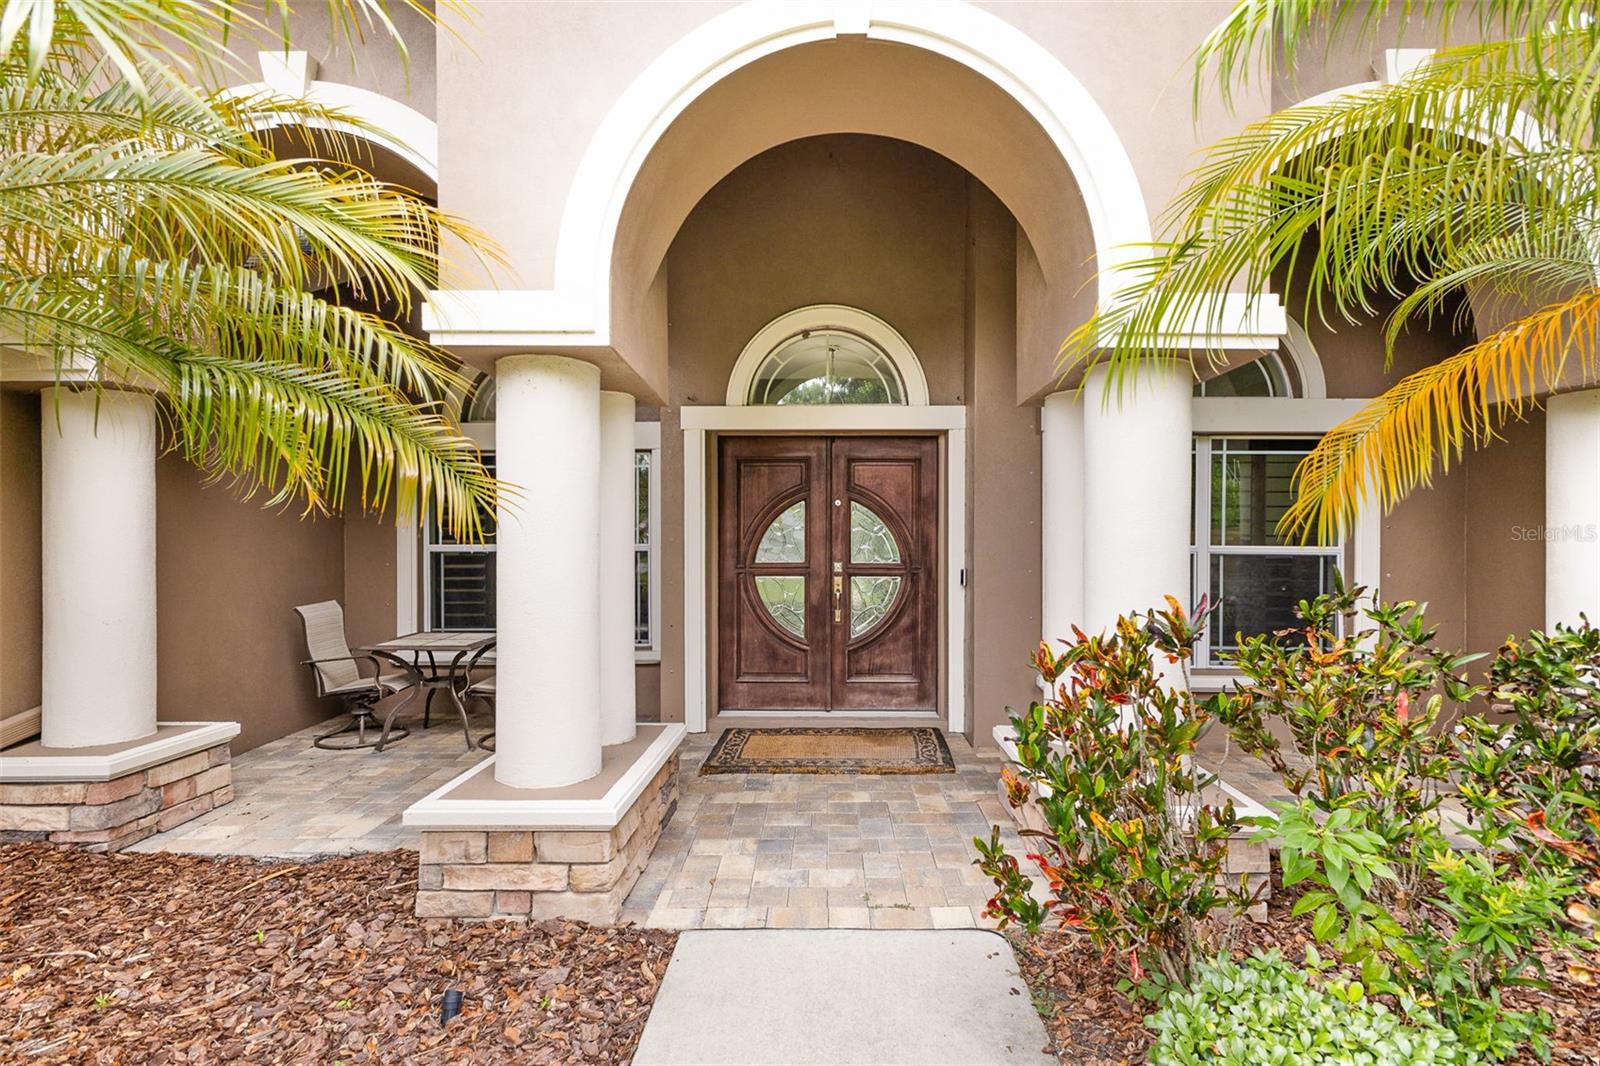
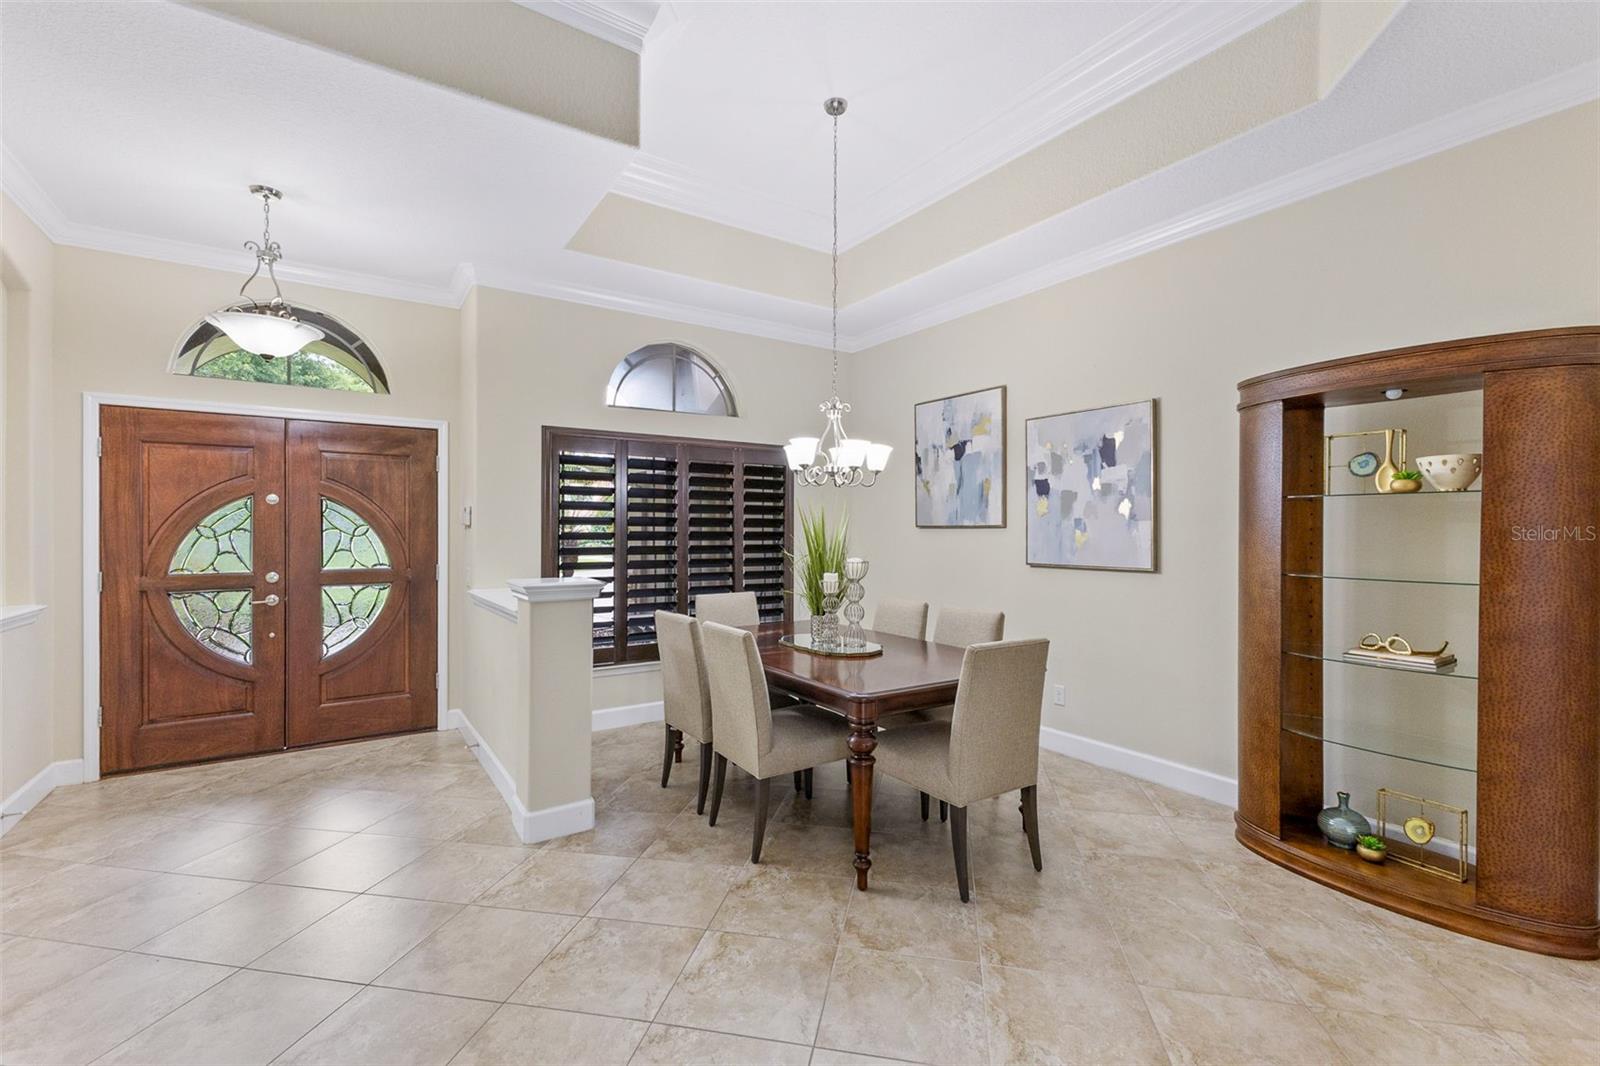
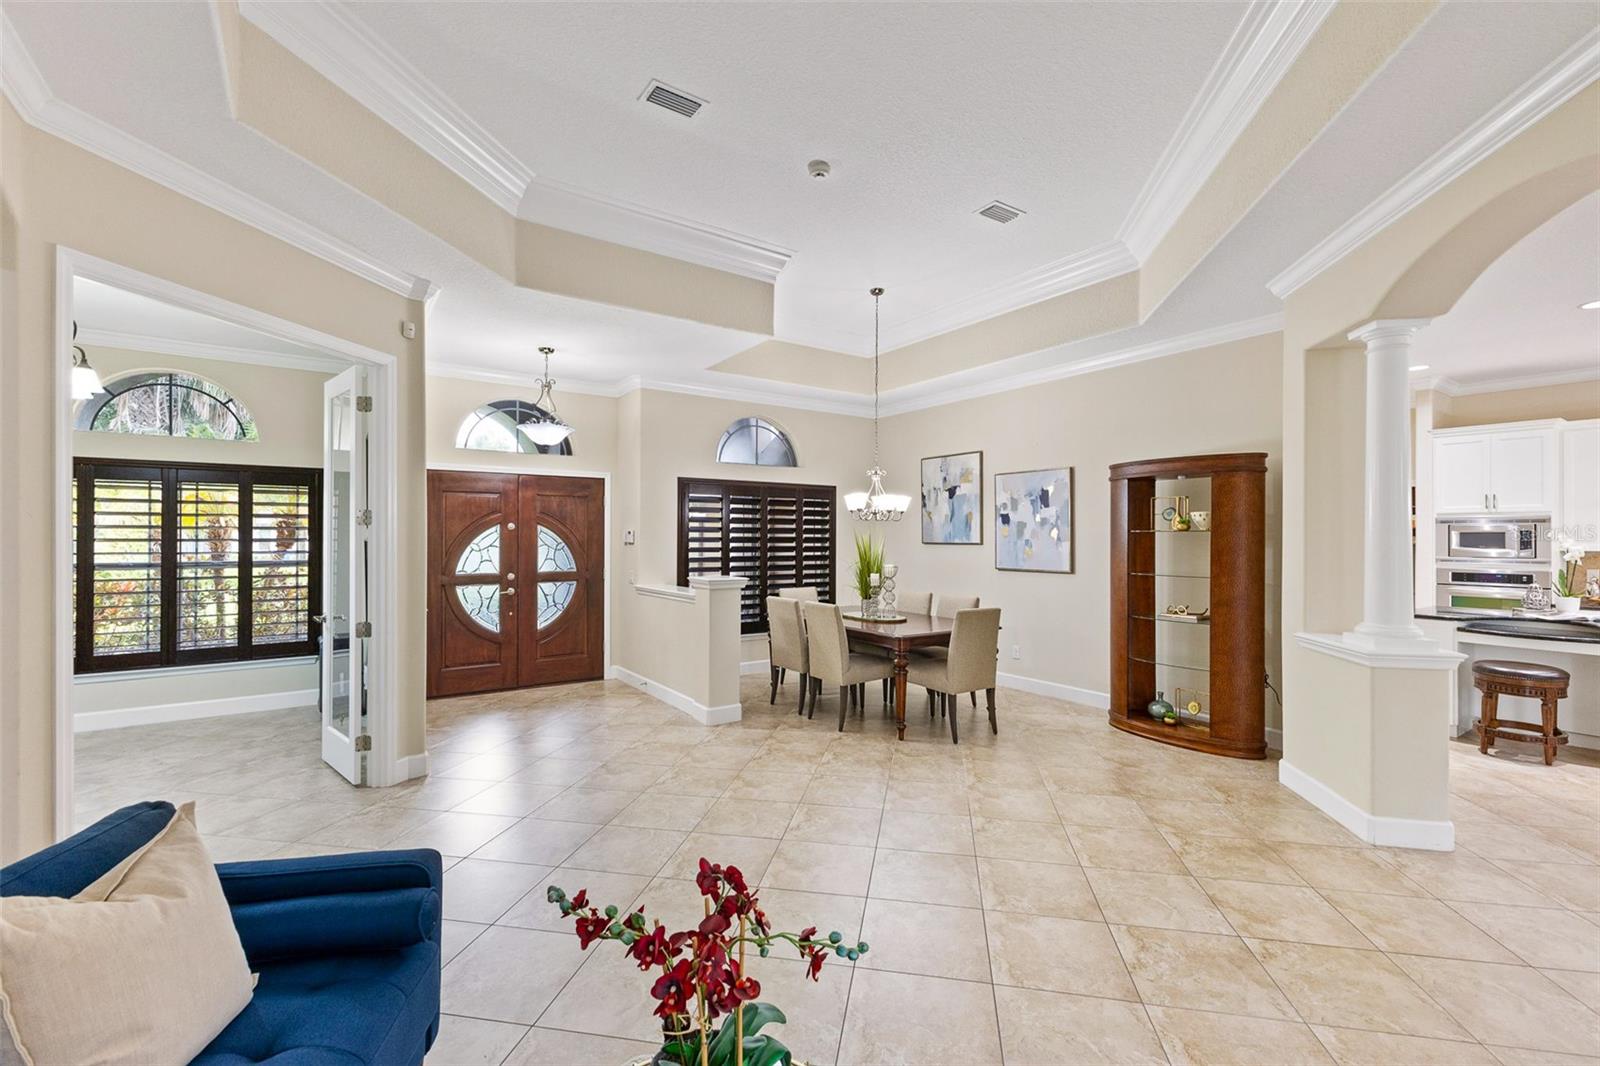
Price Reposition! A Masterpiece of Custom Design in the Heart of Safety Harbor! Welcome to the pinnacle of custom architecture and refined living. Nestled within the prestigious gated enclave of Creekside, this exclusive community is home to just 10 residences, offering unparalleled privacy and tranquility. Ideally situated at the end of a quiet cul-de-sac, this remarkable estate commands the most coveted lot in the neighborhood, an expansive, beautifully landscaped 0.66-acre property that exudes elegance and character from the moment you arrive. Step through the grand custom mahogany double doors and into a light filled interior defined by sophistication and thoughtful design. The expansive Aspen floorplan has been meticulously upgraded to reflect both style and functionality, creating a perfect harmony of luxury and livability. This 4 bedroom, 3 bathroom home plus a spacious den offers an open and split floor plan ideal for today’s lifestyle. Elegant 10 foot tray ceilings, rich crown molding, arched entryways, and custom plantation shutters elevate every living space, while triple sliding glass doors and French doors seamlessly blend indoor and outdoor living, framing stunning views of the pool and lush surroundings. The formal dining and living rooms set the tone for entertaining, but the real showstopper is the oversized bonus/game room, thoughtfully expanded during construction. This impressive flex space offers limitless potential for recreation, media, or multi-purpose use. At the heart of the home lies a chef’s dream kitchen featuring 42-inch custom cabinetry, granite countertops, a large center island, built-in ovens, upgraded stainless steel appliances, a walk-in pantry, and both a breakfast bar and nook for casual dining. Retreat to the serene primary suite, where a private sitting area overlooks the pool, an exquisite touch added during the build. The spa-inspired ensuite bath includes dual vanities, a soaking tub, a walk-in shower, a private water closet, and two custom walk-in closets. The secondary bedrooms are generously sized and offer ample storage, while the additional bathrooms are adorned with high-end cabinetry and finishes, continuing the home’s cohesive design. Outdoors, your private oasis awaits. The resort-style heated pool features a PebbleTec finish, sun shelf, deck jets, and custom LED lighting with Bluetooth controls. The extended lanai, complete with mansard-screened enclosure, provides two expansive covered areas perfect for alfresco dining or lounging in luxury. The fully fenced backyard is a true sanctuary, surrounded by majestic oak trees, Areca palms, and lush St. Augustine grass, offering plenty of space for outdoor recreation and relaxation. Additional upgrades include integrated smart home Alexa features with voice-activated lighting and outlets throughout. Creekside offers an unmatched location just 5 minutes from charming downtown Safety Harbor, renowned for its shops, restaurants, street festivals, and small town charm. Also nearby are Philippe Park, local beaches, and both Tampa International and St. Pete-Clearwater airports, just a short 20-minute drive away. Homes of this caliber are a rare find. Don’t miss your chance to own a piece of architectural excellence in one of Safety Harbor’s most coveted communities.
Build Your Team
Quickly find investor-friendly professionals who can help you succeed in real estate investing at any stage of the investing journey.


Agents
Match with investor-friendly agents who can help you find, analyze, and close your next deal


Lenders
Get the best funding…find investor-friendly lenders who specialize in your deal strategy


Property Managers
Transition to passive investing. Find a trusted property management partnership that lasts.


Tax Pros & Accountants
Taxes and financial reporting made easy—find experts to create tax savings strategies, file taxes, and more
Location
Property Details
Parking
- Description: Garage
- Details: Attached
- Garage Spaces: 3
- Spaces Total: 0
Bedroom Information
- # of Bedrooms: 4
Bathroom Information
- # of Baths (Full): 3
- # of Baths (Total): 3.0
Interior Features
- # of Rooms: 6
- # of Stories: 1
Exterior Features
- Exterior Walls Materials: Stucco
- Foundation: Slab
- Roof Type: Gable
- Roof Material: Shingle
- Pool: Yes
HOA
- Has HOA: Yes
- Association: Brian Sack, President
- HOA Fee: $180/monthly
Land Information
- Land Use: Residential
- Land Use Subtype: Single Family Residential
Lot Information
- Parcel ID: 342816187880000050
- Lot Size: 28889 sqft
Property Information
- Property Type: Single Family Residence
- Style: Contemporary, Custom
- Year Built: 2012
Tax Information
- Annual Tax: $10,520
Utilities
- Water & Sewer: Public
- Heating: Central
- Cooling: Central Air
Location
- County: Pinellas
Listing Details
Investment Summary
- Monthly Cash Flow
- -$3,598
- Cap Rate
- 3.2%
- Cash-on-Cash Return
- -13.2%
- Debt Coverage Ratio
- 0.52
- Internal Rate of Return (5 years)
- -8.8%
Cash Flow
Net Operating Income (NOI) minus mortgage payments.
Calculation:
NOI - Mortgage Payments
Cap Rate (Market Value)
Capitalization Rate is a rate of return that compares the yearly Net Operating Income (NOI) to the market value.
Calculation:
NOI / Market Value
Cash-on-Cash Return (CoC)
Annual Cash Flow / Cash Invested
Calculation:
Annual cash flow divided by initial cash invested.
Debt Coverage Ratio (DCR)
Net Operating Income (NOI) divided by total debt payments.
Calculation:
NOI / Total Debt Payments
Internal Rate of Return (IRR)
A metric for assessing profitability over time. IRR is the discount rate at which the net present value (NPV) of all future cash flows (positive and negative) from an investment equals zero — including both periodic cash flow (such as rent) and a projected sale at the end of the holding period. It represents the expected annualized return, accounting for income, expenses, and the recovery of capital through a future sale.
Purchase Details
Purchase PriceThe price paid for the property. Purchase price:
| $1,425,000 |
|---|---|
Amount FinancedThe amount of the purchase financed through a loan. Amount financed:
| -$1,140,000 |
Down paymentThe initial payment made towards the purchase. Down payment:
| $285,000 |
Closing CostsFees and expenses associated with purchasing a property, typically ranging from 2% to 5% of the home’s purchase price, paid at the end of a home purchase to cover services like lending, title transfer, and taxes. Closing costs:
| $42,750 |
Rehab CostsCosts incurred to repair or improve the property, including: roof, flooring, exterior siding, kitchen, exterior paint, bathrooms, etc. Rehab costs:
| $0 |
Initial Cash InvestedThe total initial cash invested in the property. Calculation:Down payment + Buying costs + Rehab costs Initial cash invested:
| $327,750 |
Square Feet (SQFT)The total square footage of the property. Square feet:
| 3,630 |
Cost Per Square FootCost per square foot of the property. Calculation:Purchase Price / Square Feet Cost per square foot:
| $393 |
Monthly Rent Per Square FootMonthly rent divided by the number of square feet. This ratio helps investors compare rental income efficiency across properties, markets, and unit sizes Calculation:Monthly Rent / Square Feet Monthly rent per square foot:
| $1.96 |
Financing Details
Loan AmountThe total sum of money borrowed from a lender to finance a property purchase. Calculation:Purchase Price - Down Payment
Loan amount:
| $1,140,000 |
|---|---|
Loan to Value Ratio (LTV)Loan amount divided by the market value of the property. Calculation:Loan Amount / Market Value
Loan to value ratio:
| 80.0% |
Loan TypeThe type of loan (e.g., fixed, adjustable).
Loan type:
| Amortizing |
TermThe loan repayment period in years.
Term:
| 30 years |
Interest RateThe percentage a lender charges on the borrowed amount of a loan, determining the cost of borrowing money.
Interest rate:
| 6.810% |
Principal & Interest (PI)The principal is the portion of the loan payment that reduces the loan balance. The interest is the lender's charge for borrowing money. Calculation:(P * r * (1 + r) ** n) / ((1 + r) ** n - 1) Where:
P = Loan amount (principal)
Principal & interest:
| $7,440 |
Property TaxesAnnual taxes levied by local governments on real estate properties. These taxes fund public services like schools, roads, and emergency services.
Property tax:
| $877 |
InsuranceThe costs for insurance coverage to protect against financial losses due to risks like fire, natural disasters, theft, liability, or tenant-related damages. Calculation:Assumes 7% of gross rental income, unless insurance rates are specified.
Insurance:
| $497 |
Private Mortgage Insurance (PMI)A fee that borrowers pay when they take out a conventional loan with a loan-to-value (LTV) ratio above 80%.
Private mortgage insurance (PMI):
| $0 |
Monthly PaymentThe fixed amount a borrower pays each month to repay a loan. It typically includes principal and interest (P&I) and may also cover property taxes, insurance, HOA fees, and PMI if escrowed. Monthly payment:
| $8,814 |
Operating Income
| % Rent | Monthly | Yearly | |
|---|---|---|---|
Gross RentThe total rental income received from tenants before deducting any expenses. Includes base rent, late fees, pet fees, parking fees, and other recurring charges.
Gross rent:
| $7,100 | $85,200 | |
Vacancy LossExpected loss of rent due to vacancies.
Vacancy loss:
(6%)
| 6% | -$426 | -$5,112 |
Operating IncomeGross rental income minus vacancy loss. Calculation:Gross rent - Vacancy loss
Operating income:
| $6,674 | $80,088 |
Operating Expenses
| % Rent | Monthly | Yearly | |
|---|---|---|---|
Property TaxesAnnual taxes levied by local governments on real estate properties. These taxes fund public services like schools, roads, and emergency services. | 12% | -$877 | -$10,520 |
InsuranceThe costs for insurance coverage to protect against financial losses due to risks like fire, natural disasters, theft, liability, or tenant-related damages. Calculation:Assumes 7% of gross rental income, unless insurance rates are specified. | 7% | -$497 | -$5,964 |
Property ManagementThe costs associated with hiring a property manager to handle the day-to-day operations of a rental property. Includes management fees, leasing fes, eviction fees, etc. Calculation:Assumes 8% of gross rental income. | 8% | -$568 | -$6,816 |
Repairs & MaintenanceOngoing costs for routine upkeep and minor fixes needed to keep a property in good working condition. Calculation:Assumes 5% of gross rental income. Varies by property age and condition. | 5% | -$355 | -$4,260 |
Capital ExpensesLarge, infrequent costs for major improvements or replacements, like a new roof, HVAC system, or appliances. Calculation:Assumes 5% of gross rental income. Varies by property age. | 5% | -$355 | -$4,260 |
HOA FeesRegular dues paid to a Homeowners Association for community maintenance, amenities, and management. Similar fees include: Condo Association Fees, Co-op Maintenance Fees, etc. | 3% | -$180 | -$2,160 |
Operating ExpensesRecurring costs required to maintain and manage a rental property, including property taxes, insurance, maintenance, repairs, utilities (if paid by the owner), property management fees, and other day-to-day expenses. Calculation:Insurance + Property Taxes + Property Management + Repairs & Maintenance + Capital Expenditures + HOA Fees | 40% | -$2,832 | -$33,980 |
Cash Flow
| Monthly | Yearly | |
|---|---|---|
Net Operating Income (NOI)The income generated from a property after deducting all operating expenses but before deducting mortgage payments, taxes, and capital expenditures. Calculation:Gross Operating Income - Operating Expenses
Net operating income:
| $3,842 | $46,104 |
Mortgage PaymentThe fixed amount a borrower pays each month to repay a loan. It typically includes principal and interest (P&I) and may also cover property taxes, insurance, HOA fees, and PMI if escrowed. | -$7,440 | -$89,280 |
Cash FlowNet Operating Income (NOI) minus mortgage payments. Calculation:NOI - Mortgage Payments | $3,598 | $43,176 |