$1,185,000
Investment Summary
- Monthly Cash Flow
- -$2,235
- Cap Rate
- 3.9%
- Cash-on-Cash Return
- -9.8%
- Debt Coverage Ratio
- 0.63
- Internal Rate of Return (5 years)
- -5.5%
Cash Flow
Net Operating Income (NOI) minus mortgage payments.
Calculation:
NOI - Mortgage Payments
Cap Rate (Market Value)
Capitalization Rate is a rate of return that compares the yearly Net Operating Income (NOI) to the market value.
Calculation:
NOI / Market Value
Cash-on-Cash Return (CoC)
Annual Cash Flow / Cash Invested
Calculation:
Annual cash flow divided by initial cash invested.
Debt Coverage Ratio (DCR)
Net Operating Income (NOI) divided by total debt payments.
Calculation:
NOI / Total Debt Payments
Internal Rate of Return (IRR)
A metric for assessing profitability over time. IRR is the discount rate at which the net present value (NPV) of all future cash flows (positive and negative) from an investment equals zero — including both periodic cash flow (such as rent) and a projected sale at the end of the holding period. It represents the expected annualized return, accounting for income, expenses, and the recovery of capital through a future sale.
Property Description
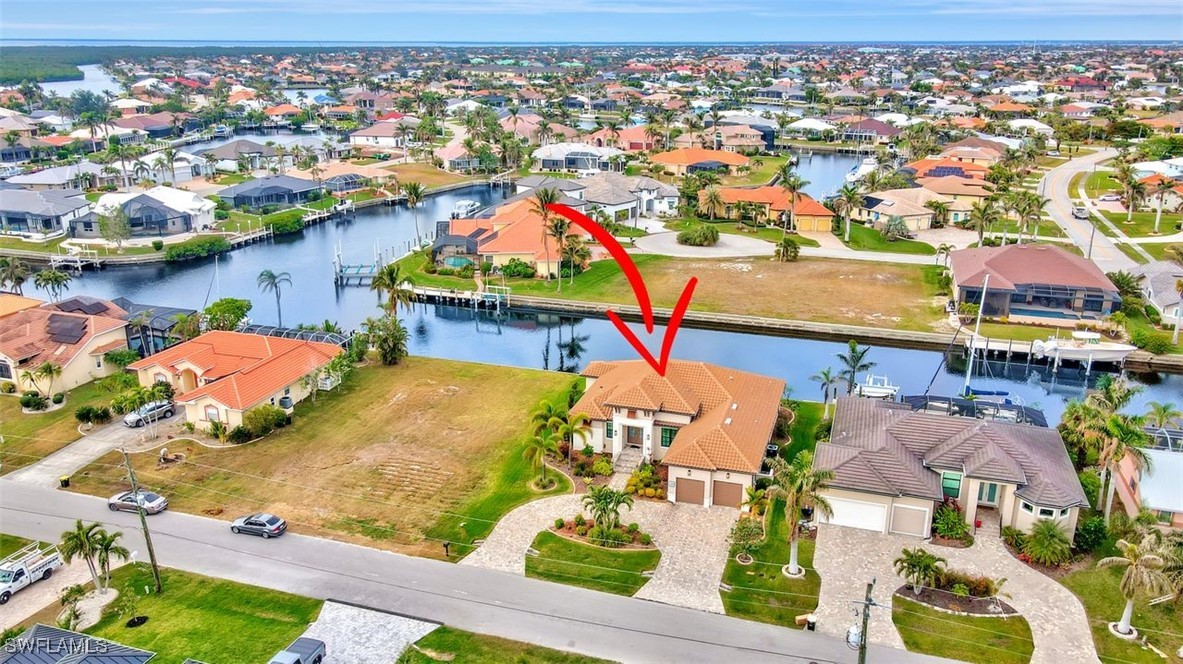
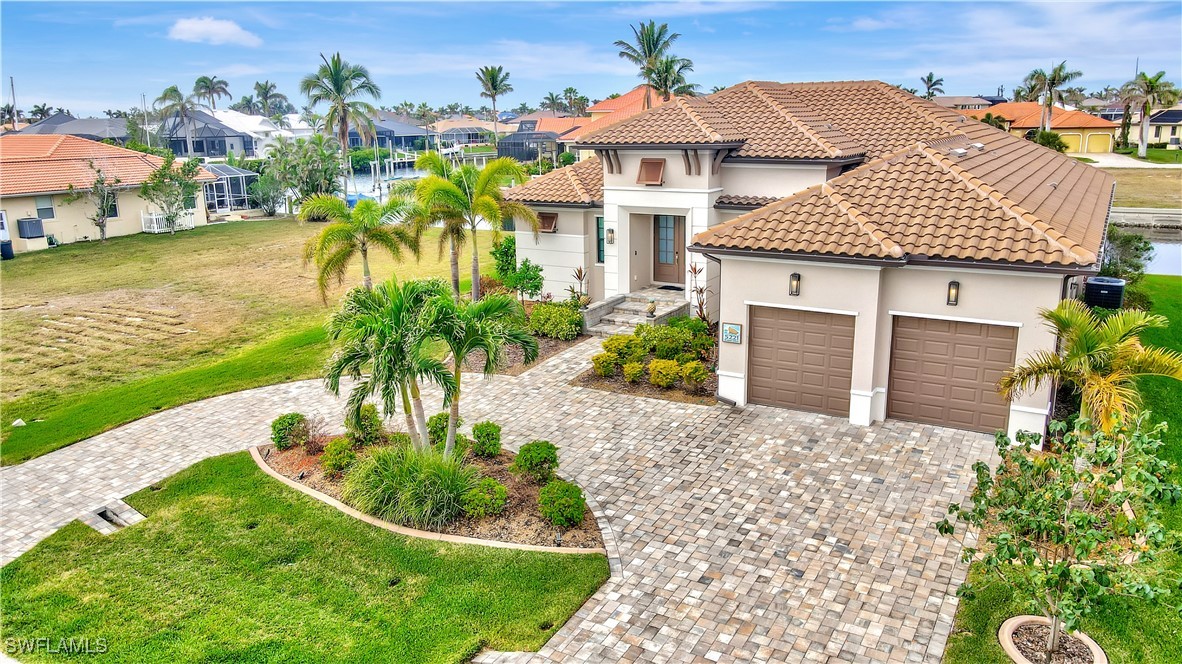
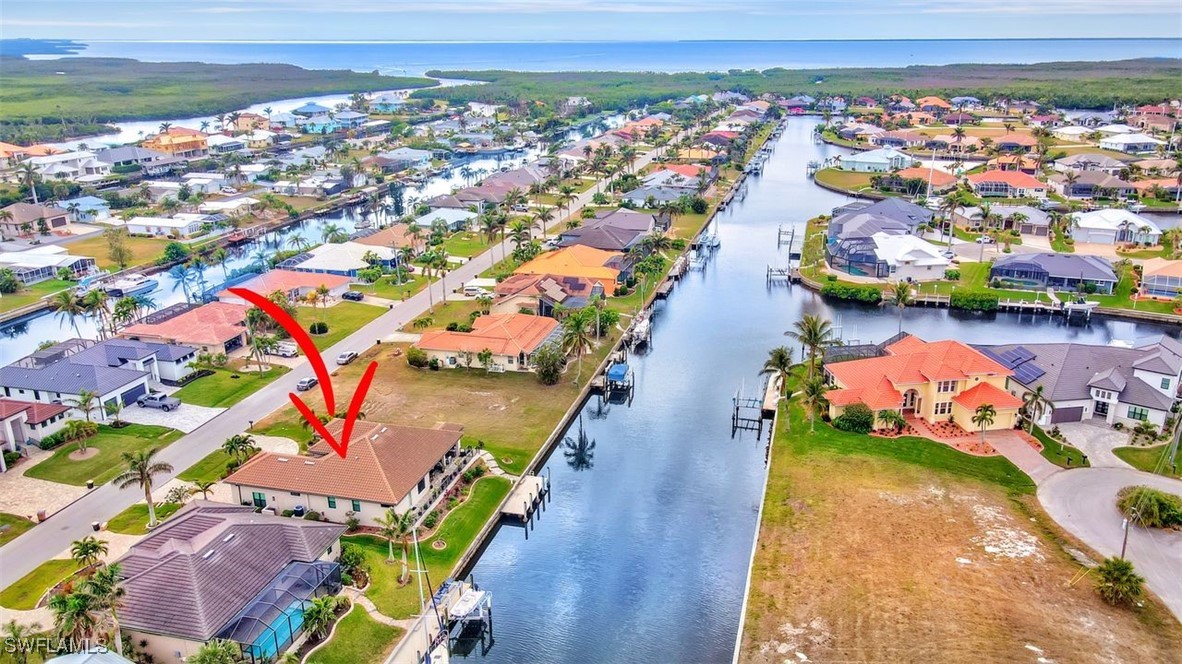
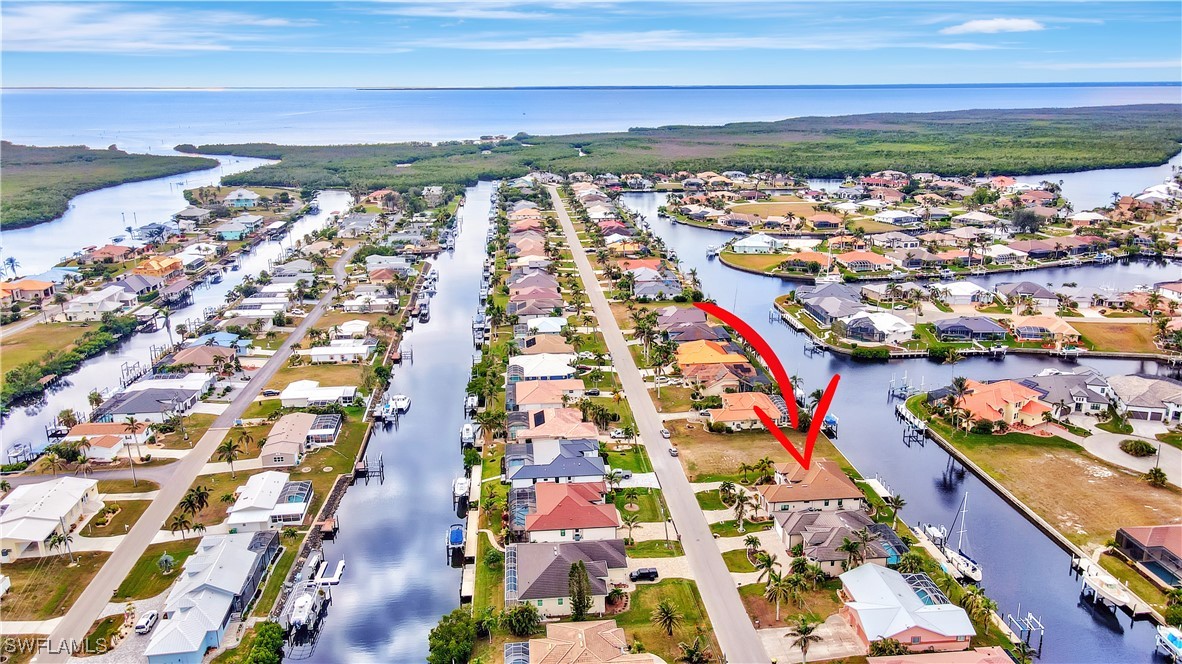
The world is your oyster with sailboat/large power boat quick access to the Harbor and Gulf! Superior luxury is found from the moment you arrive at the circular paver driveway. Inside you'll find an open floor plan designed to accentuate the view of intersecting canals. Throughout the house you’ll find IMPACT windows, tray ceilings, large plank tile floors, and beautiful lighting abundant with timers and dimmers. Granite countertops enhance the beauty. A glass wine enclosure captures your eye in the kitchen, which is accentuated by upper and lower cabinet lighting, specialized cabinet drawers, a walk-in pantry and double door pantry, a coffee bar, and a dry bar that flows into the living room for convenient entertaining. The triple sliding glass door "pockets" into the wall, opening up to an outdoor space that takes your breath away. A 57' lanai borders the canalfront, complete with remote-controlled roll-down sun shades, a custom built wet bar, lighting options, and wiring for a jacuzzi. A paver patio just below is designed for grilling and has access to a tall storage room. The pavers continue down to the 30' x 10' dock and 80' of concrete seawall that is city-maintained for your convenience! There are no bridges limiting your boating access to the Gulf, and it's just a few minutes ride to the Buckley's Pass access to the harbor. No thought was spared when wiring for televisions and interior/exterior speakers, timed exterior lighting and sprinklers, and an alarm system. Both of the guest bedrooms are entered through their own halls with full bathrooms, and have built-in makeup or computer vanities and extra wide closets. Privacy is found in the primary bedroom suite, complete with a deep walk-in closet, linen closet, and tile shower. An office nook off of the foyer can easily be closet space if preferred. The laundry room includes the refrigerator, washer and dryer, a sink, drying rack, and ample cabinets. No HOA! Owners have the OPTION to join the Punta Gorda Isles Civic Association and its many recreational activities. Waterfront restaurants, live music, Fisherman's Village and the new Sun Seeker Resort are only a boat ride or short drive away! Punta Gorda is well-loved for it's 2.5 mile harbor walk connecting the restaurants and boutiques at Fisherman's Village with downtown and some of the city's beautiful parks and pickleball courts. The Punta Gorda airport, hospital, and friendly vibe make it a top choice destination. Almar Drive is the best kept secret of PGI for superior boating,a short drive to US 41, and newer homes. The deep canal has been chosen for the Punta Gorda Isles lighted Christmas parade--a spectacular sight and festive event! Walk inside this impressive home, and you won't want to leave! Owner states to bring all offers.
Build Your Team
Quickly find investor-friendly professionals who can help you succeed in real estate investing at any stage of the investing journey.


Agents
Match with investor-friendly agents who can help you find, analyze, and close your next deal


Lenders
Get the best funding…find investor-friendly lenders who specialize in your deal strategy


Property Managers
Transition to passive investing. Find a trusted property management partnership that lasts.


Tax Pros & Accountants
Taxes and financial reporting made easy—find experts to create tax savings strategies, file taxes, and more
Location
Property Details
Parking
- Description: Circular Driveway, Driveway, Garage Door Opener
- Details: Attached, Circular Driveway, Driveway, Garage, Paved, Garage Door Opener
- Garage Spaces: 2
- Spaces Total: 0
Bedroom Information
- # of Bedrooms: 3
Bathroom Information
- # of Baths (Full): 3
- # of Baths (Total): 3.0
Interior Features
- # of Rooms: 8
- # of Stories: 1
Exterior Features
- Exterior Walls Materials: Stucco
- Roof Material: Tile
Land Information
- Land Use: Residential
- Land Use Subtype: Single Family Residential
Lot Information
- Parcel ID: 412224480005
- Lot Size: 0 sqft
Property Information
- Property Type: Single Family Residence
- Style: Florida
- Year Built: 2021
Tax Information
- Annual Tax: $1,176
Utilities
- Water & Sewer: Public
- Heating: Central, Electric
- Cooling: Central Air, Ceiling Fan(s), Electric
Location
- County: Charlotte
Listing Details
Investment Summary
- Monthly Cash Flow
- -$2,235
- Cap Rate
- 3.9%
- Cash-on-Cash Return
- -9.8%
- Debt Coverage Ratio
- 0.63
- Internal Rate of Return (5 years)
- -5.5%
Cash Flow
Net Operating Income (NOI) minus mortgage payments.
Calculation:
NOI - Mortgage Payments
Cap Rate (Market Value)
Capitalization Rate is a rate of return that compares the yearly Net Operating Income (NOI) to the market value.
Calculation:
NOI / Market Value
Cash-on-Cash Return (CoC)
Annual Cash Flow / Cash Invested
Calculation:
Annual cash flow divided by initial cash invested.
Debt Coverage Ratio (DCR)
Net Operating Income (NOI) divided by total debt payments.
Calculation:
NOI / Total Debt Payments
Internal Rate of Return (IRR)
A metric for assessing profitability over time. IRR is the discount rate at which the net present value (NPV) of all future cash flows (positive and negative) from an investment equals zero — including both periodic cash flow (such as rent) and a projected sale at the end of the holding period. It represents the expected annualized return, accounting for income, expenses, and the recovery of capital through a future sale.
Purchase Details
Purchase PriceThe price paid for the property. Purchase price:
| $1,185,000 |
|---|---|
Amount FinancedThe amount of the purchase financed through a loan. Amount financed:
| -$948,000 |
Down paymentThe initial payment made towards the purchase. Down payment:
| $237,000 |
Closing CostsFees and expenses associated with purchasing a property, typically ranging from 2% to 5% of the home’s purchase price, paid at the end of a home purchase to cover services like lending, title transfer, and taxes. Closing costs:
| $35,550 |
Rehab CostsCosts incurred to repair or improve the property, including: roof, flooring, exterior siding, kitchen, exterior paint, bathrooms, etc. Rehab costs:
| $0 |
Initial Cash InvestedThe total initial cash invested in the property. Calculation:Down payment + Buying costs + Rehab costs Initial cash invested:
| $272,550 |
Square Feet (SQFT)The total square footage of the property. Square feet:
| 2,233 |
Cost Per Square FootCost per square foot of the property. Calculation:Purchase Price / Square Feet Cost per square foot:
| $531 |
Monthly Rent Per Square FootMonthly rent divided by the number of square feet. This ratio helps investors compare rental income efficiency across properties, markets, and unit sizes Calculation:Monthly Rent / Square Feet Monthly rent per square foot:
| $2.55 |
Financing Details
Loan AmountThe total sum of money borrowed from a lender to finance a property purchase. Calculation:Purchase Price - Down Payment
Loan amount:
| $948,000 |
|---|---|
Loan to Value Ratio (LTV)Loan amount divided by the market value of the property. Calculation:Loan Amount / Market Value
Loan to value ratio:
| 80.0% |
Loan TypeThe type of loan (e.g., fixed, adjustable).
Loan type:
| Amortizing |
TermThe loan repayment period in years.
Term:
| 30 years |
Interest RateThe percentage a lender charges on the borrowed amount of a loan, determining the cost of borrowing money.
Interest rate:
| 6.625% |
Principal & Interest (PI)The principal is the portion of the loan payment that reduces the loan balance. The interest is the lender's charge for borrowing money. Calculation:(P * r * (1 + r) ** n) / ((1 + r) ** n - 1) Where:
P = Loan amount (principal)
Principal & interest:
| $6,070 |
Property TaxesAnnual taxes levied by local governments on real estate properties. These taxes fund public services like schools, roads, and emergency services.
Property tax:
| $98 |
InsuranceThe costs for insurance coverage to protect against financial losses due to risks like fire, natural disasters, theft, liability, or tenant-related damages. Calculation:Assumes 7% of gross rental income, unless insurance rates are specified.
Insurance:
| $399 |
Private Mortgage Insurance (PMI)A fee that borrowers pay when they take out a conventional loan with a loan-to-value (LTV) ratio above 80%.
Private mortgage insurance (PMI):
| $0 |
Monthly PaymentThe fixed amount a borrower pays each month to repay a loan. It typically includes principal and interest (P&I) and may also cover property taxes, insurance, HOA fees, and PMI if escrowed. Monthly payment:
| $6,567 |
Operating Income
| % Rent | Monthly | Yearly | |
|---|---|---|---|
Gross RentThe total rental income received from tenants before deducting any expenses. Includes base rent, late fees, pet fees, parking fees, and other recurring charges.
Gross rent:
| $5,700 | $68,400 | |
Vacancy LossExpected loss of rent due to vacancies.
Vacancy loss:
(6%)
| 6% | -$342 | -$4,104 |
Operating IncomeGross rental income minus vacancy loss. Calculation:Gross rent - Vacancy loss
Operating income:
| $5,358 | $64,296 |
Operating Expenses
| % Rent | Monthly | Yearly | |
|---|---|---|---|
Property TaxesAnnual taxes levied by local governments on real estate properties. These taxes fund public services like schools, roads, and emergency services. | 2% | -$98 | -$1,176 |
InsuranceThe costs for insurance coverage to protect against financial losses due to risks like fire, natural disasters, theft, liability, or tenant-related damages. Calculation:Assumes 7% of gross rental income, unless insurance rates are specified. | 7% | -$399 | -$4,788 |
Property ManagementThe costs associated with hiring a property manager to handle the day-to-day operations of a rental property. Includes management fees, leasing fes, eviction fees, etc. Calculation:Assumes 8% of gross rental income. | 8% | -$456 | -$5,472 |
Repairs & MaintenanceOngoing costs for routine upkeep and minor fixes needed to keep a property in good working condition. Calculation:Assumes 5% of gross rental income. Varies by property age and condition. | 5% | -$285 | -$3,420 |
Capital ExpensesLarge, infrequent costs for major improvements or replacements, like a new roof, HVAC system, or appliances. Calculation:Assumes 5% of gross rental income. Varies by property age. | 5% | -$285 | -$3,420 |
HOA FeesRegular dues paid to a Homeowners Association for community maintenance, amenities, and management. Similar fees include: Condo Association Fees, Co-op Maintenance Fees, etc. | n/a | n/a | n/a |
Operating ExpensesRecurring costs required to maintain and manage a rental property, including property taxes, insurance, maintenance, repairs, utilities (if paid by the owner), property management fees, and other day-to-day expenses. Calculation:Insurance + Property Taxes + Property Management + Repairs & Maintenance + Capital Expenditures + HOA Fees | 27% | -$1,523 | -$18,276 |
Cash Flow
| Monthly | Yearly | |
|---|---|---|
Net Operating Income (NOI)The income generated from a property after deducting all operating expenses but before deducting mortgage payments, taxes, and capital expenditures. Calculation:Gross Operating Income - Operating Expenses
Net operating income:
| $3,835 | $46,020 |
Mortgage PaymentThe fixed amount a borrower pays each month to repay a loan. It typically includes principal and interest (P&I) and may also cover property taxes, insurance, HOA fees, and PMI if escrowed. | -$6,070 | -$72,840 |
Cash FlowNet Operating Income (NOI) minus mortgage payments. Calculation:NOI - Mortgage Payments | $2,235 | $26,820 |