$1,600,000
Investment Summary
- Monthly Cash Flow
- -$5,920
- Cap Rate
- 1.7%
- Cash-on-Cash Return
- -19.3%
- Debt Coverage Ratio
- 0.28
- Internal Rate of Return (5 years)
- -14.6%
Cash Flow
Net Operating Income (NOI) minus mortgage payments.
Calculation:
NOI - Mortgage Payments
Cap Rate (Market Value)
Capitalization Rate is a rate of return that compares the yearly Net Operating Income (NOI) to the market value.
Calculation:
NOI / Market Value
Cash-on-Cash Return (CoC)
Annual Cash Flow / Cash Invested
Calculation:
Annual cash flow divided by initial cash invested.
Debt Coverage Ratio (DCR)
Net Operating Income (NOI) divided by total debt payments.
Calculation:
NOI / Total Debt Payments
Internal Rate of Return (IRR)
A metric for assessing profitability over time. IRR is the discount rate at which the net present value (NPV) of all future cash flows (positive and negative) from an investment equals zero — including both periodic cash flow (such as rent) and a projected sale at the end of the holding period. It represents the expected annualized return, accounting for income, expenses, and the recovery of capital through a future sale.
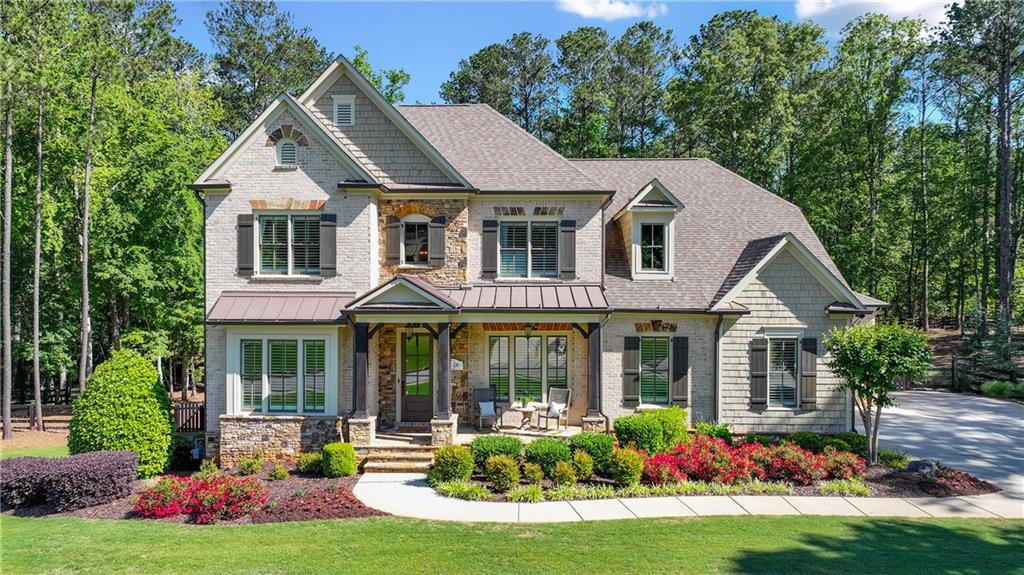
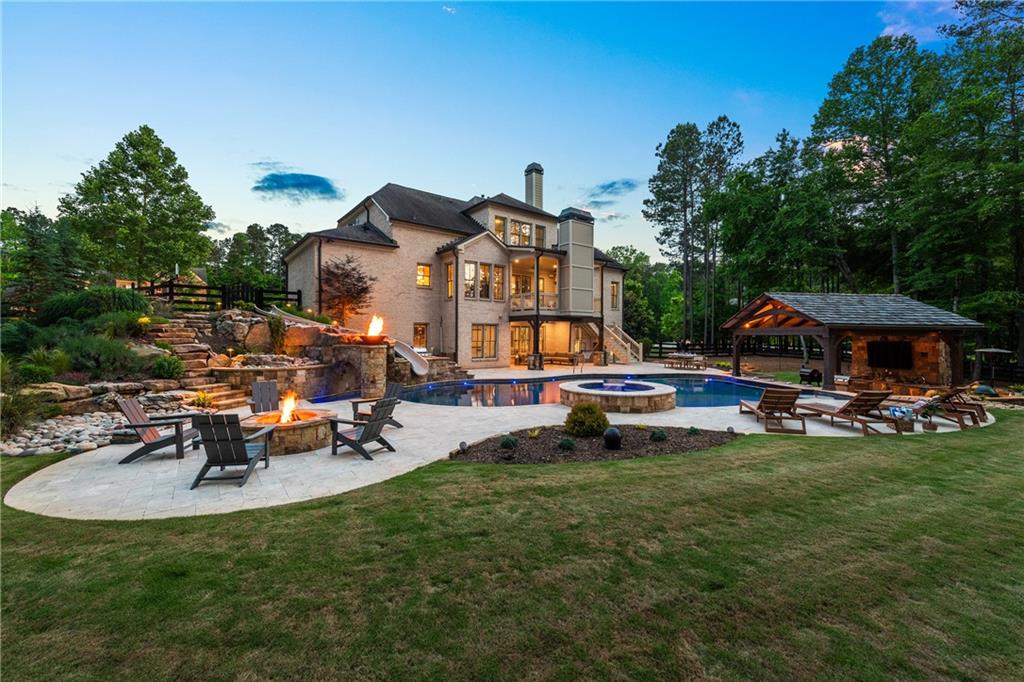
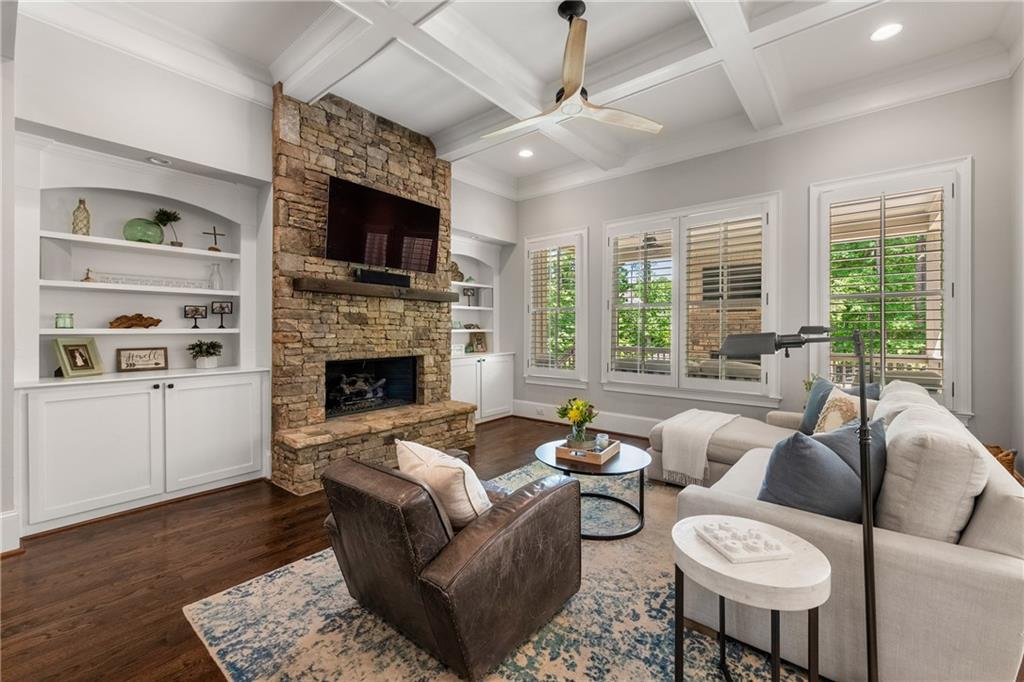
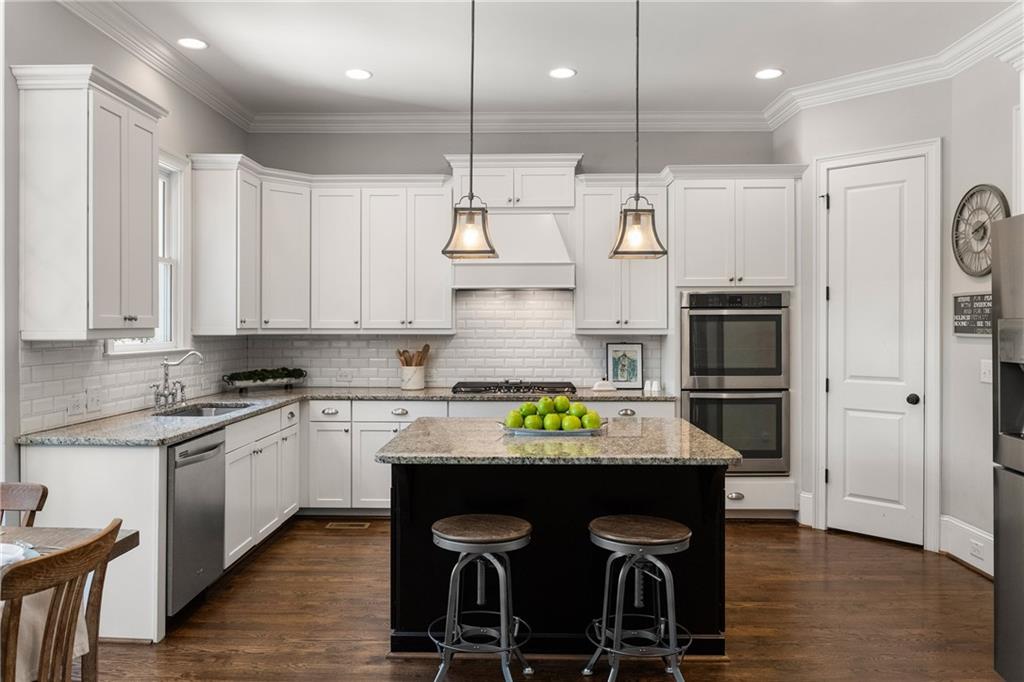
Property Description
This extraordinary home offers a seamless blend of luxurious living, thoughtful design, and spectacular outdoor amenities—creating a private retreat that's as functional as it is unforgettable. From the moment you step inside, you’ll notice the balance between refined comfort and modern elegance, with a layout that caters to both everyday life and effortless entertaining. The primary owner’s suite is located on the main level, offering the perfect combination of convenience and privacy. Spacious and serene, the suite features a spa-inspired en-suite bathroom and a custom walk-in closet. Upstairs, the home continues to impress with four generously sized bedrooms and a large game room, offering flexible space for family, guests, or creative use. The heart of the home is the gourmet kitchen, beautifully appointed with high-end appliances, an oversized island, and ample cabinetry. The kitchen flows directly into the family room, where a floor-to-ceiling stone fireplace adds warmth and charm. This open-concept living space is designed for connection, comfort, and style, with easy access to the covered porch—perfect for relaxing or dining outdoors while overlooking the backyard. The finished terrace level takes the home to a whole new level of entertainment and character. Designed with exposed interior brick walls, wooden beams across the ceiling, and a custom metal roof feature over the bar area, this space delivers a unique blend of rustic charm and contemporary flair. The layout includes a media room, a game area, and a fully open bar, making it ideal for hosting gatherings of any size. A home office, guest bedroom, and full bathroom complete this level, offering comfort and privacy for visitors or remote work needs. One of the most compelling features of this home is its resort-style outdoor living space, which transforms your backyard into a vacation destination. The terrace level opens directly onto the pool area, inviting you into a stunning outdoor oasis. At the center is a sparkling pool with a swim-up bar, surrounded by a sun shelf, cascading waterfall, and a water slide—perfect for relaxation and fun. A sunken outdoor kitchen gives you full command of the space, with views across the entire pool and patio area, while a firepit provides a cozy spot for evening gatherings. Every element of this backyard was designed to impress and to be enjoyed throughout the seasons. This home offers more than just 1.8 acres of space—it offers a lifestyle. With architectural craftsmanship, luxury finishes, and resort-quality amenities, a property that redefines what it means to truly live well.
Build Your Team
Quickly find investor-friendly professionals who can help you succeed in real estate investing at any stage of the investing journey.


Agents
Match with investor-friendly agents who can help you find, analyze, and close your next deal


Lenders
Get the best funding…find investor-friendly lenders who specialize in your deal strategy


Property Managers
Transition to passive investing. Find a trusted property management partnership that lasts.


Tax Pros & Accountants
Taxes and financial reporting made easy—find experts to create tax savings strategies, file taxes, and more
Location
Property Details
Parking
- Description: Attached, Garage, Garage Faces Side, Kitchen Level, Level Driveway
- Details: Attached, Driveway, Garage, Garage Faces Front, Kitchen Level
- Garage Spaces: 3
- Spaces Total: 3
Bedroom Information
- # of Bedrooms: 6
Bathroom Information
- # of Baths (Full): 5
- # of Baths (Total): 6.0
Interior Features
- # of Rooms: 9
- # of Stories: 3
- Basement: Yes
- Basement Description: Daylight, Exterior Entry, Finished, Full, Interior Entry
- Fireplace: Yes
Exterior Features
- Exterior Walls Materials: Brick
- Foundation: Concrete Perimeter
- Roof Material: Composition, Shingle
- Pool: Yes
HOA
- Has HOA: Yes
- HOA Fee: $1,200/annually
Land Information
- Land Use: Residential
- Land Use Subtype: Single Family Residential
Lot Information
- Parcel ID: 20011100840
- Lot Size: 0 sqft
Property Information
- Property Type: Single Family Residence
- Style: Craftsman, European, Traditional
- Year Built: 2016
Tax Information
- Annual Tax: $12,884
Utilities
- Water & Sewer: Public
- Heating: Baseboard, Forced Air, Natural Gas, Zoned
- Cooling: Central Air, Electric, Zoned
Location
- County: Cobb
Listing Details
Investment Summary
- Monthly Cash Flow
- -$5,920
- Cap Rate
- 1.7%
- Cash-on-Cash Return
- -19.3%
- Debt Coverage Ratio
- 0.28
- Internal Rate of Return (5 years)
- -14.6%
Cash Flow
Net Operating Income (NOI) minus mortgage payments.
Calculation:
NOI - Mortgage Payments
Cap Rate (Market Value)
Capitalization Rate is a rate of return that compares the yearly Net Operating Income (NOI) to the market value.
Calculation:
NOI / Market Value
Cash-on-Cash Return (CoC)
Annual Cash Flow / Cash Invested
Calculation:
Annual cash flow divided by initial cash invested.
Debt Coverage Ratio (DCR)
Net Operating Income (NOI) divided by total debt payments.
Calculation:
NOI / Total Debt Payments
Internal Rate of Return (IRR)
A metric for assessing profitability over time. IRR is the discount rate at which the net present value (NPV) of all future cash flows (positive and negative) from an investment equals zero — including both periodic cash flow (such as rent) and a projected sale at the end of the holding period. It represents the expected annualized return, accounting for income, expenses, and the recovery of capital through a future sale.
Purchase Details
Purchase PriceThe price paid for the property. Purchase price:
| $1,600,000 |
|---|---|
Amount FinancedThe amount of the purchase financed through a loan. Amount financed:
| -$1,280,000 |
Down paymentThe initial payment made towards the purchase. Down payment:
| $320,000 |
Closing CostsFees and expenses associated with purchasing a property, typically ranging from 2% to 5% of the home’s purchase price, paid at the end of a home purchase to cover services like lending, title transfer, and taxes. Closing costs:
| $48,000 |
Rehab CostsCosts incurred to repair or improve the property, including: roof, flooring, exterior siding, kitchen, exterior paint, bathrooms, etc. Rehab costs:
| $0 |
Initial Cash InvestedThe total initial cash invested in the property. Calculation:Down payment + Buying costs + Rehab costs Initial cash invested:
| $368,000 |
Square Feet (SQFT)The total square footage of the property. Square feet:
| 6,145 |
Cost Per Square FootCost per square foot of the property. Calculation:Purchase Price / Square Feet Cost per square foot:
| $260 |
Monthly Rent Per Square FootMonthly rent divided by the number of square feet. This ratio helps investors compare rental income efficiency across properties, markets, and unit sizes Calculation:Monthly Rent / Square Feet Monthly rent per square foot:
| $0.81 |
Financing Details
Loan AmountThe total sum of money borrowed from a lender to finance a property purchase. Calculation:Purchase Price - Down Payment
Loan amount:
| $1,280,000 |
|---|---|
Loan to Value Ratio (LTV)Loan amount divided by the market value of the property. Calculation:Loan Amount / Market Value
Loan to value ratio:
| 80.0% |
Loan TypeThe type of loan (e.g., fixed, adjustable).
Loan type:
| Amortizing |
TermThe loan repayment period in years.
Term:
| 30 years |
Interest RateThe percentage a lender charges on the borrowed amount of a loan, determining the cost of borrowing money.
Interest rate:
| 6.625% |
Principal & Interest (PI)The principal is the portion of the loan payment that reduces the loan balance. The interest is the lender's charge for borrowing money. Calculation:(P * r * (1 + r) ** n) / ((1 + r) ** n - 1) Where:
P = Loan amount (principal)
Principal & interest:
| $8,196 |
Property TaxesAnnual taxes levied by local governments on real estate properties. These taxes fund public services like schools, roads, and emergency services.
Property tax:
| $1,074 |
InsuranceThe costs for insurance coverage to protect against financial losses due to risks like fire, natural disasters, theft, liability, or tenant-related damages. Calculation:Assumes 7% of gross rental income, unless insurance rates are specified.
Insurance:
| $350 |
Private Mortgage Insurance (PMI)A fee that borrowers pay when they take out a conventional loan with a loan-to-value (LTV) ratio above 80%.
Private mortgage insurance (PMI):
| $0 |
Monthly PaymentThe fixed amount a borrower pays each month to repay a loan. It typically includes principal and interest (P&I) and may also cover property taxes, insurance, HOA fees, and PMI if escrowed. Monthly payment:
| $9,620 |
Operating Income
| % Rent | Monthly | Yearly | |
|---|---|---|---|
Gross RentThe total rental income received from tenants before deducting any expenses. Includes base rent, late fees, pet fees, parking fees, and other recurring charges.
Gross rent:
| $5,000 | $60,000 | |
Vacancy LossExpected loss of rent due to vacancies.
Vacancy loss:
(6%)
| 6% | -$300 | -$3,600 |
Operating IncomeGross rental income minus vacancy loss. Calculation:Gross rent - Vacancy loss
Operating income:
| $4,700 | $56,400 |
Operating Expenses
| % Rent | Monthly | Yearly | |
|---|---|---|---|
Property TaxesAnnual taxes levied by local governments on real estate properties. These taxes fund public services like schools, roads, and emergency services. | 21% | -$1,074 | -$12,884 |
InsuranceThe costs for insurance coverage to protect against financial losses due to risks like fire, natural disasters, theft, liability, or tenant-related damages. Calculation:Assumes 7% of gross rental income, unless insurance rates are specified. | 7% | -$350 | -$4,200 |
Property ManagementThe costs associated with hiring a property manager to handle the day-to-day operations of a rental property. Includes management fees, leasing fes, eviction fees, etc. Calculation:Assumes 8% of gross rental income. | 8% | -$400 | -$4,800 |
Repairs & MaintenanceOngoing costs for routine upkeep and minor fixes needed to keep a property in good working condition. Calculation:Assumes 5% of gross rental income. Varies by property age and condition. | 5% | -$250 | -$3,000 |
Capital ExpensesLarge, infrequent costs for major improvements or replacements, like a new roof, HVAC system, or appliances. Calculation:Assumes 5% of gross rental income. Varies by property age. | 5% | -$250 | -$3,000 |
HOA FeesRegular dues paid to a Homeowners Association for community maintenance, amenities, and management. Similar fees include: Condo Association Fees, Co-op Maintenance Fees, etc. | 2% | -$100 | -$1,200 |
Operating ExpensesRecurring costs required to maintain and manage a rental property, including property taxes, insurance, maintenance, repairs, utilities (if paid by the owner), property management fees, and other day-to-day expenses. Calculation:Insurance + Property Taxes + Property Management + Repairs & Maintenance + Capital Expenditures + HOA Fees | 48% | -$2,424 | -$29,084 |
Cash Flow
| Monthly | Yearly | |
|---|---|---|
Net Operating Income (NOI)The income generated from a property after deducting all operating expenses but before deducting mortgage payments, taxes, and capital expenditures. Calculation:Gross Operating Income - Operating Expenses
Net operating income:
| $2,276 | $27,312 |
Mortgage PaymentThe fixed amount a borrower pays each month to repay a loan. It typically includes principal and interest (P&I) and may also cover property taxes, insurance, HOA fees, and PMI if escrowed. | -$8,196 | -$98,352 |
Cash FlowNet Operating Income (NOI) minus mortgage payments. Calculation:NOI - Mortgage Payments | $5,920 | $71,040 |