$464,000
Investment Summary
- Monthly Cash Flow
- -$1,294
- Cap Rate
- 2.9%
- Cash-on-Cash Return
- -14.6%
- Debt Coverage Ratio
- 0.47
- Internal Rate of Return (5 years)
- -10.1%
Cash Flow
Net Operating Income (NOI) minus mortgage payments.
Calculation:
NOI - Mortgage Payments
Cap Rate (Market Value)
Capitalization Rate is a rate of return that compares the yearly Net Operating Income (NOI) to the market value.
Calculation:
NOI / Market Value
Cash-on-Cash Return (CoC)
Annual Cash Flow / Cash Invested
Calculation:
Annual cash flow divided by initial cash invested.
Debt Coverage Ratio (DCR)
Net Operating Income (NOI) divided by total debt payments.
Calculation:
NOI / Total Debt Payments
Internal Rate of Return (IRR)
A metric for assessing profitability over time. IRR is the discount rate at which the net present value (NPV) of all future cash flows (positive and negative) from an investment equals zero — including both periodic cash flow (such as rent) and a projected sale at the end of the holding period. It represents the expected annualized return, accounting for income, expenses, and the recovery of capital through a future sale.
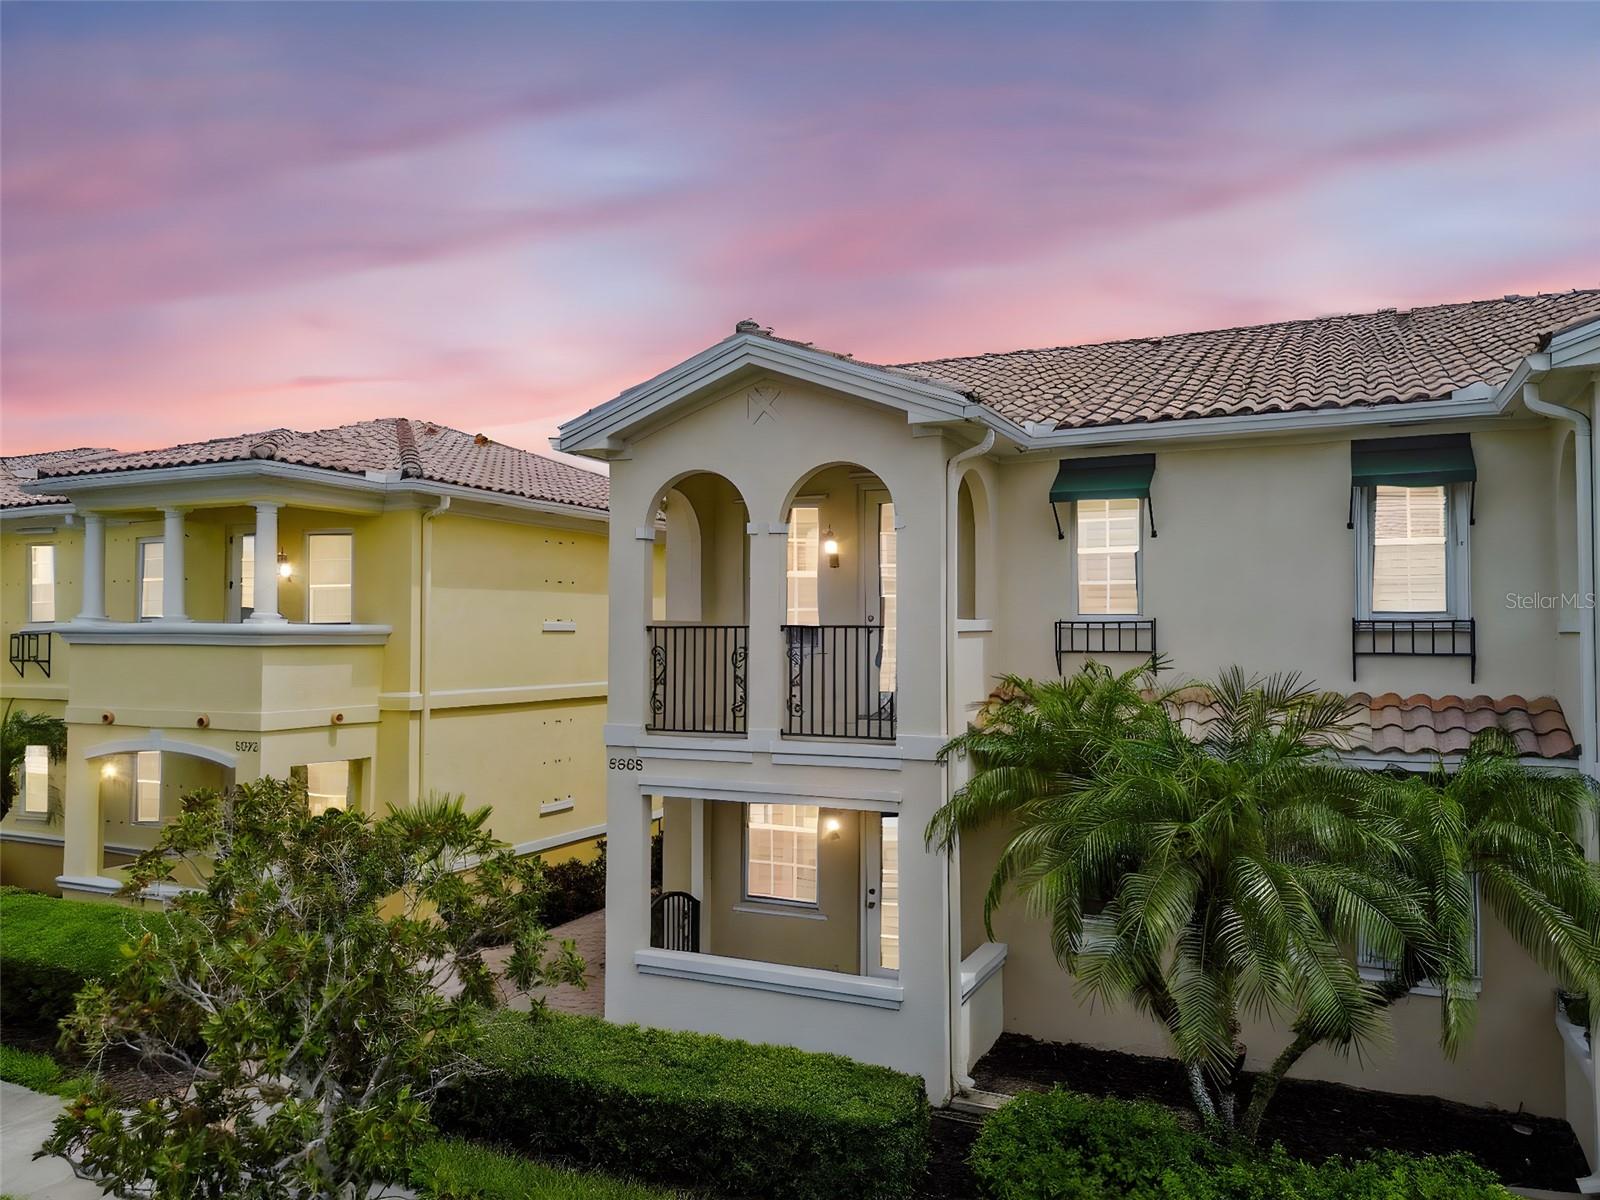
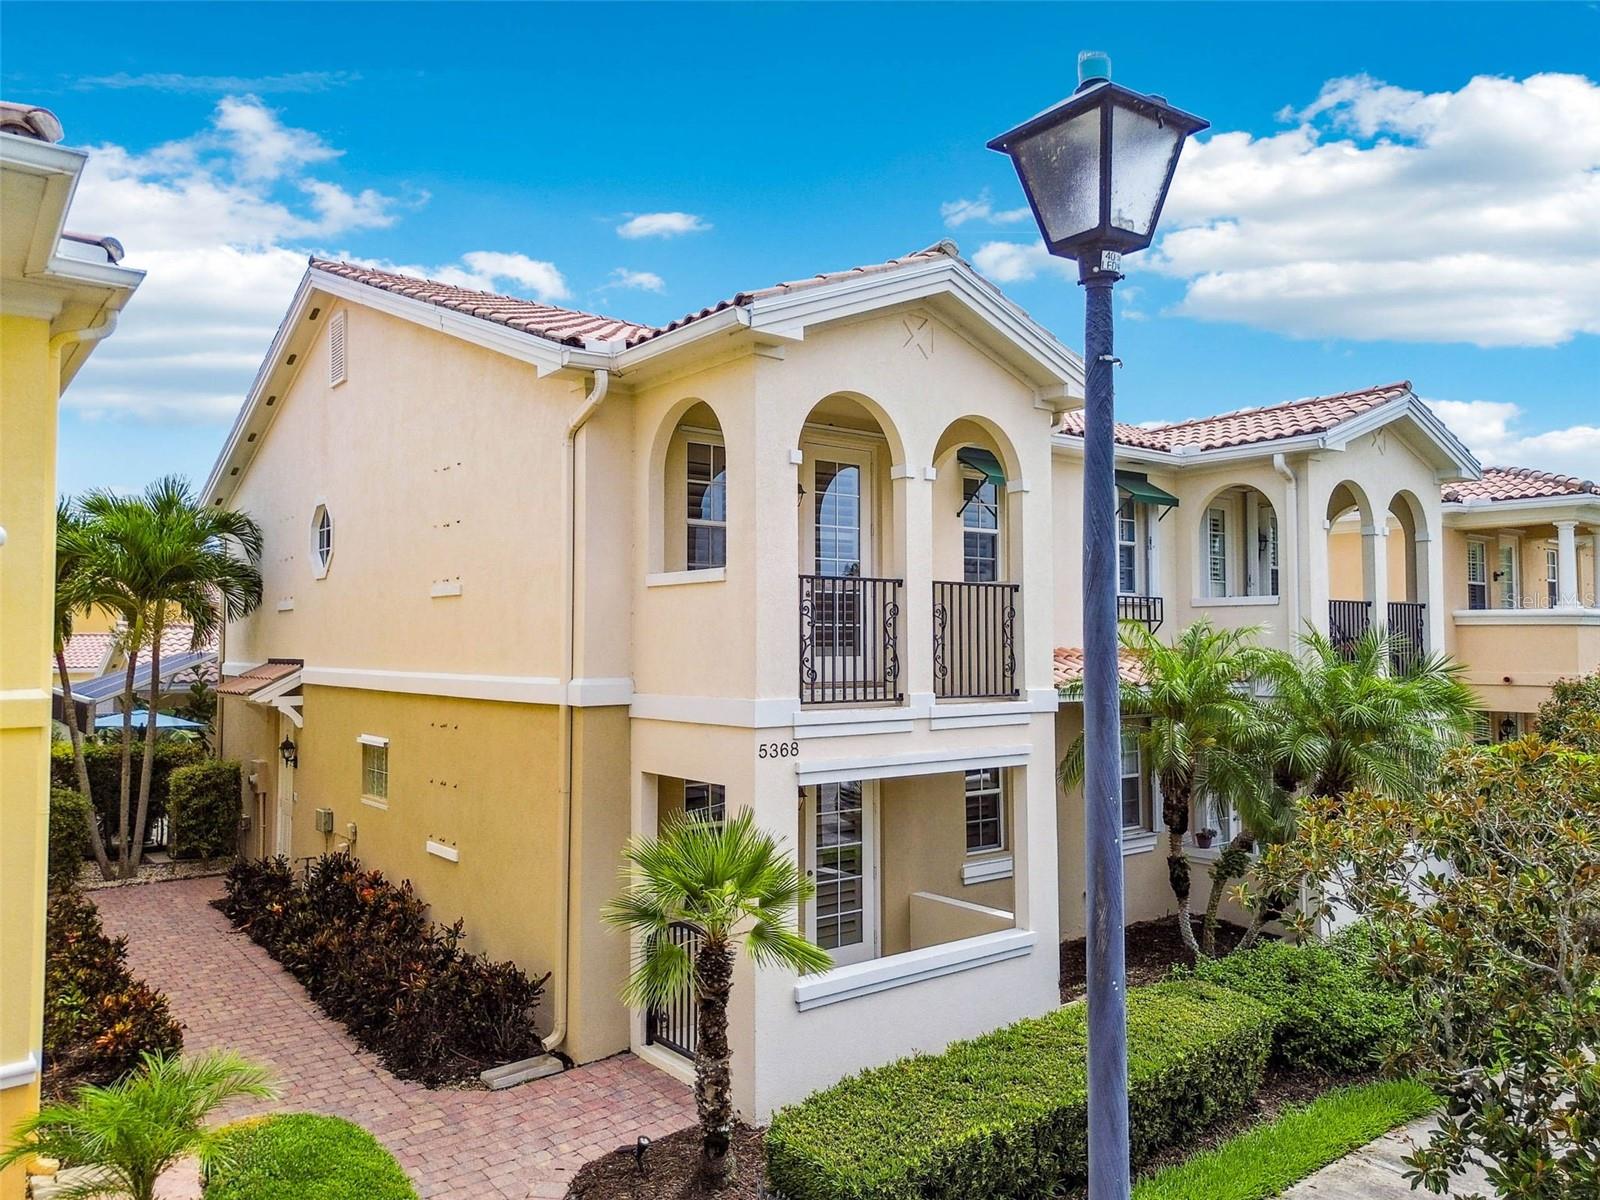
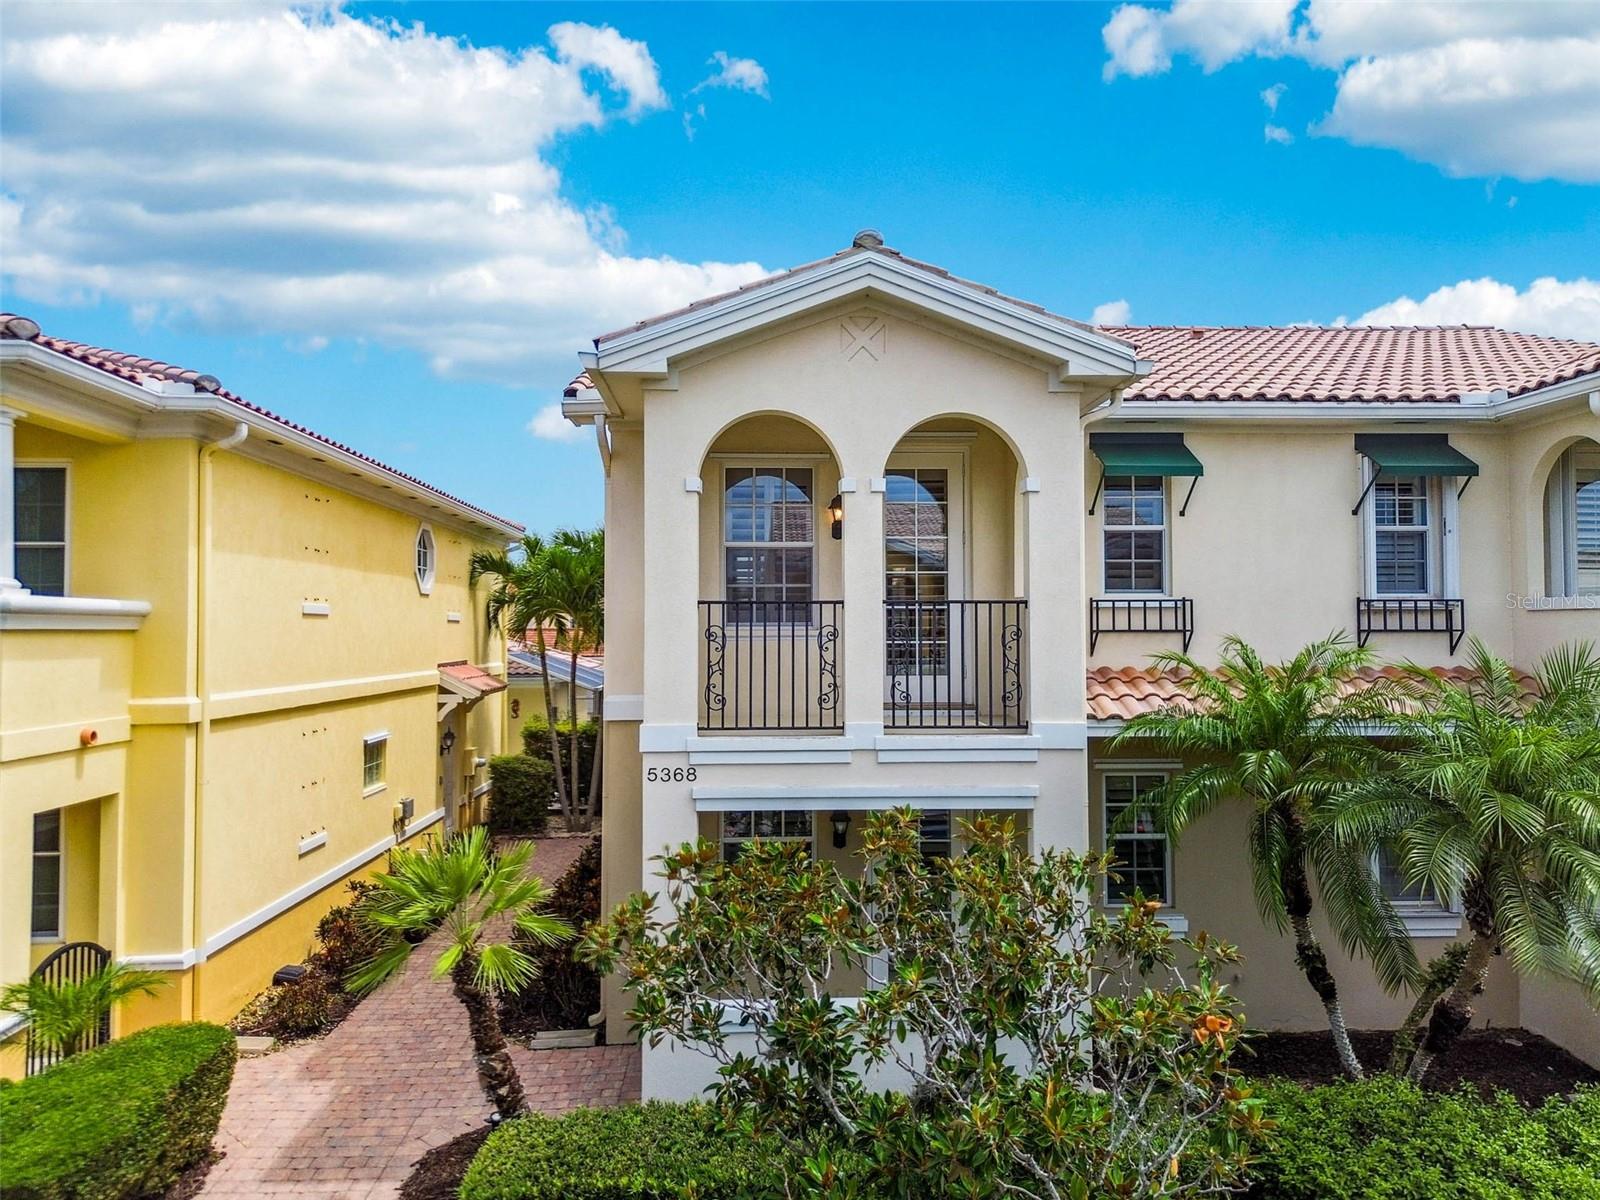
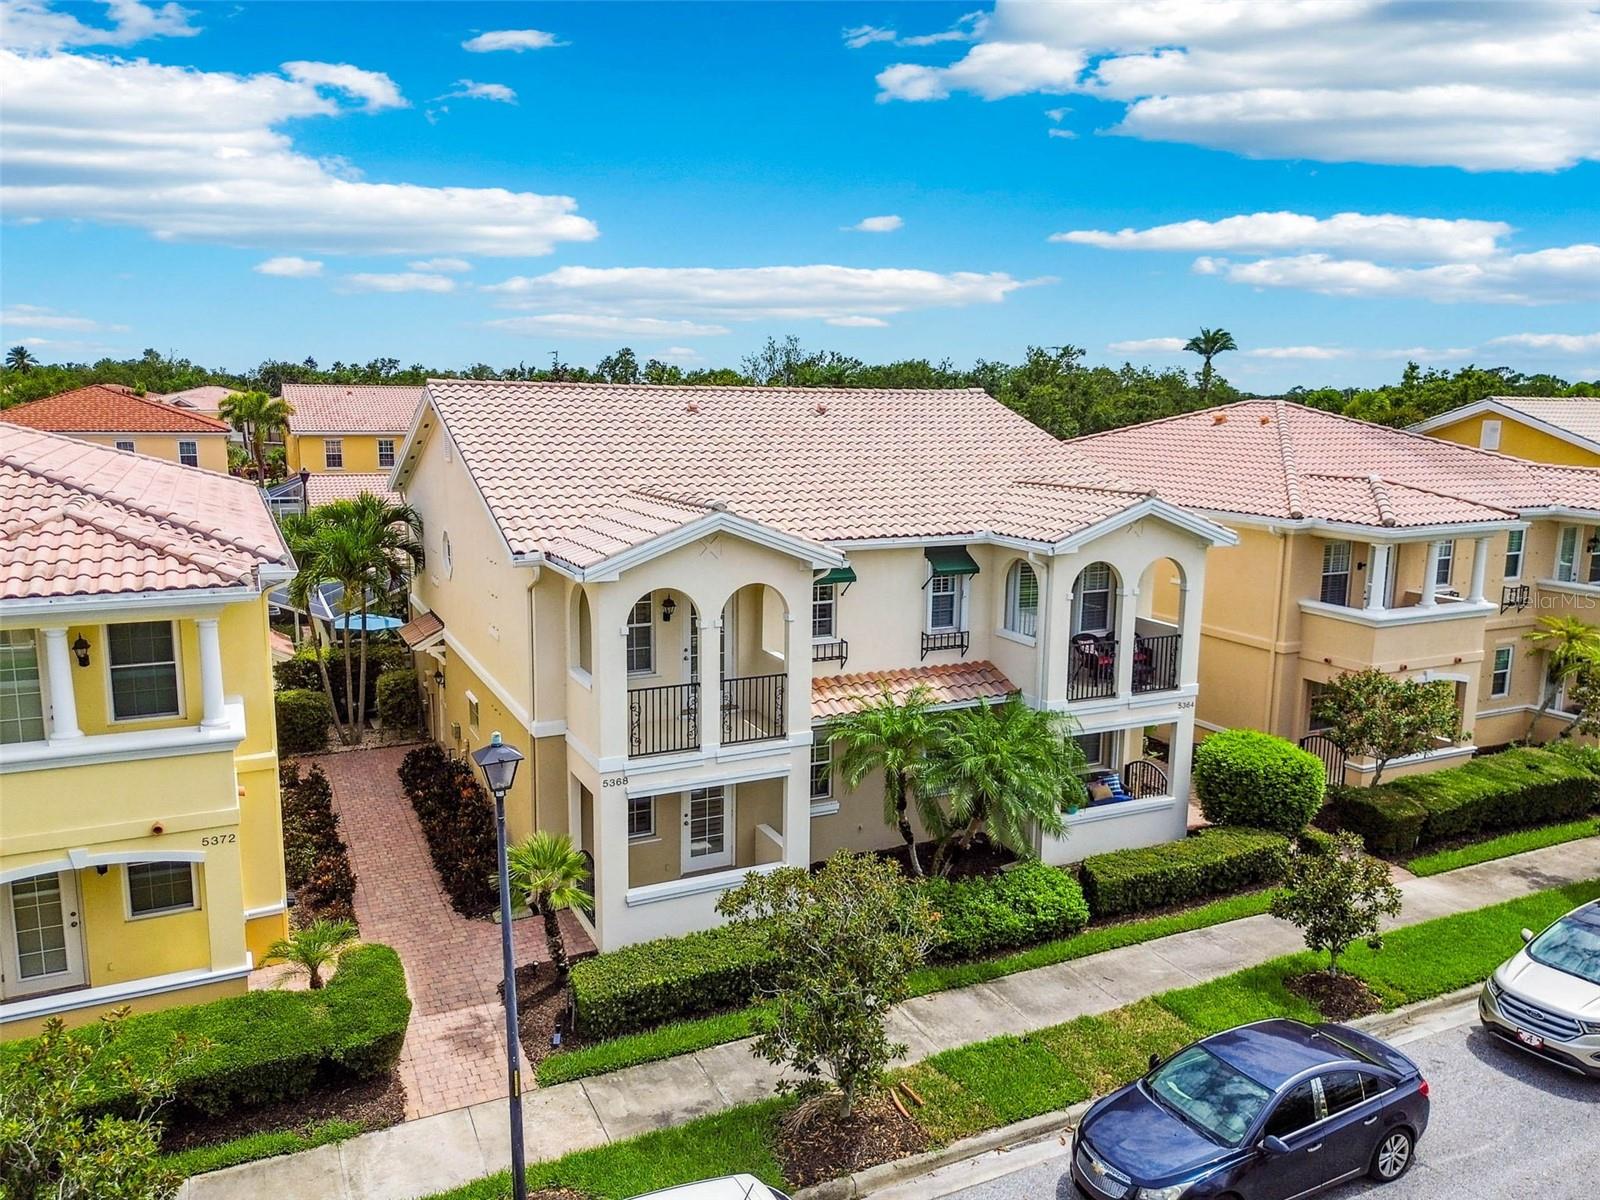
Property Description
You've found it! This gorgeous, beautifully renovated, Cayman townhome with 4 bedrooms, 3 full bathrooms, and a 2 car garage in the highly desirable, resort-style Palmer Ranch community of Villagewalk (only minutes from Siesta Key) is just what you’ve been waiting for! From the moment you step inside, you'll appreciate the open layout, stylish upgrades, and the perfect blend of comfort and functionality. The kitchen is a true show stopper in this home! A dream come true! The kitchen was completely remodeled in 2021-2022 and features custom cabinets with soft close drawers, under cabinet lighting, quartz counter-tops, ceramic tile back-splash, deep composite granite sink, and stainless steel appliances. Enjoy the airy feel of this open floor plan that seamlessly connects the main living area to the outdoors. Large sliding doors open directly to a spacious lanai, flooding the home with natural light and creating a perfect extension of your living space. Upstairs you’ll find two newly updated showers (2023), each designed with modern style and comfort in mind. The spacious master suite offers a large walk in closet, an elegantly updated shower, a soaking tub, and a balcony to enjoy the refreshing morning air. The endless upgrades continue with tile flooring throughout (2021), 5 remote controlled ceiling fans and recessed lighting (2021-2022), motorized privacy/sun shade on lanai (2021), water heater (2025), AC and air handler (2021), EV charger outlet in garage (2021), entire house surge protector (2024), garage door motor (2023), garage door springs (2025), and garage floor resurfacing (2021). There’s nothing left to do except move in! With hurricane shutters and the exterior built using poured concrete over re-bar, this home is rated for a CAT 5 hurricane and provides peace of mind. This gorgeous home happens to be located in one of the most desirable communities in Palmer Ranch; Villagewalk. It truly feels like a resort with the 6 Har-Tru lighted tennis courts, pickleball and basketball courts, fitness center overlooking the lake fountain, bocce ball, two geo-thermal heated pools (one lap pool and one lagoon pool that offers food and drinks), a poolside tiki bar, walking trails along beautiful lakes and over bridges through over 500 meticulously landscaped acres with an abundance of wildlife, your very own cafe and bar, a gas station, hair salon, gift shop, and Town Center with multi-purpose meeting rooms and endless scheduled activities. And on top of it all, this is such a family friendly neighborhood in one of the best school districts! This location is also perfect for rowing families, ideally located between Osprey and Benderson Park, offering convenient access to training and regattas. Just minutes from your front door is the Legacy Trail—one of the area’s most popular routes for biking, running, and walking. This one won't last long!
Build Your Team
Quickly find investor-friendly professionals who can help you succeed in real estate investing at any stage of the investing journey.


Agents
Match with investor-friendly agents who can help you find, analyze, and close your next deal


Lenders
Get the best funding…find investor-friendly lenders who specialize in your deal strategy


Property Managers
Transition to passive investing. Find a trusted property management partnership that lasts.


Tax Pros & Accountants
Taxes and financial reporting made easy—find experts to create tax savings strategies, file taxes, and more
Location
Property Details
Parking
- Description: Alley Access, Driveway, Garage Door Opener, Garage Faces Rear, Ground Level, On Street
- Details: Attached
- Garage Spaces: 2
- Spaces Total: 0
Bedroom Information
- # of Bedrooms: 4
Bathroom Information
- # of Baths (Full): 3
- # of Baths (Total): 3.0
Interior Features
- # of Rooms: 7
- # of Stories: 2
Exterior Features
- Exterior Walls Materials: Stucco
- Foundation: Slab
- Roof Type: Gable
- Roof Material: Tile
HOA
- Has HOA: Yes
- Association: Castle Group
- HOA Fee: $1,375/quarterly
Land Information
- Land Use: Residential
- Land Use Subtype: Duplex
Lot Information
- Parcel ID: 0119040023
- Lot Size: 3227 sqft
Property Information
- Property Type: Townhouse
- Year Built: 2004
Tax Information
- Annual Tax: $4,147
Utilities
- Water & Sewer: Public
- Heating: Central
- Cooling: Central Air
Location
- County: Sarasota
Listing Details
Investment Summary
- Monthly Cash Flow
- -$1,294
- Cap Rate
- 2.9%
- Cash-on-Cash Return
- -14.6%
- Debt Coverage Ratio
- 0.47
- Internal Rate of Return (5 years)
- -10.1%
Cash Flow
Net Operating Income (NOI) minus mortgage payments.
Calculation:
NOI - Mortgage Payments
Cap Rate (Market Value)
Capitalization Rate is a rate of return that compares the yearly Net Operating Income (NOI) to the market value.
Calculation:
NOI / Market Value
Cash-on-Cash Return (CoC)
Annual Cash Flow / Cash Invested
Calculation:
Annual cash flow divided by initial cash invested.
Debt Coverage Ratio (DCR)
Net Operating Income (NOI) divided by total debt payments.
Calculation:
NOI / Total Debt Payments
Internal Rate of Return (IRR)
A metric for assessing profitability over time. IRR is the discount rate at which the net present value (NPV) of all future cash flows (positive and negative) from an investment equals zero — including both periodic cash flow (such as rent) and a projected sale at the end of the holding period. It represents the expected annualized return, accounting for income, expenses, and the recovery of capital through a future sale.
Purchase Details
Purchase PriceThe price paid for the property. Purchase price:
| $464,000 |
|---|---|
Amount FinancedThe amount of the purchase financed through a loan. Amount financed:
| -$371,200 |
Down paymentThe initial payment made towards the purchase. Down payment:
| $92,800 |
Closing CostsFees and expenses associated with purchasing a property, typically ranging from 2% to 5% of the home’s purchase price, paid at the end of a home purchase to cover services like lending, title transfer, and taxes. Closing costs:
| $13,920 |
Rehab CostsCosts incurred to repair or improve the property, including: roof, flooring, exterior siding, kitchen, exterior paint, bathrooms, etc. Rehab costs:
| $0 |
Initial Cash InvestedThe total initial cash invested in the property. Calculation:Down payment + Buying costs + Rehab costs Initial cash invested:
| $106,720 |
Square Feet (SQFT)The total square footage of the property. Square feet:
| 1,846 |
Cost Per Square FootCost per square foot of the property. Calculation:Purchase Price / Square Feet Cost per square foot:
| $251 |
Monthly Rent Per Square FootMonthly rent divided by the number of square feet. This ratio helps investors compare rental income efficiency across properties, markets, and unit sizes Calculation:Monthly Rent / Square Feet Monthly rent per square foot:
| $1.52 |
Financing Details
Loan AmountThe total sum of money borrowed from a lender to finance a property purchase. Calculation:Purchase Price - Down Payment
Loan amount:
| $371,200 |
|---|---|
Loan to Value Ratio (LTV)Loan amount divided by the market value of the property. Calculation:Loan Amount / Market Value
Loan to value ratio:
| 80.0% |
Loan TypeThe type of loan (e.g., fixed, adjustable).
Loan type:
| Amortizing |
TermThe loan repayment period in years.
Term:
| 30 years |
Interest RateThe percentage a lender charges on the borrowed amount of a loan, determining the cost of borrowing money.
Interest rate:
| 6.810% |
Principal & Interest (PI)The principal is the portion of the loan payment that reduces the loan balance. The interest is the lender's charge for borrowing money. Calculation:(P * r * (1 + r) ** n) / ((1 + r) ** n - 1) Where:
P = Loan amount (principal)
Principal & interest:
| $2,422 |
Property TaxesAnnual taxes levied by local governments on real estate properties. These taxes fund public services like schools, roads, and emergency services.
Property tax:
| $346 |
InsuranceThe costs for insurance coverage to protect against financial losses due to risks like fire, natural disasters, theft, liability, or tenant-related damages. Calculation:Assumes 7% of gross rental income, unless insurance rates are specified.
Insurance:
| $196 |
Private Mortgage Insurance (PMI)A fee that borrowers pay when they take out a conventional loan with a loan-to-value (LTV) ratio above 80%.
Private mortgage insurance (PMI):
| $0 |
Monthly PaymentThe fixed amount a borrower pays each month to repay a loan. It typically includes principal and interest (P&I) and may also cover property taxes, insurance, HOA fees, and PMI if escrowed. Monthly payment:
| $2,964 |
Operating Income
| % Rent | Monthly | Yearly | |
|---|---|---|---|
Gross RentThe total rental income received from tenants before deducting any expenses. Includes base rent, late fees, pet fees, parking fees, and other recurring charges.
Gross rent:
| $2,800 | $33,600 | |
Vacancy LossExpected loss of rent due to vacancies.
Vacancy loss:
(6%)
| 6% | -$168 | -$2,016 |
Operating IncomeGross rental income minus vacancy loss. Calculation:Gross rent - Vacancy loss
Operating income:
| $2,632 | $31,584 |
Operating Expenses
| % Rent | Monthly | Yearly | |
|---|---|---|---|
Property TaxesAnnual taxes levied by local governments on real estate properties. These taxes fund public services like schools, roads, and emergency services. | 12% | -$346 | -$4,147 |
InsuranceThe costs for insurance coverage to protect against financial losses due to risks like fire, natural disasters, theft, liability, or tenant-related damages. Calculation:Assumes 7% of gross rental income, unless insurance rates are specified. | 7% | -$196 | -$2,352 |
Property ManagementThe costs associated with hiring a property manager to handle the day-to-day operations of a rental property. Includes management fees, leasing fes, eviction fees, etc. Calculation:Assumes 8% of gross rental income. | 8% | -$224 | -$2,688 |
Repairs & MaintenanceOngoing costs for routine upkeep and minor fixes needed to keep a property in good working condition. Calculation:Assumes 5% of gross rental income. Varies by property age and condition. | 5% | -$140 | -$1,680 |
Capital ExpensesLarge, infrequent costs for major improvements or replacements, like a new roof, HVAC system, or appliances. Calculation:Assumes 5% of gross rental income. Varies by property age. | 5% | -$140 | -$1,680 |
HOA FeesRegular dues paid to a Homeowners Association for community maintenance, amenities, and management. Similar fees include: Condo Association Fees, Co-op Maintenance Fees, etc. | 16% | -$458 | -$5,496 |
Operating ExpensesRecurring costs required to maintain and manage a rental property, including property taxes, insurance, maintenance, repairs, utilities (if paid by the owner), property management fees, and other day-to-day expenses. Calculation:Insurance + Property Taxes + Property Management + Repairs & Maintenance + Capital Expenditures + HOA Fees | 54% | -$1,504 | -$18,043 |
Cash Flow
| Monthly | Yearly | |
|---|---|---|
Net Operating Income (NOI)The income generated from a property after deducting all operating expenses but before deducting mortgage payments, taxes, and capital expenditures. Calculation:Gross Operating Income - Operating Expenses
Net operating income:
| $1,128 | $13,536 |
Mortgage PaymentThe fixed amount a borrower pays each month to repay a loan. It typically includes principal and interest (P&I) and may also cover property taxes, insurance, HOA fees, and PMI if escrowed. | -$2,422 | -$29,064 |
Cash FlowNet Operating Income (NOI) minus mortgage payments. Calculation:NOI - Mortgage Payments | $1,294 | $15,528 |