$499,000
Investment Summary
- Monthly Cash Flow
- -$336
- Cap Rate
- 4.9%
- Cash-on-Cash Return
- -3.5%
- Debt Coverage Ratio
- 0.86
- Internal Rate of Return (5 years)
- 0.6%
Cash Flow
Net Operating Income (NOI) minus mortgage payments.
Calculation:
NOI - Mortgage Payments
Cap Rate (Market Value)
Capitalization Rate is a rate of return that compares the yearly Net Operating Income (NOI) to the market value.
Calculation:
NOI / Market Value
Cash-on-Cash Return (CoC)
Annual Cash Flow / Cash Invested
Calculation:
Annual cash flow divided by initial cash invested.
Debt Coverage Ratio (DCR)
Net Operating Income (NOI) divided by total debt payments.
Calculation:
NOI / Total Debt Payments
Internal Rate of Return (IRR)
A metric for assessing profitability over time. IRR is the discount rate at which the net present value (NPV) of all future cash flows (positive and negative) from an investment equals zero — including both periodic cash flow (such as rent) and a projected sale at the end of the holding period. It represents the expected annualized return, accounting for income, expenses, and the recovery of capital through a future sale.
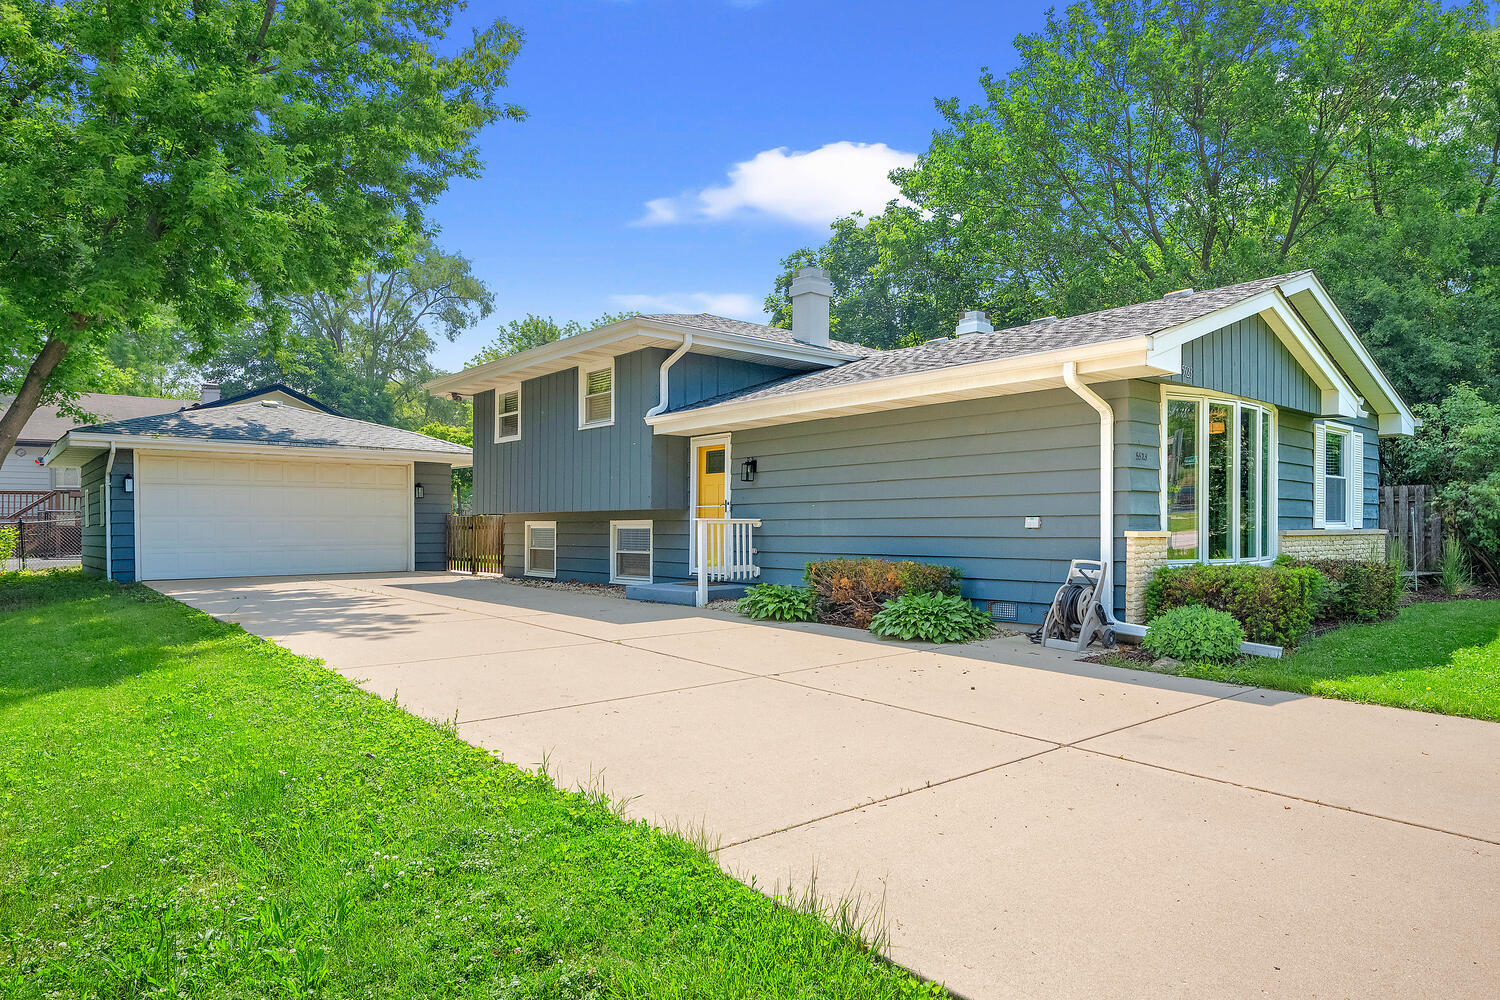
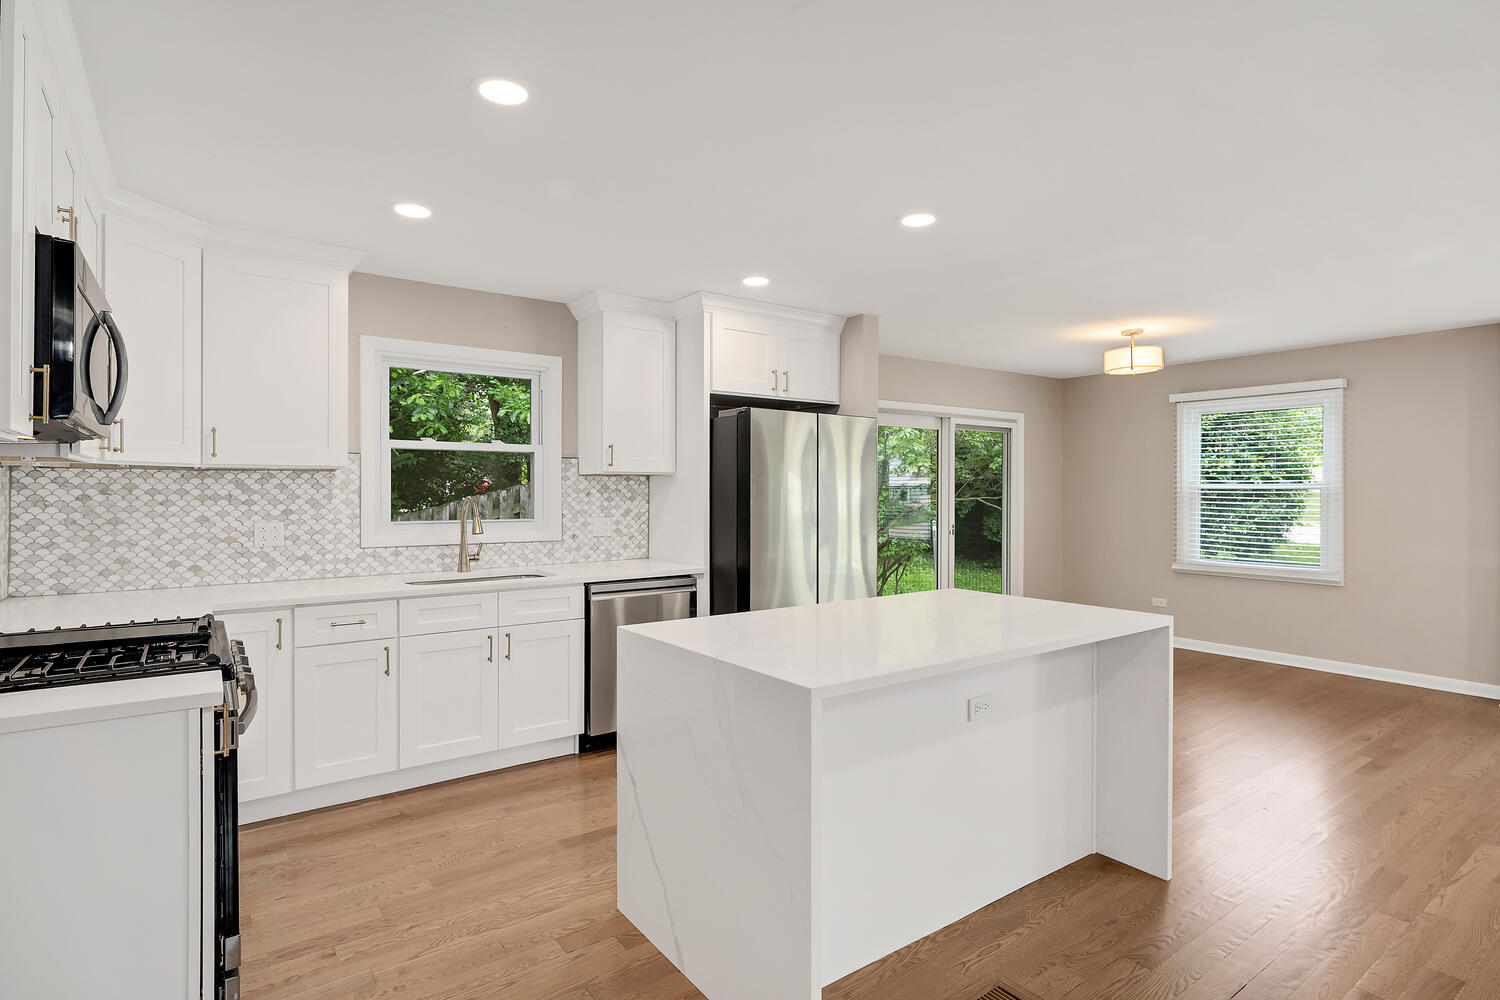
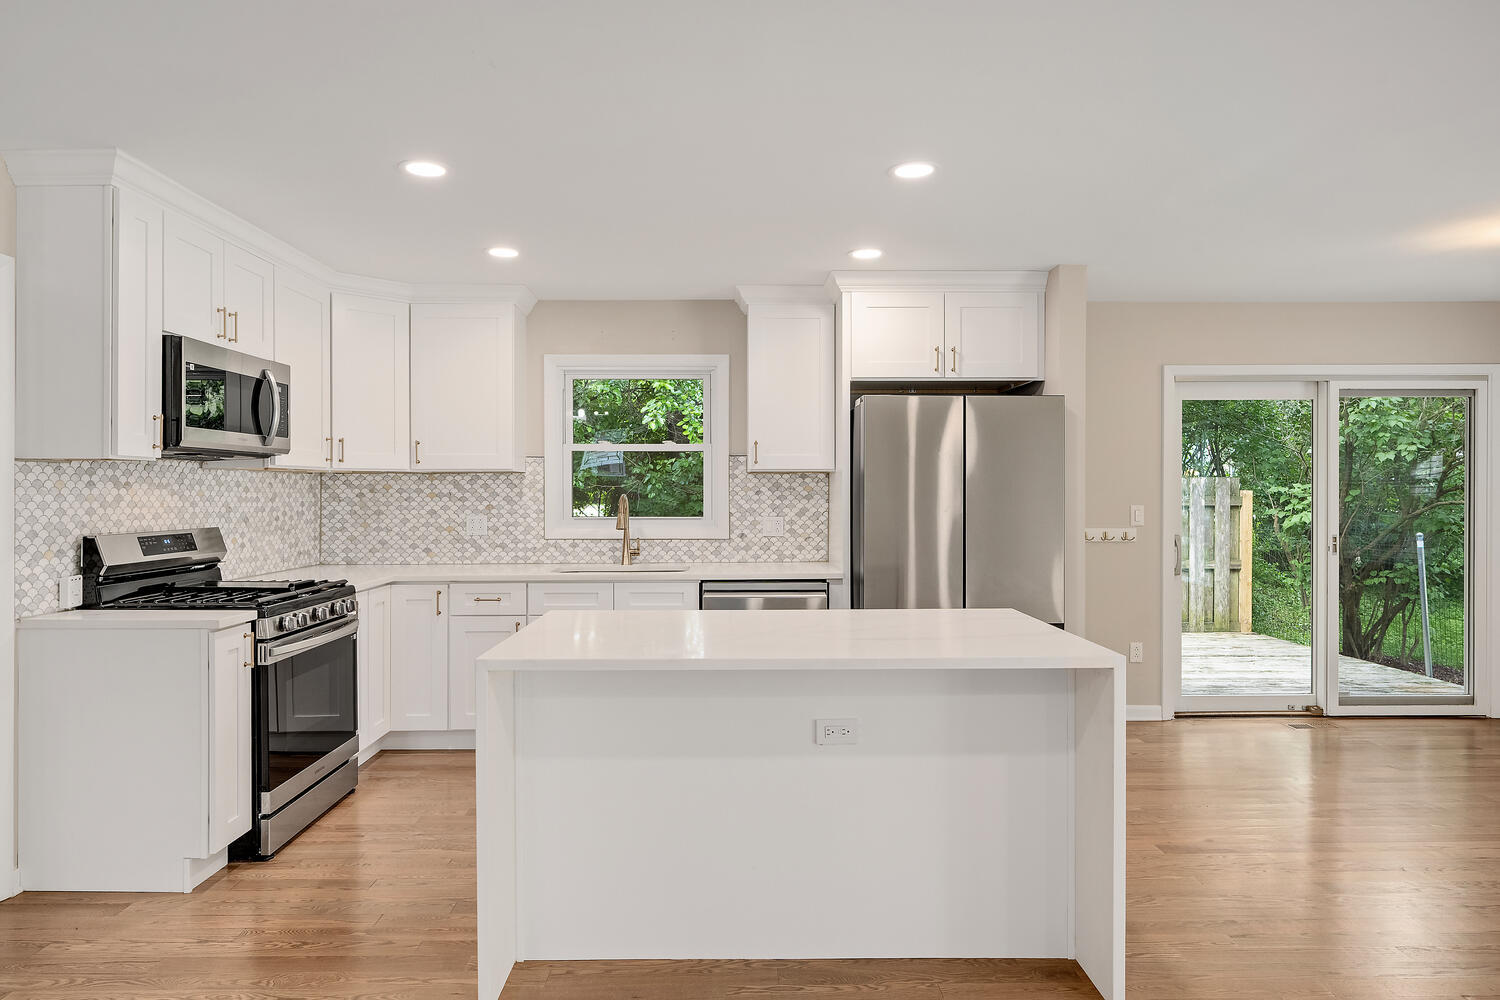
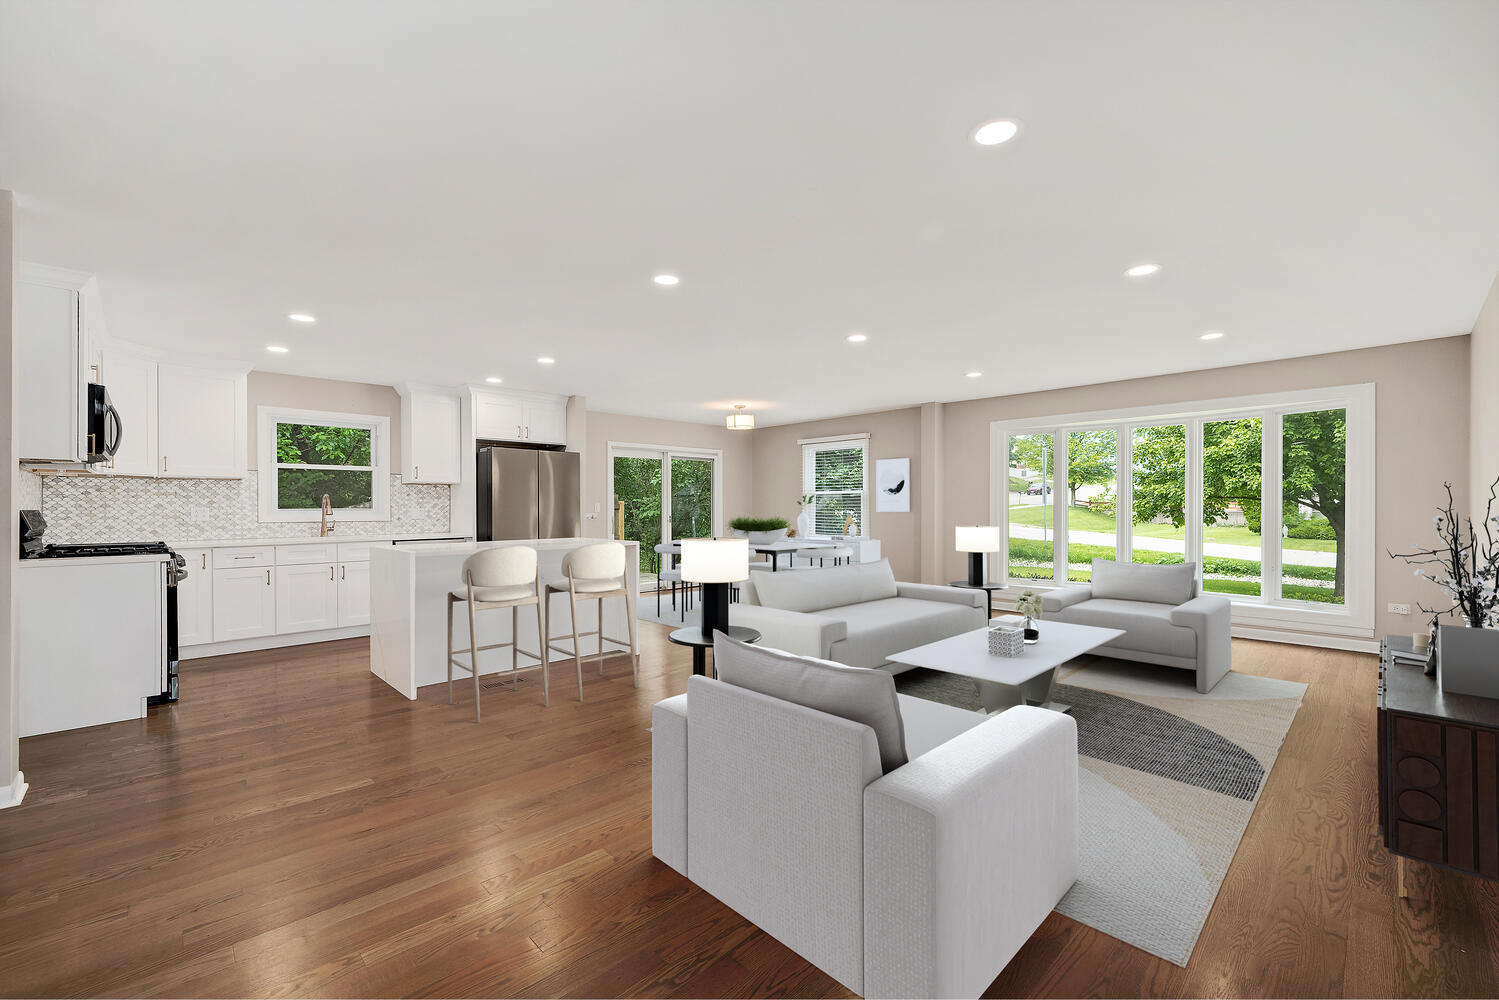
Property Description
2024 Beautifully updated home in award winning Downers Grove North Schools; Hillcrest Elementary, Herrick Middle School, & Downers Grove North High School. Large scale 2024 updates include all new kitchen with new stainless steel appliances including new gas cooktop 5 burner stove, refinished hardwood floors on the main level, newly installed hardwood floors in all 3 bedrooms, both full bathrooms fully renovated, professionally painted, and so many more updates! Home Features 3 Bedrooms, 2 Full Bathrooms, Primary Bedroom with ensuite access to the updated full bathroom. Oversized 2 Car Detached Garage with long concrete driveway and generously sized living areas with bright open floorplan including newly remodeled finished basement with luxury vinyl plank flooring, recreation room/family room, walkup exterior access to the backyard, & newly renovated laundry room with new washer/dryer '24 and sink. First Floor features solid oak hardwood floors with an open floorplan with the chef's kitchen open to the bright family room with bay window. Chef's kitchen includes white shaker cabinets with quartz countertops and island with waterfall edge and seating. New stainless steel appliances and stone accent backsplash. Dining room includes an updated sliding glass door with walkout to the private deck with great space for entertaining or every day enjoyment. Second Floor features the Primary Bedroom with hardwood floors, lookout balcony and ensuite access to the 2nd floor full bathroom with soaking tub, two additional spacious bedrooms both with new hardwood flooring, generously sized closets, and a linen closet. Lower Level includes the newly remodeled basement with Family Room & gas start fireplace, exterior walk-up access from the Family Room to the private backyard, laundry room with new washer/dryer '24, newly renovated full bathroom with shower, mud room, and large newly encapsulated crawl space for additional storage. Oversized 2 car detached garage, Fully fenced spacious yard and updated vinyl windows. Low unincorporated Downers Grove Taxes, public Lake Michigan Water, and public sewer. This is an amazing opportunity in a highly sought after school district!! So many incredible updates; Newly Remodeled Kitchen 2024, Newly Remodeled Bathrooms 2024, All Flooring Newly Remodeled 2024, All new interior doors, closet doors, & front exterior door 2024, New window treatments throughout 2024, New electric panel 2024, Professionally Painted Interior, Furnace & AC Unit 4 Years New, New Roof about 9 Years New, New Gutters with Leaf Guards about 5 Years, Replacement windows about 15 years ago, and more! Welcome Home to Downers Grove Living.
Build Your Team
Quickly find investor-friendly professionals who can help you succeed in real estate investing at any stage of the investing journey.


Agents
Match with investor-friendly agents who can help you find, analyze, and close your next deal


Lenders
Get the best funding…find investor-friendly lenders who specialize in your deal strategy


Property Managers
Transition to passive investing. Find a trusted property management partnership that lasts.


Tax Pros & Accountants
Taxes and financial reporting made easy—find experts to create tax savings strategies, file taxes, and more
Location
Property Details
Parking
- Description: Garage
- Details: Concrete, Garage Door Opener, On Site, Detached, Garage
- Garage Spaces: 2
- Spaces Total: 2
Bedroom Information
- # of Bedrooms: 3
Bathroom Information
- # of Baths (Full): 2
- # of Baths (Total): 2.0
Interior Features
- # of Rooms: 7
- Basement: Yes
- Basement Description: Finished, Crawl Space, Exterior Entry, Storage Space, Walk-Up Access, Partial
- Fireplace: Yes
Exterior Features
- Foundation: Concrete Perimeter
- Roof Material: Asphalt
Land Information
- Land Use: Residential
- Land Use Subtype: Single Family Residential (Assumed)
Lot Information
- Parcel ID: 0813203010
- Lot Size: 0 sqft
Property Information
- Property Type: Single Family Residence
- Year Built: 1971
Tax Information
- Annual Tax: $5,507
Utilities
- Water & Sewer: Public
- Heating: Natural Gas, Forced Air
- Cooling: Ceiling Fan(s), Central Air
Location
- County: Du Page
Listing Details
Investment Summary
- Monthly Cash Flow
- -$336
- Cap Rate
- 4.9%
- Cash-on-Cash Return
- -3.5%
- Debt Coverage Ratio
- 0.86
- Internal Rate of Return (5 years)
- 0.6%
Cash Flow
Net Operating Income (NOI) minus mortgage payments.
Calculation:
NOI - Mortgage Payments
Cap Rate (Market Value)
Capitalization Rate is a rate of return that compares the yearly Net Operating Income (NOI) to the market value.
Calculation:
NOI / Market Value
Cash-on-Cash Return (CoC)
Annual Cash Flow / Cash Invested
Calculation:
Annual cash flow divided by initial cash invested.
Debt Coverage Ratio (DCR)
Net Operating Income (NOI) divided by total debt payments.
Calculation:
NOI / Total Debt Payments
Internal Rate of Return (IRR)
A metric for assessing profitability over time. IRR is the discount rate at which the net present value (NPV) of all future cash flows (positive and negative) from an investment equals zero — including both periodic cash flow (such as rent) and a projected sale at the end of the holding period. It represents the expected annualized return, accounting for income, expenses, and the recovery of capital through a future sale.
Purchase Details
Purchase PriceThe price paid for the property. Purchase price:
| $499,000 |
|---|---|
Amount FinancedThe amount of the purchase financed through a loan. Amount financed:
| -$399,200 |
Down paymentThe initial payment made towards the purchase. Down payment:
| $99,800 |
Closing CostsFees and expenses associated with purchasing a property, typically ranging from 2% to 5% of the home’s purchase price, paid at the end of a home purchase to cover services like lending, title transfer, and taxes. Closing costs:
| $14,970 |
Rehab CostsCosts incurred to repair or improve the property, including: roof, flooring, exterior siding, kitchen, exterior paint, bathrooms, etc. Rehab costs:
| $0 |
Initial Cash InvestedThe total initial cash invested in the property. Calculation:Down payment + Buying costs + Rehab costs Initial cash invested:
| $114,770 |
Square Feet (SQFT)The total square footage of the property. Square feet:
| 2,360 |
Cost Per Square FootCost per square foot of the property. Calculation:Purchase Price / Square Feet Cost per square foot:
| $211 |
Monthly Rent Per Square FootMonthly rent divided by the number of square feet. This ratio helps investors compare rental income efficiency across properties, markets, and unit sizes Calculation:Monthly Rent / Square Feet Monthly rent per square foot:
| $1.53 |
Financing Details
Loan AmountThe total sum of money borrowed from a lender to finance a property purchase. Calculation:Purchase Price - Down Payment
Loan amount:
| $399,200 |
|---|---|
Loan to Value Ratio (LTV)Loan amount divided by the market value of the property. Calculation:Loan Amount / Market Value
Loan to value ratio:
| 80.0% |
Loan TypeThe type of loan (e.g., fixed, adjustable).
Loan type:
| Amortizing |
TermThe loan repayment period in years.
Term:
| 30 years |
Interest RateThe percentage a lender charges on the borrowed amount of a loan, determining the cost of borrowing money.
Interest rate:
| 5.875% |
Principal & Interest (PI)The principal is the portion of the loan payment that reduces the loan balance. The interest is the lender's charge for borrowing money. Calculation:(P * r * (1 + r) ** n) / ((1 + r) ** n - 1) Where:
P = Loan amount (principal)
Principal & interest:
| $2,361 |
Property TaxesAnnual taxes levied by local governments on real estate properties. These taxes fund public services like schools, roads, and emergency services.
Property tax:
| $459 |
InsuranceThe costs for insurance coverage to protect against financial losses due to risks like fire, natural disasters, theft, liability, or tenant-related damages. Calculation:Assumes 7% of gross rental income, unless insurance rates are specified.
Insurance:
| $252 |
Private Mortgage Insurance (PMI)A fee that borrowers pay when they take out a conventional loan with a loan-to-value (LTV) ratio above 80%.
Private mortgage insurance (PMI):
| $0 |
Monthly PaymentThe fixed amount a borrower pays each month to repay a loan. It typically includes principal and interest (P&I) and may also cover property taxes, insurance, HOA fees, and PMI if escrowed. Monthly payment:
| $3,072 |
Operating Income
| % Rent | Monthly | Yearly | |
|---|---|---|---|
Gross RentThe total rental income received from tenants before deducting any expenses. Includes base rent, late fees, pet fees, parking fees, and other recurring charges.
Gross rent:
| $3,600 | $43,200 | |
Vacancy LossExpected loss of rent due to vacancies.
Vacancy loss:
(6%)
| 6% | -$216 | -$2,592 |
Operating IncomeGross rental income minus vacancy loss. Calculation:Gross rent - Vacancy loss
Operating income:
| $3,384 | $40,608 |
Operating Expenses
| % Rent | Monthly | Yearly | |
|---|---|---|---|
Property TaxesAnnual taxes levied by local governments on real estate properties. These taxes fund public services like schools, roads, and emergency services. | 13% | -$459 | -$5,507 |
InsuranceThe costs for insurance coverage to protect against financial losses due to risks like fire, natural disasters, theft, liability, or tenant-related damages. Calculation:Assumes 7% of gross rental income, unless insurance rates are specified. | 7% | -$252 | -$3,024 |
Property ManagementThe costs associated with hiring a property manager to handle the day-to-day operations of a rental property. Includes management fees, leasing fes, eviction fees, etc. Calculation:Assumes 8% of gross rental income. | 8% | -$288 | -$3,456 |
Repairs & MaintenanceOngoing costs for routine upkeep and minor fixes needed to keep a property in good working condition. Calculation:Assumes 5% of gross rental income. Varies by property age and condition. | 5% | -$180 | -$2,160 |
Capital ExpensesLarge, infrequent costs for major improvements or replacements, like a new roof, HVAC system, or appliances. Calculation:Assumes 5% of gross rental income. Varies by property age. | 5% | -$180 | -$2,160 |
HOA FeesRegular dues paid to a Homeowners Association for community maintenance, amenities, and management. Similar fees include: Condo Association Fees, Co-op Maintenance Fees, etc. | n/a | n/a | n/a |
Operating ExpensesRecurring costs required to maintain and manage a rental property, including property taxes, insurance, maintenance, repairs, utilities (if paid by the owner), property management fees, and other day-to-day expenses. Calculation:Insurance + Property Taxes + Property Management + Repairs & Maintenance + Capital Expenditures + HOA Fees | 38% | -$1,359 | -$16,307 |
Cash Flow
| Monthly | Yearly | |
|---|---|---|
Net Operating Income (NOI)The income generated from a property after deducting all operating expenses but before deducting mortgage payments, taxes, and capital expenditures. Calculation:Gross Operating Income - Operating Expenses
Net operating income:
| $2,025 | $24,300 |
Mortgage PaymentThe fixed amount a borrower pays each month to repay a loan. It typically includes principal and interest (P&I) and may also cover property taxes, insurance, HOA fees, and PMI if escrowed. | -$2,361 | -$28,332 |
Cash FlowNet Operating Income (NOI) minus mortgage payments. Calculation:NOI - Mortgage Payments | $336 | $4,032 |