


$1,249,500
Investment Summary
- Monthly Cash Flow
- -$2,663
- Cap Rate
- 3.7%
- Cash-on-Cash Return
- -11.1%
- Debt Coverage Ratio
- 0.59
- Internal Rate of Return (5 years)
- -6.8%
Cash Flow
Net Operating Income (NOI) minus mortgage payments.
Calculation:
NOI - Mortgage Payments
Cap Rate (Market Value)
Capitalization Rate is a rate of return that compares the yearly Net Operating Income (NOI) to the market value.
Calculation:
NOI / Market Value
Cash-on-Cash Return (CoC)
Annual Cash Flow / Cash Invested
Calculation:
Annual cash flow divided by initial cash invested.
Debt Coverage Ratio (DCR)
Net Operating Income (NOI) divided by total debt payments.
Calculation:
NOI / Total Debt Payments
Internal Rate of Return (IRR)
A metric for assessing profitability over time. IRR is the discount rate at which the net present value (NPV) of all future cash flows (positive and negative) from an investment equals zero — including both periodic cash flow (such as rent) and a projected sale at the end of the holding period. It represents the expected annualized return, accounting for income, expenses, and the recovery of capital through a future sale.
Property Description
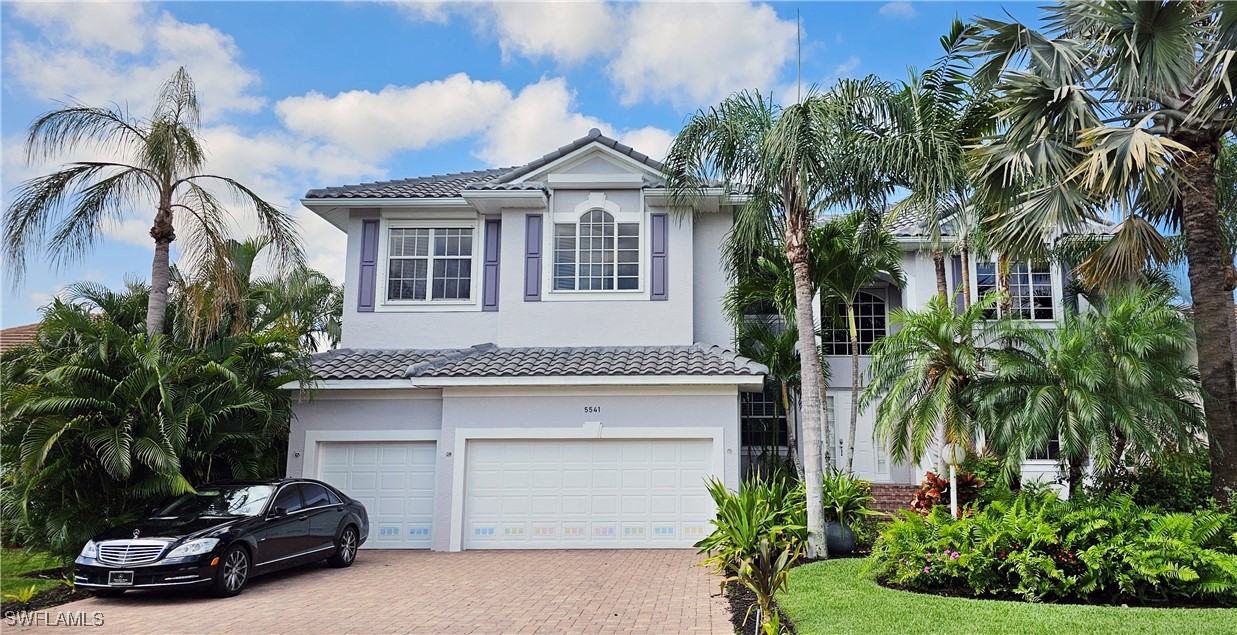
Stunning 5+ Bedroom Estate in Private Gated Waterfront Community – Direct Access, Gourmet Kitchen, Sunset Views & Motivated Sellers! Welcome to your Southwest Florida dream estate! This exceptional property offers 5 bedrooms, 5 full bathrooms, a private office/den, and a massive bonus room that can easily serve as a 6th bedroom, movie theater, game room, or guest suite—complete with its own closet and full bath. Step into refined elegance with a formal dining room and an open-concept living area that blends seamlessly with the outdoors. In the kitchen and dining area, two sets of double French doors open to the expansive screened-in lanai, creating the perfect indoor-outdoor living experience. The chef’s kitchen is fully equipped and designed to impress, featuring: High-end stainless steel appliances Double ovens Double-faucet sink Wine cooler Beautiful quartz countertops Large center island Very large walk-in pantry The luxurious master suite offers peace and privacy, complete with a spacious sitting area and a spa-like bathroom featuring a gorgeous walk-in shower and upscale finishes. Step outside and enjoy resort-style living with a screened lanai, sparkling pool, and jacuzzi, ideal for both relaxing and entertaining. The highly desirable Southwest exposure provides unforgettable sunset views every evening. Key Features Include: Tile roof (less than 2 years old) Whole-house backup generator with a large buried propane tank Hurricane roll-down shutters Three-car garage Direct access (Mantanzas Pass bridge 65 Foot) (The New big Carlos Pass Bridge will have 60 feet will be complete in 2026) Due to the depth of the canal, there may be keel restrictions for sailboats, depending on the draft depth. you should verify whether your sailboat can navigate the canal before purchase. Private dock with a 10,000 lb boat lift and spacious sitting deck Set within one of the only gated communities offering Gulf access from your backyard and a residents-only private freshwater lake for jet skiing, boating, fishing, and sailing, this home delivers the ultimate Florida lifestyle. Community Amenities: Private sandy beach Tennis courts Pickleball Playground area Jogging and walking trails Private boat ramp & secure boat storage The community is well-established and meticulously maintained, with no monthly HOA fees—just a low annual fee of $4,000. Located near Southwest Florida International Airport, Naples, fine dining, shopping, and world-class beaches—this home is perfect as a full-time residence, vacation getaway, or multi-generational retreat. The owners are very motivated for a quick sale—and someone is going to walk away with an incredible deal on one of Southwest Florida’s most spectacular waterfront properties. Don’t wait—schedule your private showing today!
Build Your Team
Quickly find investor-friendly professionals who can help you succeed in real estate investing at any stage of the investing journey.


Agents
Match with investor-friendly agents who can help you find, analyze, and close your next deal


Lenders
Get the best funding…find investor-friendly lenders who specialize in your deal strategy


Property Managers
Transition to passive investing. Find a trusted property management partnership that lasts.


Tax Pros & Accountants
Taxes and financial reporting made easy—find experts to create tax savings strategies, file taxes, and more
Location
Property Details
Parking
- Description: Attached, Driveway, Garage, Paved, TwoSpaces, GarageDoorOpener, RVAccessParking
- Details: Attached, Covered, Driveway, Garage, Paved, Garage Door Opener
- Garage Spaces: 3
- Spaces Total: 0
Bedroom Information
- # of Bedrooms: 5
Bathroom Information
- # of Baths (Full): 5
- # of Baths (Partial): 1
- # of Baths (Total): 5.0
Interior Features
- # of Rooms: 11
- # of Stories: 2
Exterior Features
- Exterior Walls Materials: Stucco
- Roof Type: IRR/Cathedral
- Roof Material: Tile
- Pool: Yes
- Pool Community: Yes
HOA
- Has HOA: Yes
- HOA Fee: $4,000/annually
Land Information
- Land Use: Residential
- Land Use Subtype: Single Family Residential
Lot Information
- Parcel ID: 0746250500000.1100
- Lot Size: 0 sqft
Property Information
- Property Type: Single Family Residence
- Style: Two Story
- Year Built: 2003
Tax Information
- Annual Tax: $9,295
Utilities
- Water & Sewer: Public
- Heating: Central, Electric
- Cooling: Central Air, Ceiling Fan(s), Electric, Heat Pump, Whole House Fan
Location
- County: Lee
Listing Details
Investment Summary
- Monthly Cash Flow
- -$2,663
- Cap Rate
- 3.7%
- Cash-on-Cash Return
- -11.1%
- Debt Coverage Ratio
- 0.59
- Internal Rate of Return (5 years)
- -6.8%
Cash Flow
Net Operating Income (NOI) minus mortgage payments.
Calculation:
NOI - Mortgage Payments
Cap Rate (Market Value)
Capitalization Rate is a rate of return that compares the yearly Net Operating Income (NOI) to the market value.
Calculation:
NOI / Market Value
Cash-on-Cash Return (CoC)
Annual Cash Flow / Cash Invested
Calculation:
Annual cash flow divided by initial cash invested.
Debt Coverage Ratio (DCR)
Net Operating Income (NOI) divided by total debt payments.
Calculation:
NOI / Total Debt Payments
Internal Rate of Return (IRR)
A metric for assessing profitability over time. IRR is the discount rate at which the net present value (NPV) of all future cash flows (positive and negative) from an investment equals zero — including both periodic cash flow (such as rent) and a projected sale at the end of the holding period. It represents the expected annualized return, accounting for income, expenses, and the recovery of capital through a future sale.
Purchase Details
Purchase PriceThe price paid for the property. Purchase price:
| $1,249,500 |
|---|---|
Amount FinancedThe amount of the purchase financed through a loan. Amount financed:
| -$999,600 |
Down paymentThe initial payment made towards the purchase. Down payment:
| $249,900 |
Closing CostsFees and expenses associated with purchasing a property, typically ranging from 2% to 5% of the home’s purchase price, paid at the end of a home purchase to cover services like lending, title transfer, and taxes. Closing costs:
| $37,485 |
Rehab CostsCosts incurred to repair or improve the property, including: roof, flooring, exterior siding, kitchen, exterior paint, bathrooms, etc. Rehab costs:
| $0 |
Initial Cash InvestedThe total initial cash invested in the property. Calculation:Down payment + Buying costs + Rehab costs Initial cash invested:
| $287,385 |
Square Feet (SQFT)The total square footage of the property. Square feet:
| 4,093 |
Cost Per Square FootCost per square foot of the property. Calculation:Purchase Price / Square Feet Cost per square foot:
| $305 |
Monthly Rent Per Square FootMonthly rent divided by the number of square feet. This ratio helps investors compare rental income efficiency across properties, markets, and unit sizes Calculation:Monthly Rent / Square Feet Monthly rent per square foot:
| $1.76 |
Financing Details
Loan AmountThe total sum of money borrowed from a lender to finance a property purchase. Calculation:Purchase Price - Down Payment
Loan amount:
| $999,600 |
|---|---|
Loan to Value Ratio (LTV)Loan amount divided by the market value of the property. Calculation:Loan Amount / Market Value
Loan to value ratio:
| 80.0% |
Loan TypeThe type of loan (e.g., fixed, adjustable).
Loan type:
| Amortizing |
TermThe loan repayment period in years.
Term:
| 30 years |
Interest RateThe percentage a lender charges on the borrowed amount of a loan, determining the cost of borrowing money.
Interest rate:
| 6.810% |
Principal & Interest (PI)The principal is the portion of the loan payment that reduces the loan balance. The interest is the lender's charge for borrowing money. Calculation:(P * r * (1 + r) ** n) / ((1 + r) ** n - 1) Where:
P = Loan amount (principal)
Principal & interest:
| $6,523 |
Property TaxesAnnual taxes levied by local governments on real estate properties. These taxes fund public services like schools, roads, and emergency services.
Property tax:
| $775 |
InsuranceThe costs for insurance coverage to protect against financial losses due to risks like fire, natural disasters, theft, liability, or tenant-related damages. Calculation:Assumes 7% of gross rental income, unless insurance rates are specified.
Insurance:
| $504 |
Private Mortgage Insurance (PMI)A fee that borrowers pay when they take out a conventional loan with a loan-to-value (LTV) ratio above 80%.
Private mortgage insurance (PMI):
| $0 |
Monthly PaymentThe fixed amount a borrower pays each month to repay a loan. It typically includes principal and interest (P&I) and may also cover property taxes, insurance, HOA fees, and PMI if escrowed. Monthly payment:
| $7,802 |
Operating Income
| % Rent | Monthly | Yearly | |
|---|---|---|---|
Gross RentThe total rental income received from tenants before deducting any expenses. Includes base rent, late fees, pet fees, parking fees, and other recurring charges.
Gross rent:
| $7,200 | $86,400 | |
Vacancy LossExpected loss of rent due to vacancies.
Vacancy loss:
(6%)
| 6% | -$432 | -$5,184 |
Operating IncomeGross rental income minus vacancy loss. Calculation:Gross rent - Vacancy loss
Operating income:
| $6,768 | $81,216 |
Operating Expenses
| % Rent | Monthly | Yearly | |
|---|---|---|---|
Property TaxesAnnual taxes levied by local governments on real estate properties. These taxes fund public services like schools, roads, and emergency services. | 11% | -$775 | -$9,295 |
InsuranceThe costs for insurance coverage to protect against financial losses due to risks like fire, natural disasters, theft, liability, or tenant-related damages. Calculation:Assumes 7% of gross rental income, unless insurance rates are specified. | 7% | -$504 | -$6,048 |
Property ManagementThe costs associated with hiring a property manager to handle the day-to-day operations of a rental property. Includes management fees, leasing fes, eviction fees, etc. Calculation:Assumes 8% of gross rental income. | 8% | -$576 | -$6,912 |
Repairs & MaintenanceOngoing costs for routine upkeep and minor fixes needed to keep a property in good working condition. Calculation:Assumes 5% of gross rental income. Varies by property age and condition. | 5% | -$360 | -$4,320 |
Capital ExpensesLarge, infrequent costs for major improvements or replacements, like a new roof, HVAC system, or appliances. Calculation:Assumes 5% of gross rental income. Varies by property age. | 5% | -$360 | -$4,320 |
HOA FeesRegular dues paid to a Homeowners Association for community maintenance, amenities, and management. Similar fees include: Condo Association Fees, Co-op Maintenance Fees, etc. | 5% | -$333 | -$3,996 |
Operating ExpensesRecurring costs required to maintain and manage a rental property, including property taxes, insurance, maintenance, repairs, utilities (if paid by the owner), property management fees, and other day-to-day expenses. Calculation:Insurance + Property Taxes + Property Management + Repairs & Maintenance + Capital Expenditures + HOA Fees | 40% | -$2,908 | -$34,891 |
Cash Flow
| Monthly | Yearly | |
|---|---|---|
Net Operating Income (NOI)The income generated from a property after deducting all operating expenses but before deducting mortgage payments, taxes, and capital expenditures. Calculation:Gross Operating Income - Operating Expenses
Net operating income:
| $3,860 | $46,320 |
Mortgage PaymentThe fixed amount a borrower pays each month to repay a loan. It typically includes principal and interest (P&I) and may also cover property taxes, insurance, HOA fees, and PMI if escrowed. | -$6,523 | -$78,276 |
Cash FlowNet Operating Income (NOI) minus mortgage payments. Calculation:NOI - Mortgage Payments | $2,663 | $31,956 |