$589,000
Investment Summary
- Monthly Cash Flow
- -$1,322
- Cap Rate
- 3.5%
- Cash-on-Cash Return
- -11.7%
- Debt Coverage Ratio
- 0.56
- Internal Rate of Return (5 years)
- -7.3%
Cash Flow
Net Operating Income (NOI) minus mortgage payments.
Calculation:
NOI - Mortgage Payments
Cap Rate (Market Value)
Capitalization Rate is a rate of return that compares the yearly Net Operating Income (NOI) to the market value.
Calculation:
NOI / Market Value
Cash-on-Cash Return (CoC)
Annual Cash Flow / Cash Invested
Calculation:
Annual cash flow divided by initial cash invested.
Debt Coverage Ratio (DCR)
Net Operating Income (NOI) divided by total debt payments.
Calculation:
NOI / Total Debt Payments
Internal Rate of Return (IRR)
A metric for assessing profitability over time. IRR is the discount rate at which the net present value (NPV) of all future cash flows (positive and negative) from an investment equals zero — including both periodic cash flow (such as rent) and a projected sale at the end of the holding period. It represents the expected annualized return, accounting for income, expenses, and the recovery of capital through a future sale.
Property Description
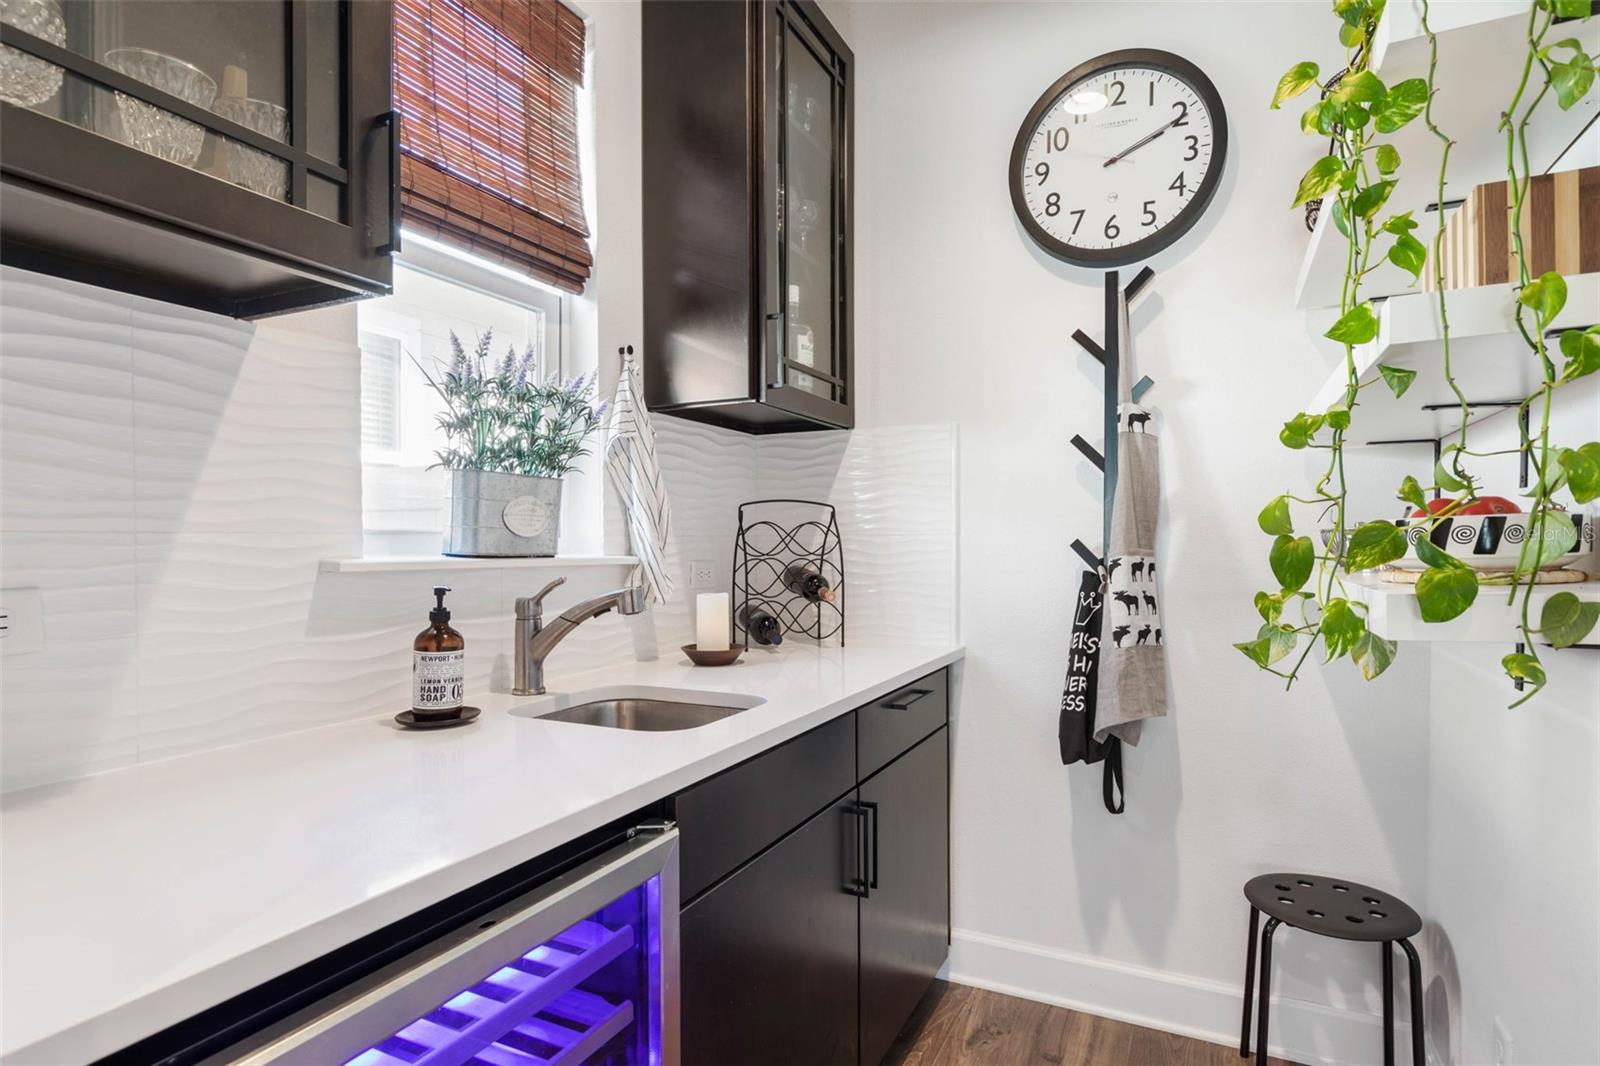
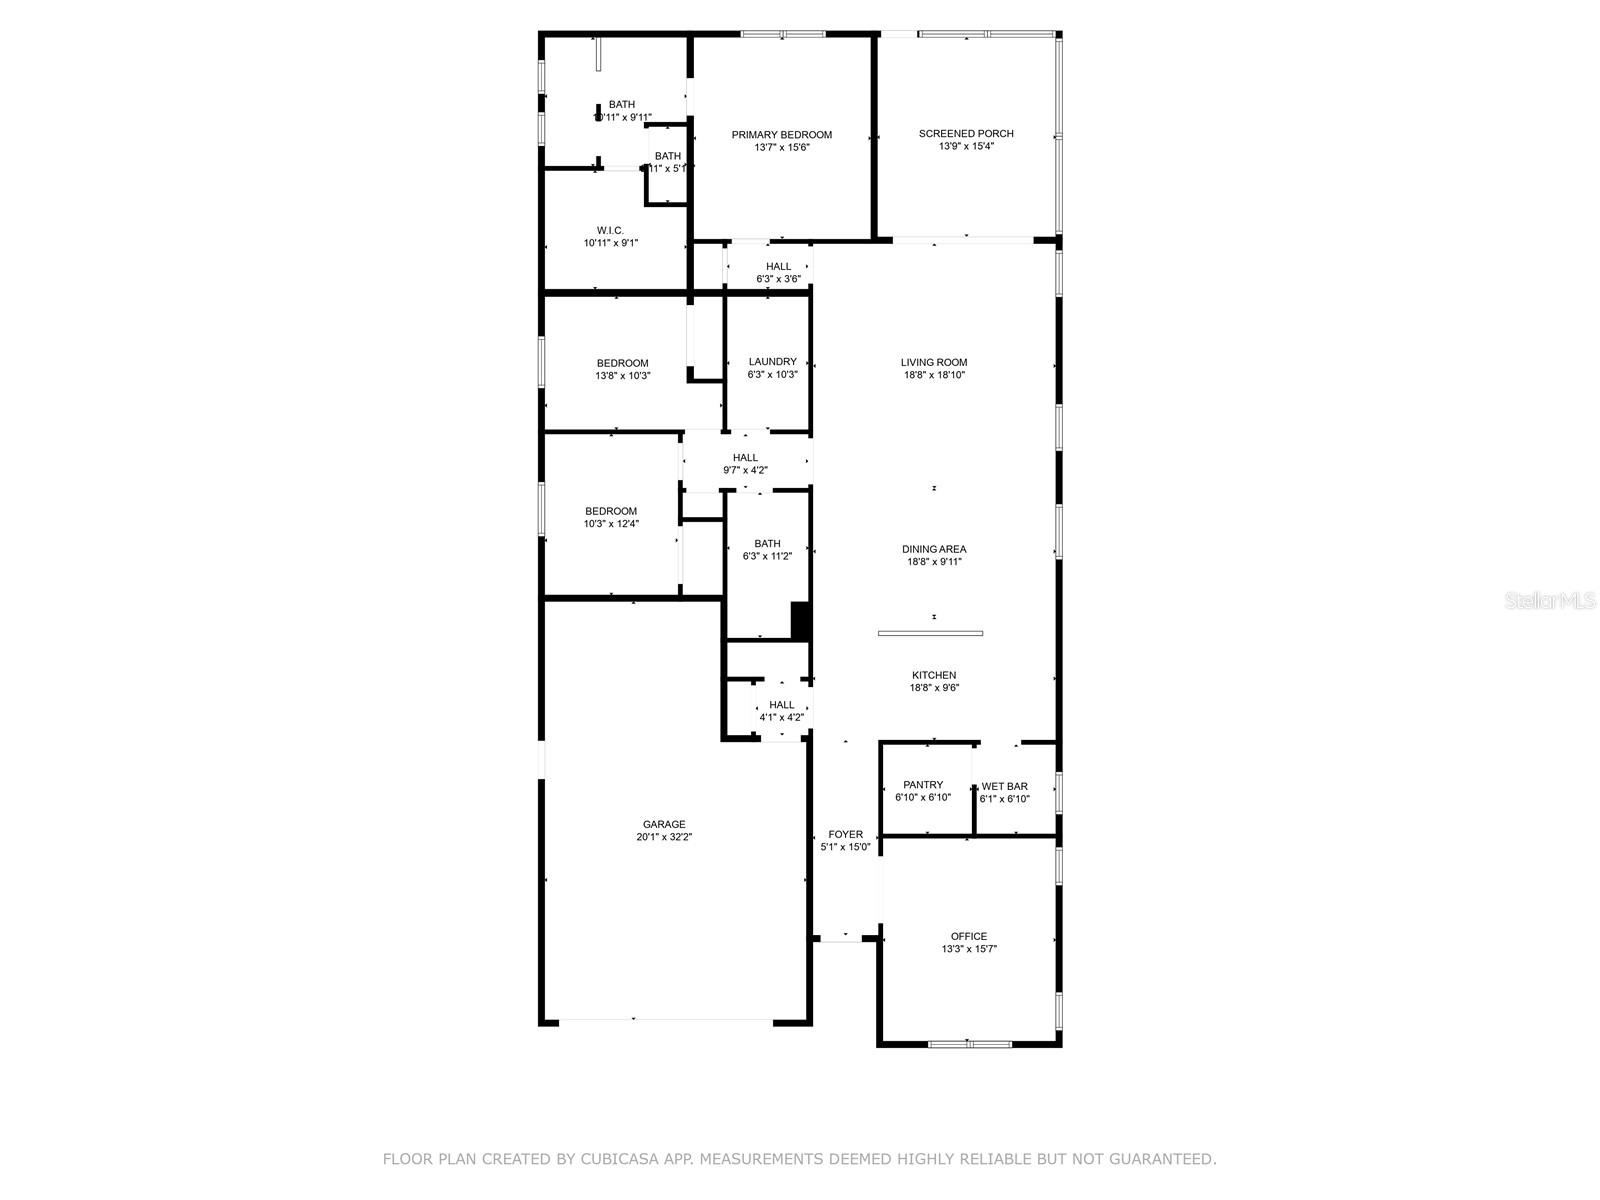
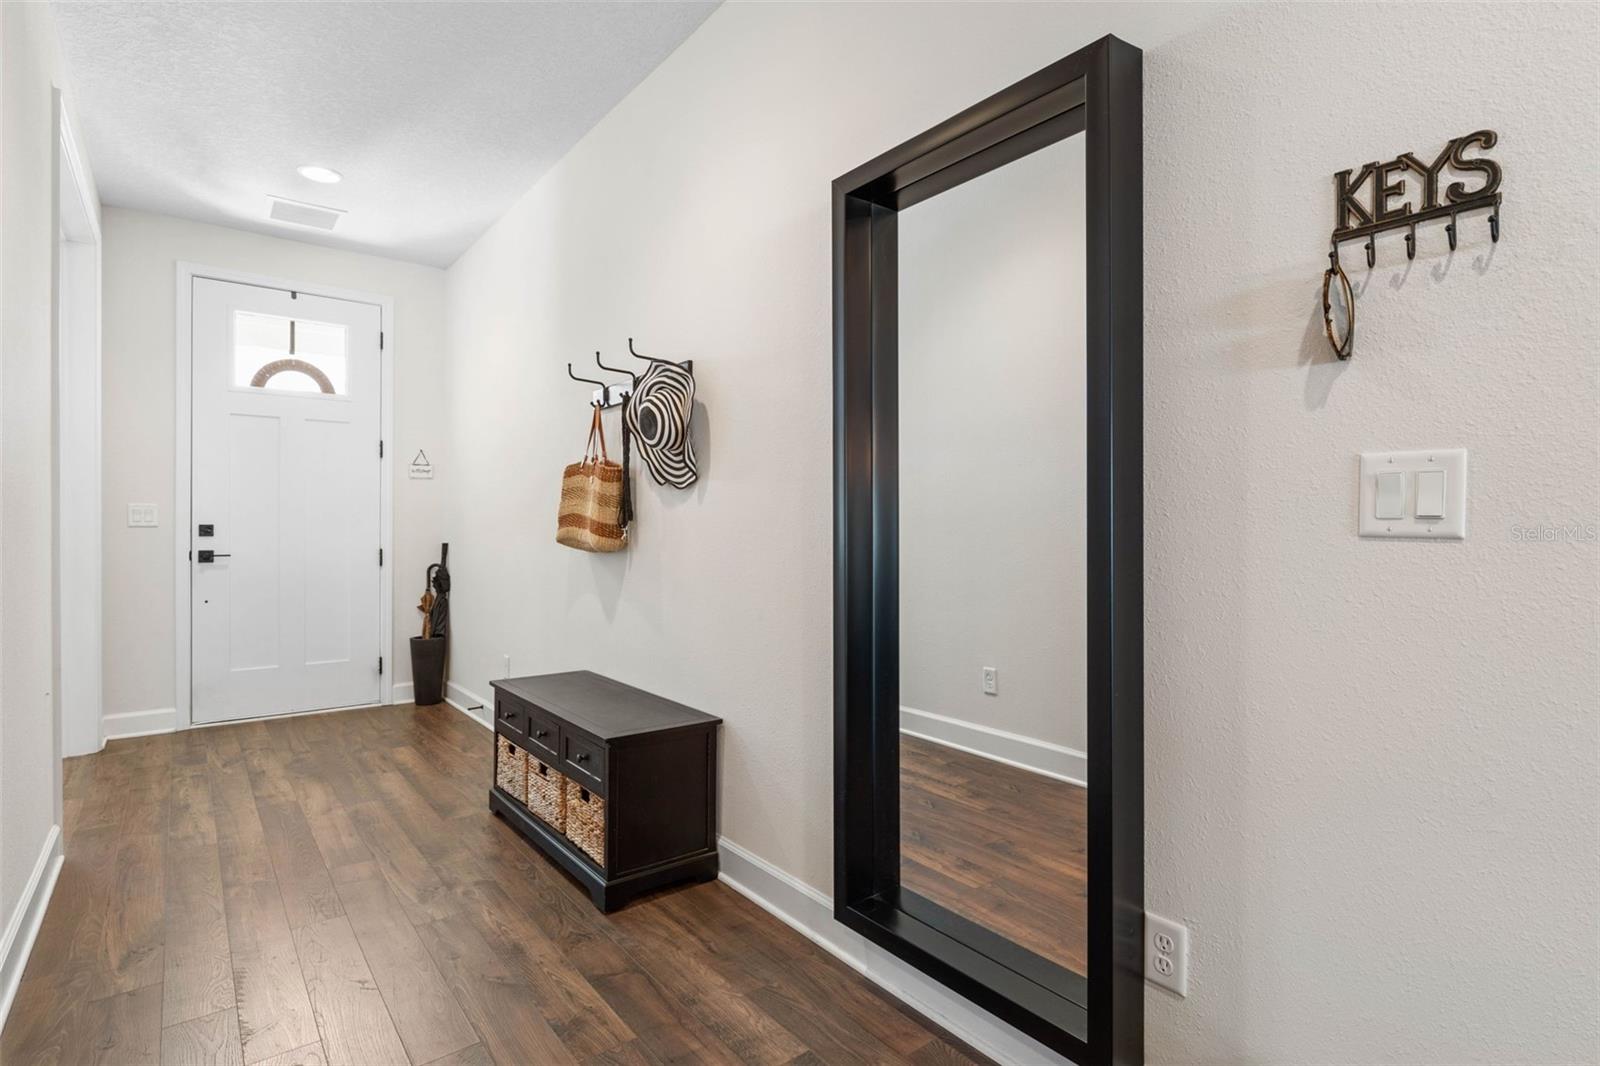
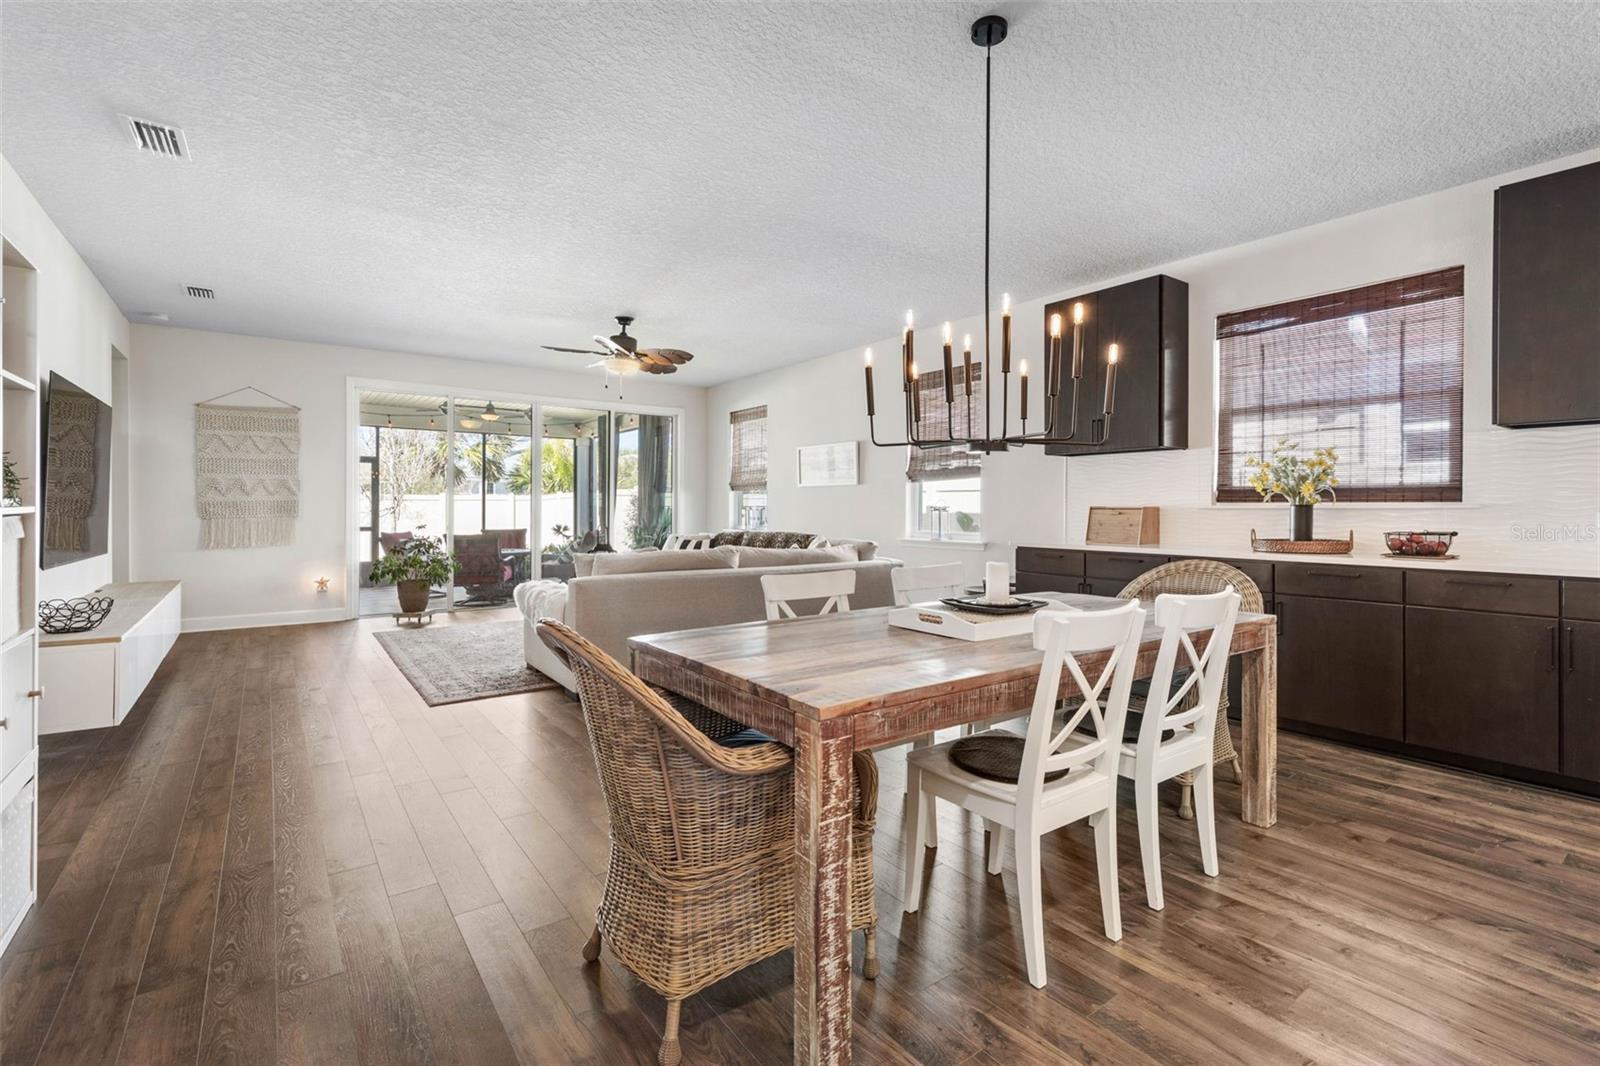
Seller has completed the process to have the flood zone changed to Flood Zone X. This means FLOOD INSURANCE IS NOT REQUIRED. THIS HOME QUALIFIES FOR HUGE PREFERRED LENDER INCENTIVES~CALL FOR MORE DETAILS. Unique community with OCEAN FRONT and INTRACOASTAL amenities. Coastal Elegance with Luxury Upgrades – A Dream Home by the Ocean Experience the ultimate coastal lifestyle in this beautifully designed 3-bedroom, 2-bathroom home with an office, located in a unique seaside community where ocean waves and salty breezes create the perfect backdrop for everyday living. Immerse yourself in sunrises on the ocean and sunsets on the Intracoastal! Enjoy exclusive access to incredible community amenities, including an oceanfront heated pool with private beach access to a dog friendly beach, a dock on the Intracoastal Waterway—perfect for kayaking, fishing, or simply soaking in breathtaking sunsets while watching dolphins play and boaters glide by. Additional amenities include a second heated pool, recently renovated tennis courts, pickleball, basketball, shuffleboard, volleyball, horseshoes, ping pong, a private wooded walking trail, and a dock clubhouse with kayak storage. Spanning 2,216 square feet, this custom-designed home is filled with upgrades and high-end finishes throughout. Inside, the open floor plan is both inviting and functional, highlighted by custom 8-foot doors with sleek matte black hardware. The gourmet kitchen is a chef’s dream, featuring maple wood cabinets with pull-outs, a striking artistic backsplash, quartz countertops, and premium black stainless GE Café smart appliances. A well-appointed butler’s pantry complemented by an expansive walk-in pantry for ample storage and organization. The main bedroom suite is a serene retreat, complete with an extra-large walk-in closet and a designer en-suite bathroom featuring a large shower with a rain head and bench. The spacious guest bedrooms provide comfort and privacy for family or visitors, while the office is perfect for remote working or a 4th bedroom. Additional highlights include a large laundry room, extensive storage solutions, and a spacious lanai, ideal for relaxing or entertaining, overlooking a fenced-in yard with plenty of room for a pool. Lush landscaping enhances the curb appeal, creating a serene outdoor oasis. The oversized 2 car garage has an EV charger and a storage area perfect for a workshop or golf cart parking. Nestled along the picturesque A1A Scenic Highway, this home is just minutes from Washington Oaks State Park, offering breathtaking natural beauty. A short drive brings you to historic St. Augustine, where you can explore its rich history, dining, and entertainment. Additionally, the Matanzas Inlet is just moments away—a popular spot for boaters, swimmers, and surfers to enjoy the coastal waters. Don’t miss your chance to own a piece of paradise—schedule your private tour today! FURNITURE ALONG WITH MOST DÉCOR AND CONTENTS AVAILABLE.
Build Your Team
Quickly find investor-friendly professionals who can help you succeed in real estate investing at any stage of the investing journey.


Agents
Match with investor-friendly agents who can help you find, analyze, and close your next deal


Lenders
Get the best funding…find investor-friendly lenders who specialize in your deal strategy


Property Managers
Transition to passive investing. Find a trusted property management partnership that lasts.


Tax Pros & Accountants
Taxes and financial reporting made easy—find experts to create tax savings strategies, file taxes, and more
Location
Property Details
Parking
- Details: Electric Vehicle Charging Station(s), Attached
- Garage Spaces: 2
- Spaces Total: 0
Bedroom Information
- # of Bedrooms: 3
Bathroom Information
- # of Baths (Full): 2
- # of Baths (Total): 2.0
Interior Features
- # of Rooms: 8
- # of Stories: 1
Exterior Features
- Exterior Walls Materials: Fiber cement siding (Hardi-board/Hardi-plank
- Foundation: Slab
- Roof Type: Gable or Hip
- Roof Material: Shingle
HOA
- Has HOA: Yes
- Association: Maria Accoo
- HOA Fee: $145/monthly
Land Information
- Land Use: Residential
- Land Use Subtype: Single Family Residential
Lot Information
- Parcel ID: 3710313785000000130
- Lot Size: 6665 sqft
Property Information
- Property Type: Single Family Residence
- Style: Coastal
- Year Built: 2021
Tax Information
- Annual Tax: $6,895
Utilities
- Water & Sewer: None
- Heating: Central, Electric, Heat Pump
- Cooling: Central Air
Location
- County: Flagler
Listing Details
Investment Summary
- Monthly Cash Flow
- -$1,322
- Cap Rate
- 3.5%
- Cash-on-Cash Return
- -11.7%
- Debt Coverage Ratio
- 0.56
- Internal Rate of Return (5 years)
- -7.3%
Cash Flow
Net Operating Income (NOI) minus mortgage payments.
Calculation:
NOI - Mortgage Payments
Cap Rate (Market Value)
Capitalization Rate is a rate of return that compares the yearly Net Operating Income (NOI) to the market value.
Calculation:
NOI / Market Value
Cash-on-Cash Return (CoC)
Annual Cash Flow / Cash Invested
Calculation:
Annual cash flow divided by initial cash invested.
Debt Coverage Ratio (DCR)
Net Operating Income (NOI) divided by total debt payments.
Calculation:
NOI / Total Debt Payments
Internal Rate of Return (IRR)
A metric for assessing profitability over time. IRR is the discount rate at which the net present value (NPV) of all future cash flows (positive and negative) from an investment equals zero — including both periodic cash flow (such as rent) and a projected sale at the end of the holding period. It represents the expected annualized return, accounting for income, expenses, and the recovery of capital through a future sale.
Purchase Details
Purchase PriceThe price paid for the property. Purchase price:
| $589,000 |
|---|---|
Amount FinancedThe amount of the purchase financed through a loan. Amount financed:
| -$471,200 |
Down paymentThe initial payment made towards the purchase. Down payment:
| $117,800 |
Closing CostsFees and expenses associated with purchasing a property, typically ranging from 2% to 5% of the home’s purchase price, paid at the end of a home purchase to cover services like lending, title transfer, and taxes. Closing costs:
| $17,670 |
Rehab CostsCosts incurred to repair or improve the property, including: roof, flooring, exterior siding, kitchen, exterior paint, bathrooms, etc. Rehab costs:
| $0 |
Initial Cash InvestedThe total initial cash invested in the property. Calculation:Down payment + Buying costs + Rehab costs Initial cash invested:
| $135,470 |
Square Feet (SQFT)The total square footage of the property. Square feet:
| 2,216 |
Cost Per Square FootCost per square foot of the property. Calculation:Purchase Price / Square Feet Cost per square foot:
| $266 |
Monthly Rent Per Square FootMonthly rent divided by the number of square feet. This ratio helps investors compare rental income efficiency across properties, markets, and unit sizes Calculation:Monthly Rent / Square Feet Monthly rent per square foot:
| $1.58 |
Financing Details
Loan AmountThe total sum of money borrowed from a lender to finance a property purchase. Calculation:Purchase Price - Down Payment
Loan amount:
| $471,200 |
|---|---|
Loan to Value Ratio (LTV)Loan amount divided by the market value of the property. Calculation:Loan Amount / Market Value
Loan to value ratio:
| 80.0% |
Loan TypeThe type of loan (e.g., fixed, adjustable).
Loan type:
| Amortizing |
TermThe loan repayment period in years.
Term:
| 30 years |
Interest RateThe percentage a lender charges on the borrowed amount of a loan, determining the cost of borrowing money.
Interest rate:
| 6.625% |
Principal & Interest (PI)The principal is the portion of the loan payment that reduces the loan balance. The interest is the lender's charge for borrowing money. Calculation:(P * r * (1 + r) ** n) / ((1 + r) ** n - 1) Where:
P = Loan amount (principal)
Principal & interest:
| $3,017 |
Property TaxesAnnual taxes levied by local governments on real estate properties. These taxes fund public services like schools, roads, and emergency services.
Property tax:
| $575 |
InsuranceThe costs for insurance coverage to protect against financial losses due to risks like fire, natural disasters, theft, liability, or tenant-related damages. Calculation:Assumes 7% of gross rental income, unless insurance rates are specified.
Insurance:
| $245 |
Private Mortgage Insurance (PMI)A fee that borrowers pay when they take out a conventional loan with a loan-to-value (LTV) ratio above 80%.
Private mortgage insurance (PMI):
| $0 |
Monthly PaymentThe fixed amount a borrower pays each month to repay a loan. It typically includes principal and interest (P&I) and may also cover property taxes, insurance, HOA fees, and PMI if escrowed. Monthly payment:
| $3,837 |
Operating Income
| % Rent | Monthly | Yearly | |
|---|---|---|---|
Gross RentThe total rental income received from tenants before deducting any expenses. Includes base rent, late fees, pet fees, parking fees, and other recurring charges.
Gross rent:
| $3,500 | $42,000 | |
Vacancy LossExpected loss of rent due to vacancies.
Vacancy loss:
(6%)
| 6% | -$210 | -$2,520 |
Operating IncomeGross rental income minus vacancy loss. Calculation:Gross rent - Vacancy loss
Operating income:
| $3,290 | $39,480 |
Operating Expenses
| % Rent | Monthly | Yearly | |
|---|---|---|---|
Property TaxesAnnual taxes levied by local governments on real estate properties. These taxes fund public services like schools, roads, and emergency services. | 16% | -$575 | -$6,895 |
InsuranceThe costs for insurance coverage to protect against financial losses due to risks like fire, natural disasters, theft, liability, or tenant-related damages. Calculation:Assumes 7% of gross rental income, unless insurance rates are specified. | 7% | -$245 | -$2,940 |
Property ManagementThe costs associated with hiring a property manager to handle the day-to-day operations of a rental property. Includes management fees, leasing fes, eviction fees, etc. Calculation:Assumes 8% of gross rental income. | 8% | -$280 | -$3,360 |
Repairs & MaintenanceOngoing costs for routine upkeep and minor fixes needed to keep a property in good working condition. Calculation:Assumes 5% of gross rental income. Varies by property age and condition. | 5% | -$175 | -$2,100 |
Capital ExpensesLarge, infrequent costs for major improvements or replacements, like a new roof, HVAC system, or appliances. Calculation:Assumes 5% of gross rental income. Varies by property age. | 5% | -$175 | -$2,100 |
HOA FeesRegular dues paid to a Homeowners Association for community maintenance, amenities, and management. Similar fees include: Condo Association Fees, Co-op Maintenance Fees, etc. | 4% | -$145 | -$1,740 |
Operating ExpensesRecurring costs required to maintain and manage a rental property, including property taxes, insurance, maintenance, repairs, utilities (if paid by the owner), property management fees, and other day-to-day expenses. Calculation:Insurance + Property Taxes + Property Management + Repairs & Maintenance + Capital Expenditures + HOA Fees | 46% | -$1,595 | -$19,135 |
Cash Flow
| Monthly | Yearly | |
|---|---|---|
Net Operating Income (NOI)The income generated from a property after deducting all operating expenses but before deducting mortgage payments, taxes, and capital expenditures. Calculation:Gross Operating Income - Operating Expenses
Net operating income:
| $1,695 | $20,340 |
Mortgage PaymentThe fixed amount a borrower pays each month to repay a loan. It typically includes principal and interest (P&I) and may also cover property taxes, insurance, HOA fees, and PMI if escrowed. | -$3,017 | -$36,204 |
Cash FlowNet Operating Income (NOI) minus mortgage payments. Calculation:NOI - Mortgage Payments | $1,322 | $15,864 |