$1,500,000
Investment Summary
- Monthly Cash Flow
- -$4,446
- Cap Rate
- 2.1%
- Cash-on-Cash Return
- -15.5%
- Debt Coverage Ratio
- 0.37
- Internal Rate of Return (5 years)
- -11.0%
Cash Flow
Net Operating Income (NOI) minus mortgage payments.
Calculation:
NOI - Mortgage Payments
Cap Rate (Market Value)
Capitalization Rate is a rate of return that compares the yearly Net Operating Income (NOI) to the market value.
Calculation:
NOI / Market Value
Cash-on-Cash Return (CoC)
Annual Cash Flow / Cash Invested
Calculation:
Annual cash flow divided by initial cash invested.
Debt Coverage Ratio (DCR)
Net Operating Income (NOI) divided by total debt payments.
Calculation:
NOI / Total Debt Payments
Internal Rate of Return (IRR)
A metric for assessing profitability over time. IRR is the discount rate at which the net present value (NPV) of all future cash flows (positive and negative) from an investment equals zero — including both periodic cash flow (such as rent) and a projected sale at the end of the holding period. It represents the expected annualized return, accounting for income, expenses, and the recovery of capital through a future sale.
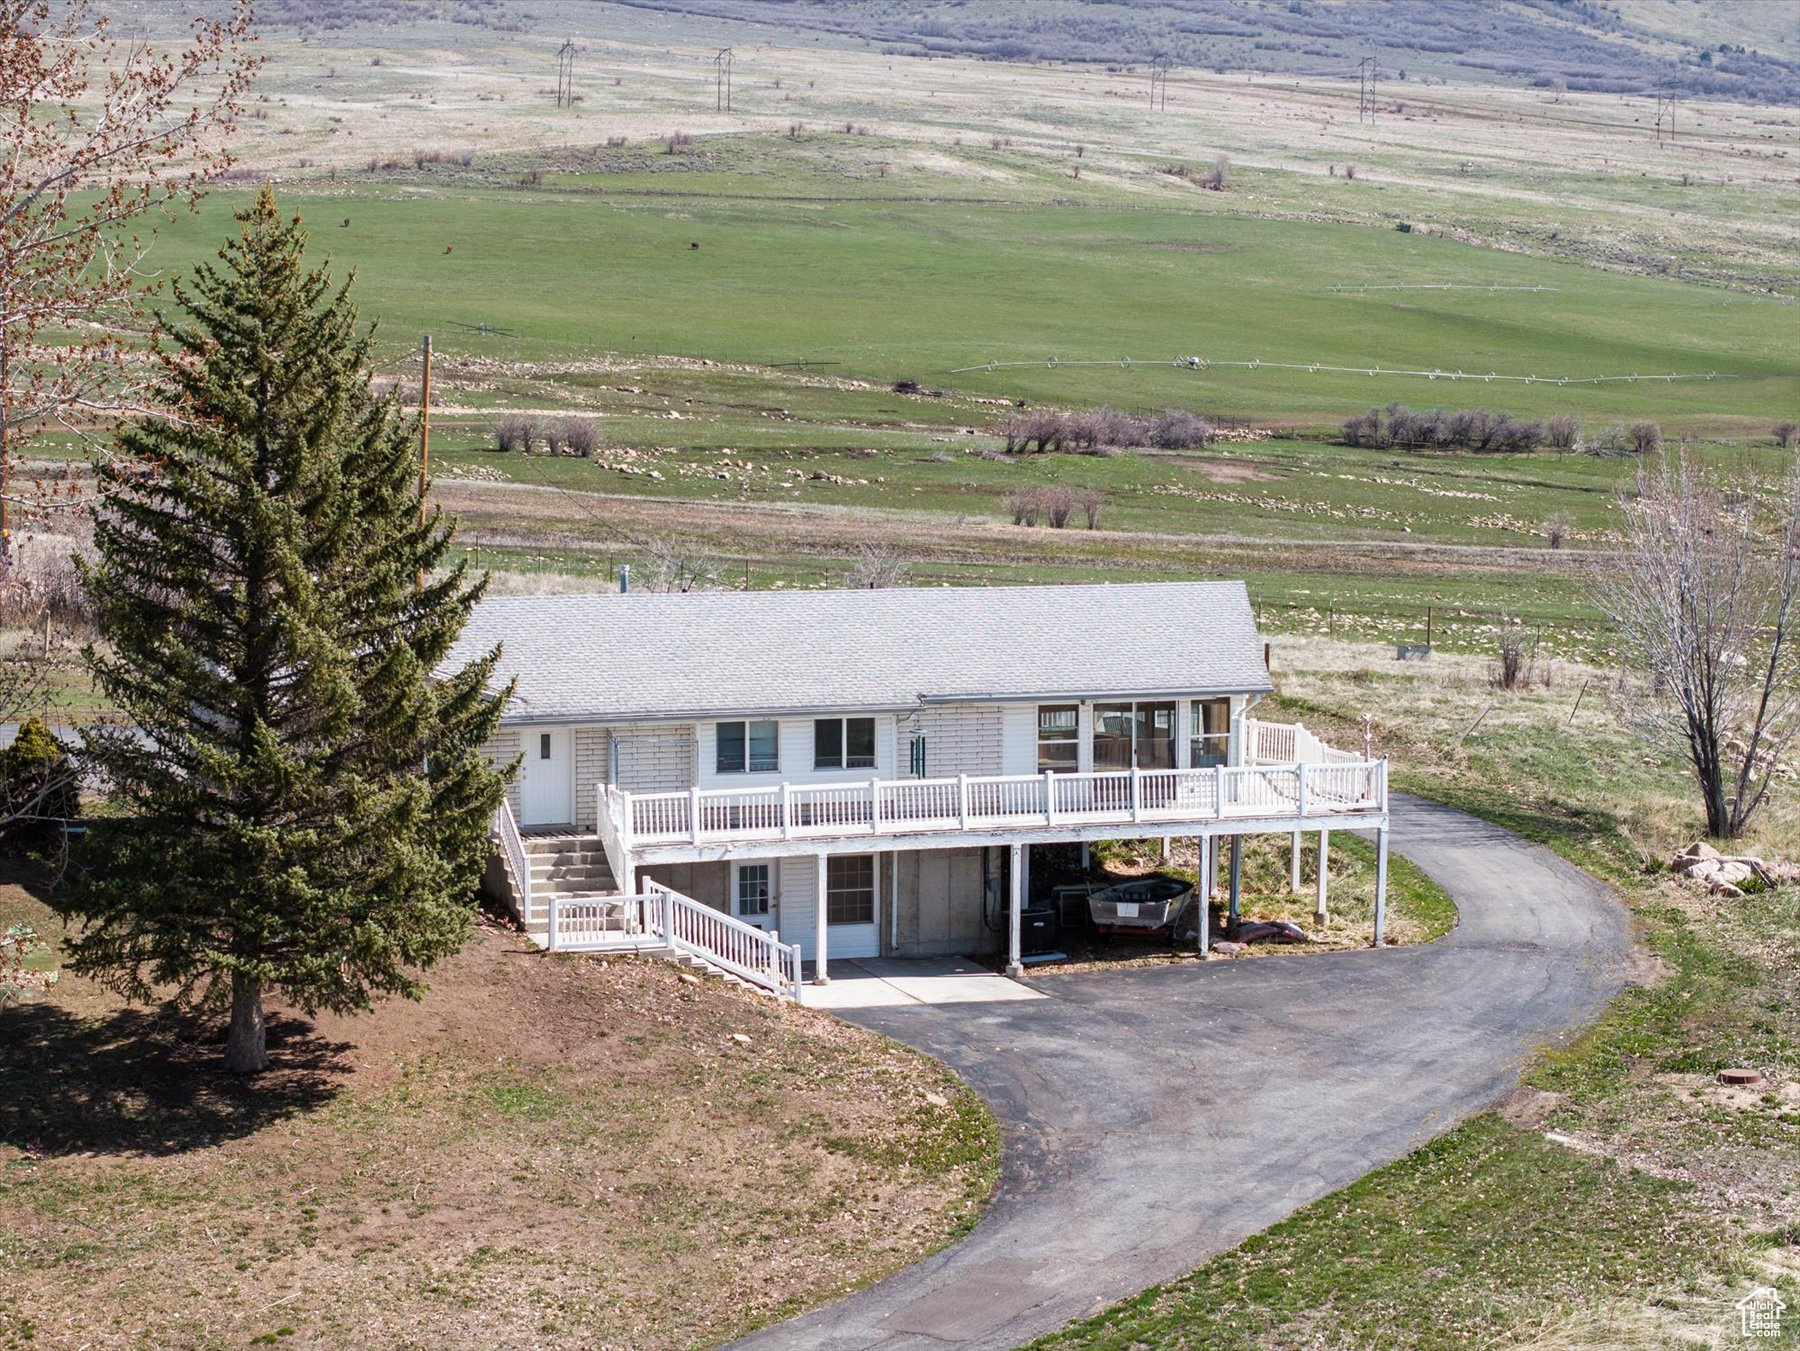
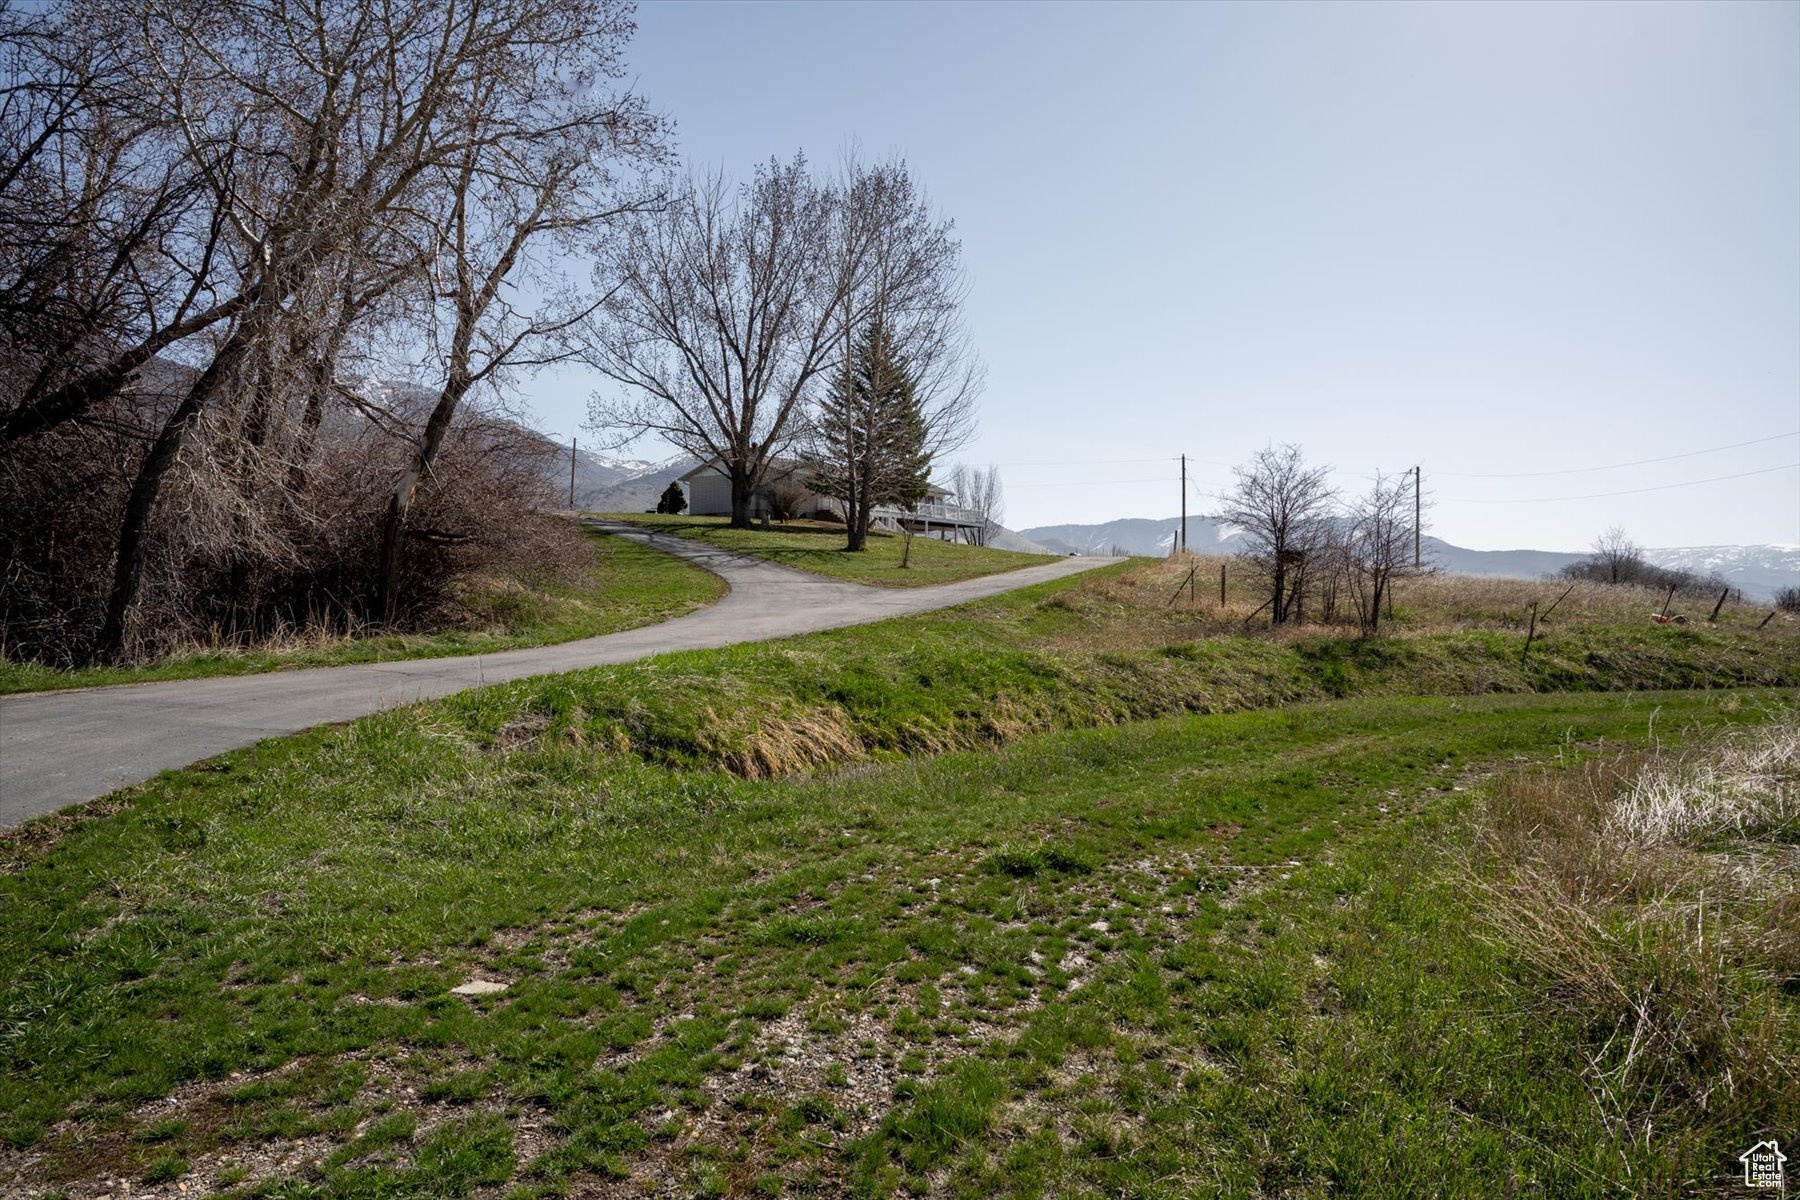
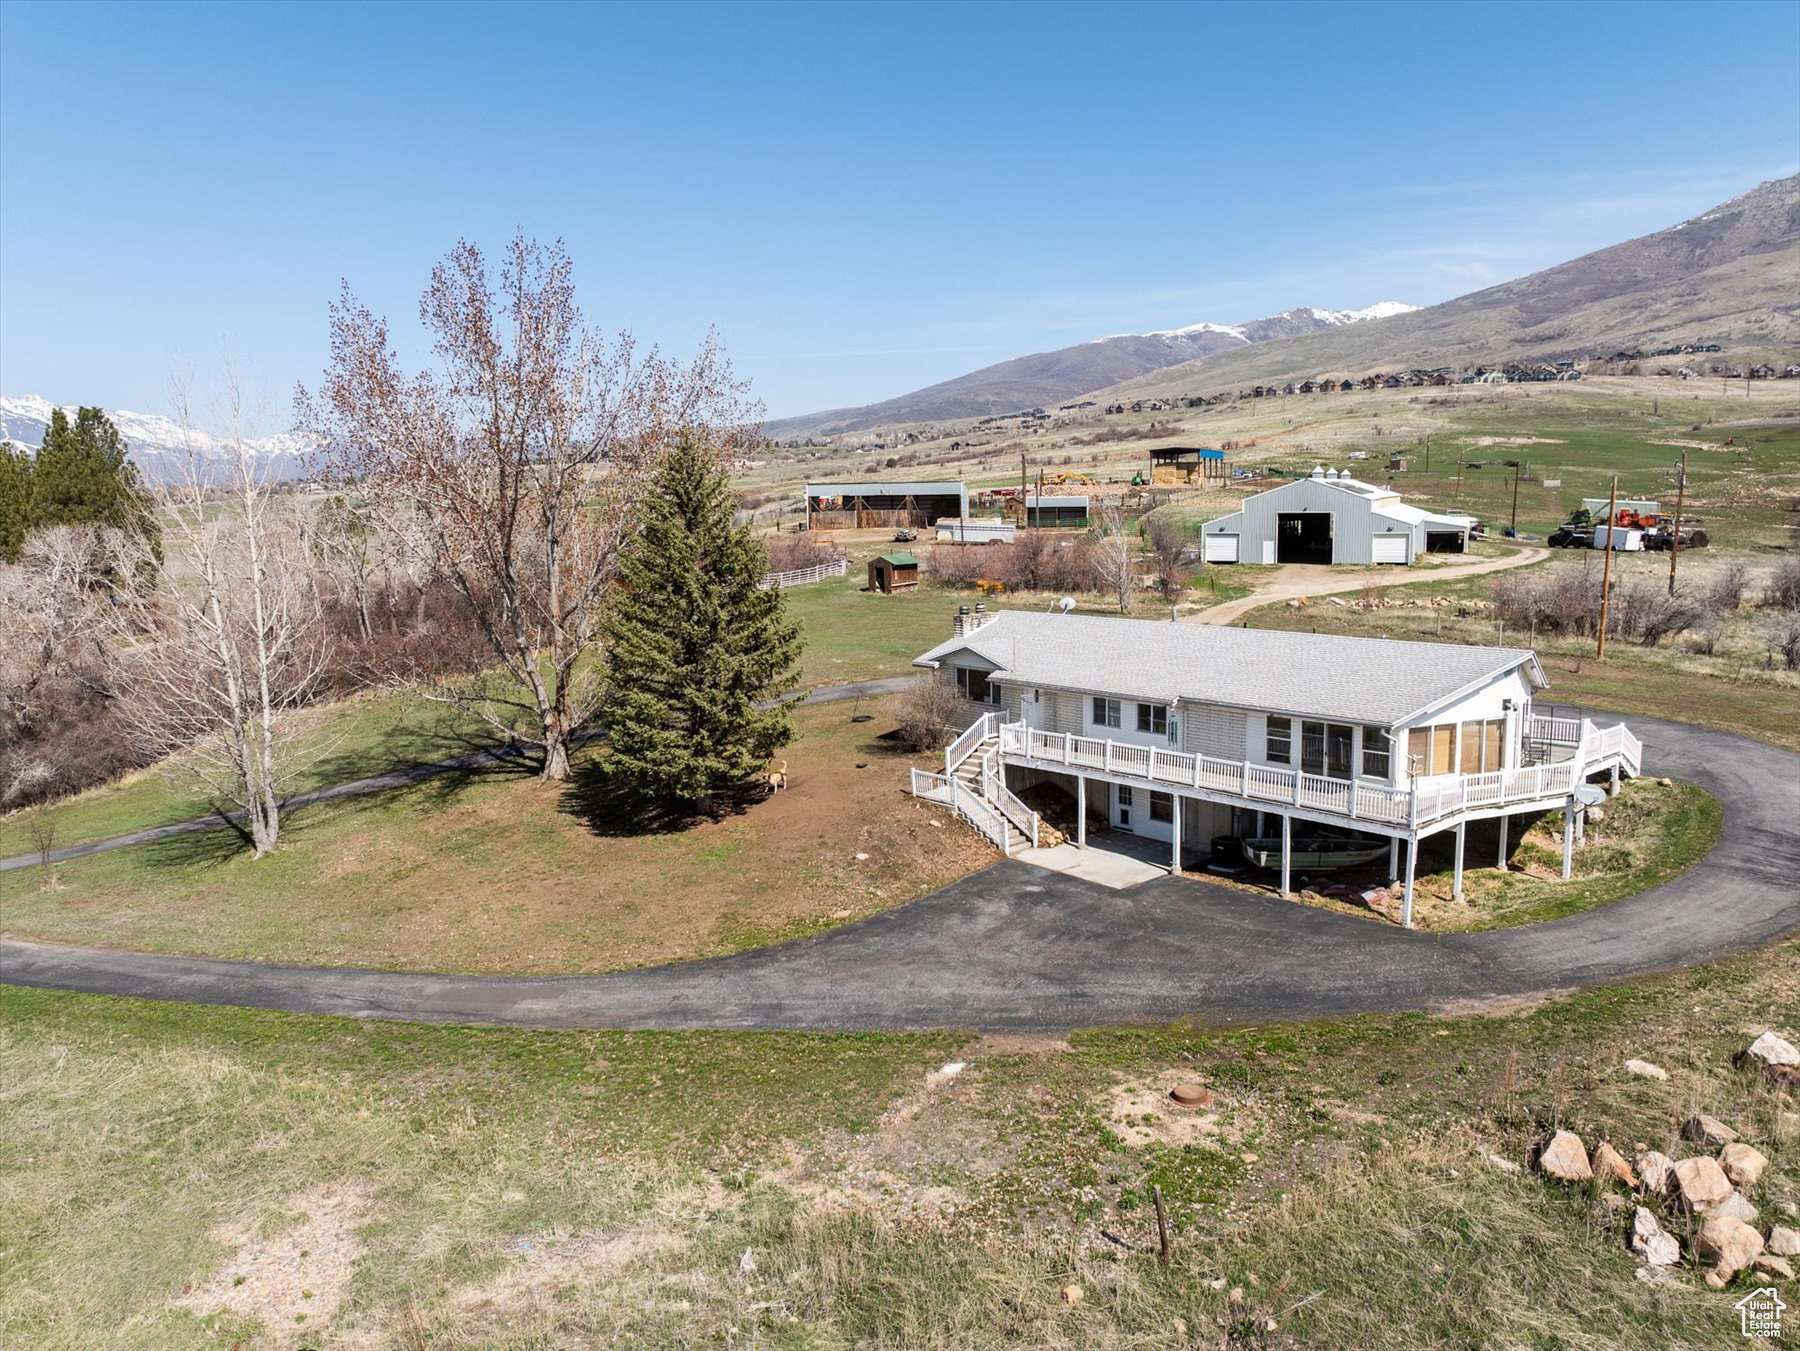
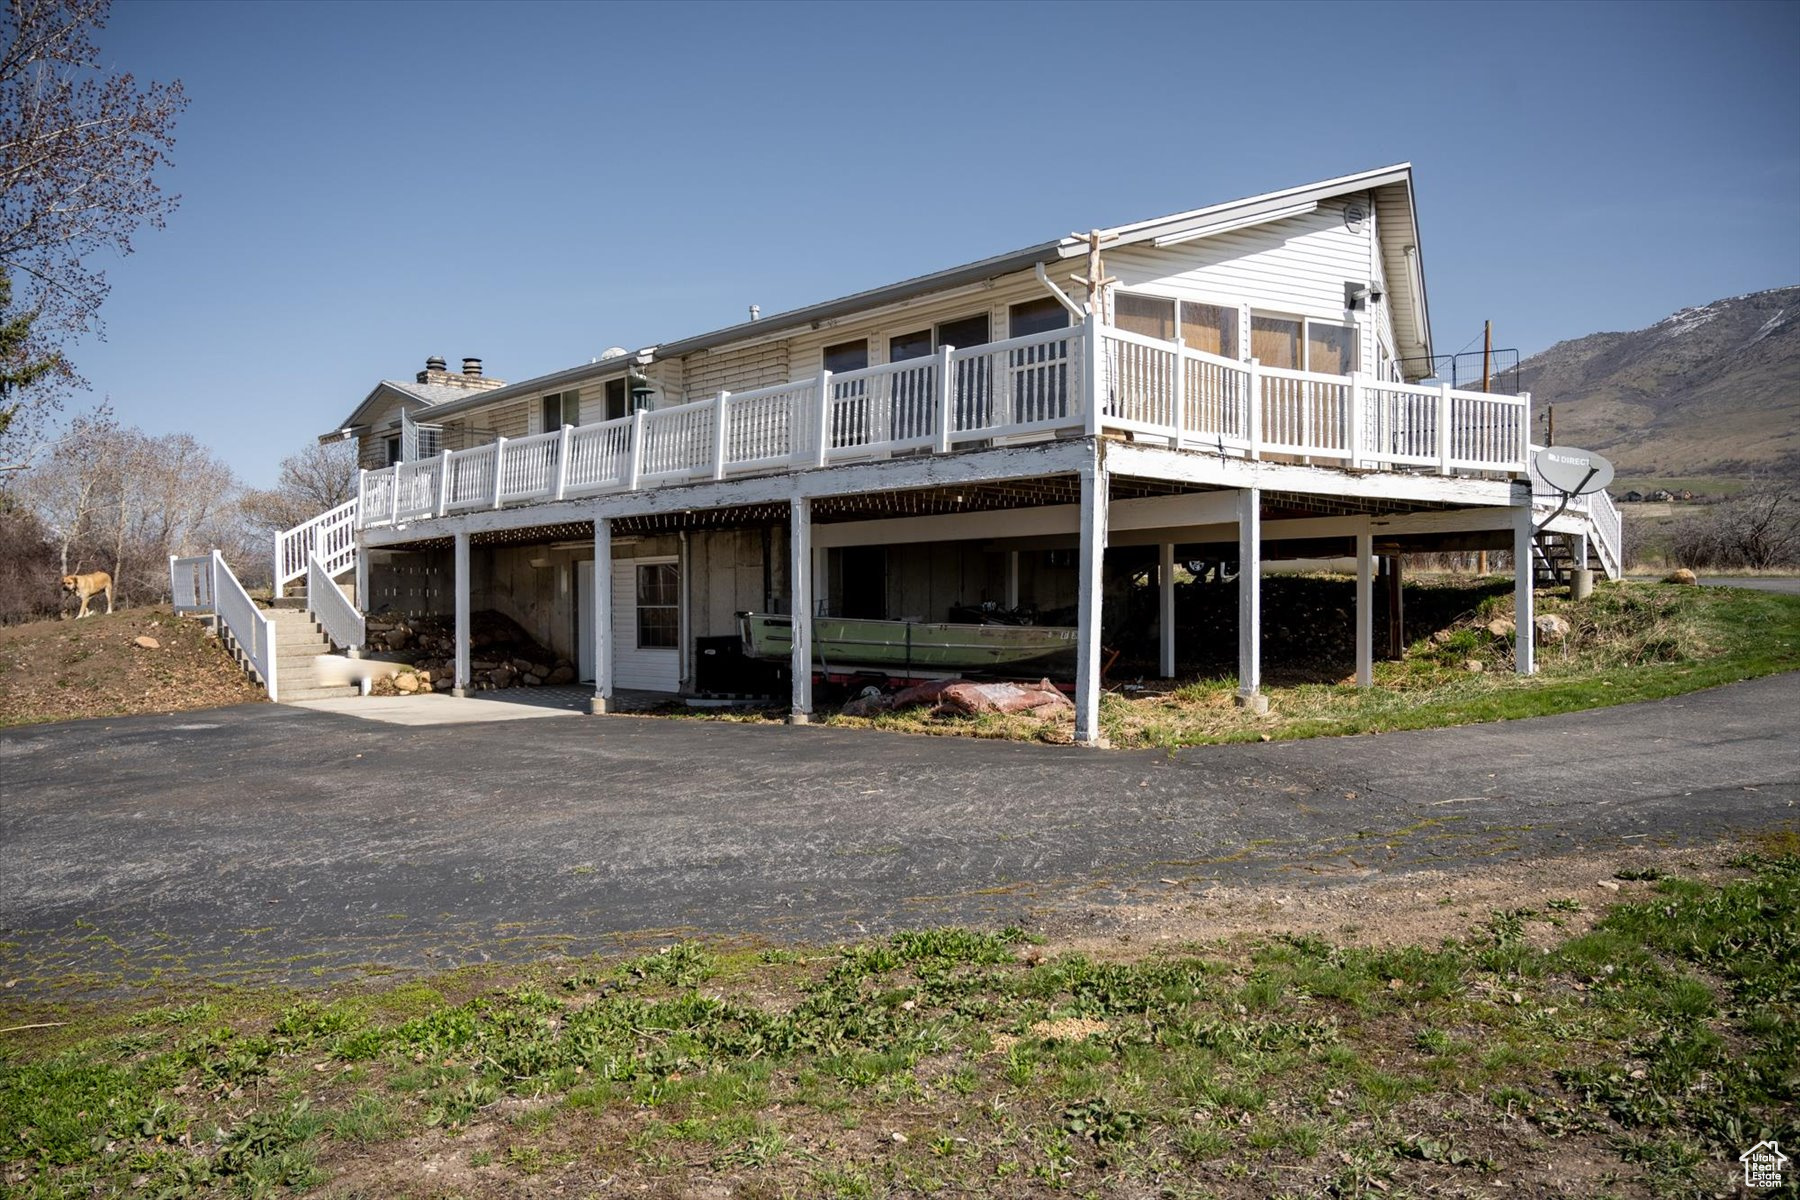
Property Description
Unique opportunity to acquire a slice of Heaven, or in this case, in Eden, that you can call your own. Not only is that possible; you can still be in close proximity to shopping, recreation and other services. Escape from the urban hustle and bustle and experience the peace and quiet that only a large rural parcel affords. Located in the heart of the Ogden Valley, this home is perched atop a knoll that offers panoramic views of the entire valley and the surrounding mountain vistas from the privacy of its wraparound decks. Pine View Reservoir, Snow Basin, Powder Mountain and Nordic Valley are just a few of the resort areas that are within minutes, not hours, from this property. Bring your horses, stable them in the 10,000+ square foot barn powered with the same solar as the home or leave them to graze in the pastures. Store feed in the hay barn and shelter newborns in the manger. The brick and sided home has lots of updates with a newer kitchen, Corian counters, stainless steel appliances and tons of cabinets. The breakfast bar is on casters so that it can be moved around to accommodate a variety of configurations. Every window offers spectacular views and three pellet stoves add ambiance and warmth on those cold winter nights. The enclosed sunroom off the deck allows in an abundance of natural light and invites the outdoors in when the weather is inclement. The suite on the main level has been enlarged by combining the second bedroom to create a primary suite complete with a spacious bath, a jetted tub and separate shower as well a large walk-in closet. French doors lead out from the primary suite into the enclosed sunroom and to the decks. The walk-out downstairs allows easy entry from that level into the home. There is a large family room down with a pellet stove and an alcove that is perfect for an office or add a bed to create a second suite. There is also a bath with a shower, a stackable washer and dryer and another walk-in closet. A stair lift makes the main level handicap accessible or enter that level using the ramp in front of the home. There is also ample room to grow in the unfinished portions down. A river doesn't run through the property but there is a babbling creek. The area has an abundance of year-round recreational opportunities from skiing, hiking, boating and swimming to camping, fishing and hunting. Savor the charm of downtown Huntsville or dine at quaint restaurants like Carlos & Harley's or Simply Eden. There is also golfing, exploring the New World Distillery at Wolf Creek or doing a drive by of the old Huntsville Monastery site. Secure this property now and be well positioned when the Winter Olympics return to Utah in 2034, as many of the venues and events will be staged in the Ogden Valley. Information provided deemed to be reliable. However, buyers and agents are encouraged to verify all.
Build Your Team
Quickly find investor-friendly professionals who can help you succeed in real estate investing at any stage of the investing journey.


Agents
Match with investor-friendly agents who can help you find, analyze, and close your next deal


Lenders
Get the best funding…find investor-friendly lenders who specialize in your deal strategy


Property Managers
Transition to passive investing. Find a trusted property management partnership that lasts.


Tax Pros & Accountants
Taxes and financial reporting made easy—find experts to create tax savings strategies, file taxes, and more
Location
Property Details
Parking
- Details: Attached
- Garage Spaces: 0
- Spaces Total: 1
Bedroom Information
- # of Bedrooms: 2
Bathroom Information
- # of Baths (Full): 1
- # of Baths (Partial): 1
- # of Baths (Total): 3.0
Interior Features
- # of Rooms: 14
- # of Stories: 2
- Basement: Yes
- Basement Description: Daylight, Full, Walk-Out Access
- Fireplace: Yes
Exterior Features
- Exterior Walls Materials: Brick Veneer
- Roof Material: Asphalt
- Solar Panels: Yes
Land Information
- Land Use: Residential
- Land Use Subtype: Single Family Residential
Lot Information
- Parcel ID: 220200017
- Lot Size: 311454 sqft
Property Information
- Property Type: Single Family Residence
- Style: Rambler/Ranch
- Year Built: 1974
Tax Information
- Annual Tax: $6,268
Utilities
- Heating: Fireplace Insert, Central, Natural Gas, Electric, Forced Air, Propane
- Cooling: Central Air
Location
- County: Weber
Listing Details
Investment Summary
- Monthly Cash Flow
- -$4,446
- Cap Rate
- 2.1%
- Cash-on-Cash Return
- -15.5%
- Debt Coverage Ratio
- 0.37
- Internal Rate of Return (5 years)
- -11.0%
Cash Flow
Net Operating Income (NOI) minus mortgage payments.
Calculation:
NOI - Mortgage Payments
Cap Rate (Market Value)
Capitalization Rate is a rate of return that compares the yearly Net Operating Income (NOI) to the market value.
Calculation:
NOI / Market Value
Cash-on-Cash Return (CoC)
Annual Cash Flow / Cash Invested
Calculation:
Annual cash flow divided by initial cash invested.
Debt Coverage Ratio (DCR)
Net Operating Income (NOI) divided by total debt payments.
Calculation:
NOI / Total Debt Payments
Internal Rate of Return (IRR)
A metric for assessing profitability over time. IRR is the discount rate at which the net present value (NPV) of all future cash flows (positive and negative) from an investment equals zero — including both periodic cash flow (such as rent) and a projected sale at the end of the holding period. It represents the expected annualized return, accounting for income, expenses, and the recovery of capital through a future sale.
Purchase Details
Purchase PriceThe price paid for the property. Purchase price:
| $1,500,000 |
|---|---|
Amount FinancedThe amount of the purchase financed through a loan. Amount financed:
| -$1,200,000 |
Down paymentThe initial payment made towards the purchase. Down payment:
| $300,000 |
Closing CostsFees and expenses associated with purchasing a property, typically ranging from 2% to 5% of the home’s purchase price, paid at the end of a home purchase to cover services like lending, title transfer, and taxes. Closing costs:
| $45,000 |
Rehab CostsCosts incurred to repair or improve the property, including: roof, flooring, exterior siding, kitchen, exterior paint, bathrooms, etc. Rehab costs:
| $0 |
Initial Cash InvestedThe total initial cash invested in the property. Calculation:Down payment + Buying costs + Rehab costs Initial cash invested:
| $345,000 |
Square Feet (SQFT)The total square footage of the property. Square feet:
| 3,225 |
Cost Per Square FootCost per square foot of the property. Calculation:Purchase Price / Square Feet Cost per square foot:
| $465 |
Monthly Rent Per Square FootMonthly rent divided by the number of square feet. This ratio helps investors compare rental income efficiency across properties, markets, and unit sizes Calculation:Monthly Rent / Square Feet Monthly rent per square foot:
| $1.43 |
Financing Details
Loan AmountThe total sum of money borrowed from a lender to finance a property purchase. Calculation:Purchase Price - Down Payment
Loan amount:
| $1,200,000 |
|---|---|
Loan to Value Ratio (LTV)Loan amount divided by the market value of the property. Calculation:Loan Amount / Market Value
Loan to value ratio:
| 80.0% |
Loan TypeThe type of loan (e.g., fixed, adjustable).
Loan type:
| Amortizing |
TermThe loan repayment period in years.
Term:
| 30 years |
Interest RateThe percentage a lender charges on the borrowed amount of a loan, determining the cost of borrowing money.
Interest rate:
| 5.875% |
Principal & Interest (PI)The principal is the portion of the loan payment that reduces the loan balance. The interest is the lender's charge for borrowing money. Calculation:(P * r * (1 + r) ** n) / ((1 + r) ** n - 1) Where:
P = Loan amount (principal)
Principal & interest:
| $7,098 |
Property TaxesAnnual taxes levied by local governments on real estate properties. These taxes fund public services like schools, roads, and emergency services.
Property tax:
| $522 |
InsuranceThe costs for insurance coverage to protect against financial losses due to risks like fire, natural disasters, theft, liability, or tenant-related damages. Calculation:Assumes 7% of gross rental income, unless insurance rates are specified.
Insurance:
| $322 |
Private Mortgage Insurance (PMI)A fee that borrowers pay when they take out a conventional loan with a loan-to-value (LTV) ratio above 80%.
Private mortgage insurance (PMI):
| $0 |
Monthly PaymentThe fixed amount a borrower pays each month to repay a loan. It typically includes principal and interest (P&I) and may also cover property taxes, insurance, HOA fees, and PMI if escrowed. Monthly payment:
| $7,942 |
Operating Income
| % Rent | Monthly | Yearly | |
|---|---|---|---|
Gross RentThe total rental income received from tenants before deducting any expenses. Includes base rent, late fees, pet fees, parking fees, and other recurring charges.
Gross rent:
| $4,600 | $55,200 | |
Vacancy LossExpected loss of rent due to vacancies.
Vacancy loss:
(6%)
| 6% | -$276 | -$3,312 |
Operating IncomeGross rental income minus vacancy loss. Calculation:Gross rent - Vacancy loss
Operating income:
| $4,324 | $51,888 |
Operating Expenses
| % Rent | Monthly | Yearly | |
|---|---|---|---|
Property TaxesAnnual taxes levied by local governments on real estate properties. These taxes fund public services like schools, roads, and emergency services. | 11% | -$522 | -$6,268 |
InsuranceThe costs for insurance coverage to protect against financial losses due to risks like fire, natural disasters, theft, liability, or tenant-related damages. Calculation:Assumes 7% of gross rental income, unless insurance rates are specified. | 7% | -$322 | -$3,864 |
Property ManagementThe costs associated with hiring a property manager to handle the day-to-day operations of a rental property. Includes management fees, leasing fes, eviction fees, etc. Calculation:Assumes 8% of gross rental income. | 8% | -$368 | -$4,416 |
Repairs & MaintenanceOngoing costs for routine upkeep and minor fixes needed to keep a property in good working condition. Calculation:Assumes 5% of gross rental income. Varies by property age and condition. | 5% | -$230 | -$2,760 |
Capital ExpensesLarge, infrequent costs for major improvements or replacements, like a new roof, HVAC system, or appliances. Calculation:Assumes 5% of gross rental income. Varies by property age. | 5% | -$230 | -$2,760 |
HOA FeesRegular dues paid to a Homeowners Association for community maintenance, amenities, and management. Similar fees include: Condo Association Fees, Co-op Maintenance Fees, etc. | n/a | n/a | n/a |
Operating ExpensesRecurring costs required to maintain and manage a rental property, including property taxes, insurance, maintenance, repairs, utilities (if paid by the owner), property management fees, and other day-to-day expenses. Calculation:Insurance + Property Taxes + Property Management + Repairs & Maintenance + Capital Expenditures + HOA Fees | 36% | -$1,672 | -$20,068 |
Cash Flow
| Monthly | Yearly | |
|---|---|---|
Net Operating Income (NOI)The income generated from a property after deducting all operating expenses but before deducting mortgage payments, taxes, and capital expenditures. Calculation:Gross Operating Income - Operating Expenses
Net operating income:
| $2,652 | $31,824 |
Mortgage PaymentThe fixed amount a borrower pays each month to repay a loan. It typically includes principal and interest (P&I) and may also cover property taxes, insurance, HOA fees, and PMI if escrowed. | -$7,098 | -$85,176 |
Cash FlowNet Operating Income (NOI) minus mortgage payments. Calculation:NOI - Mortgage Payments | $4,446 | $53,352 |