$637,000
Investment Summary
- Monthly Cash Flow
- -$1,713
- Cap Rate
- 2.9%
- Cash-on-Cash Return
- -14.0%
- Debt Coverage Ratio
- 0.48
- Internal Rate of Return (5 years)
- -9.6%
Cash Flow
Net Operating Income (NOI) minus mortgage payments.
Calculation:
NOI - Mortgage Payments
Cap Rate (Market Value)
Capitalization Rate is a rate of return that compares the yearly Net Operating Income (NOI) to the market value.
Calculation:
NOI / Market Value
Cash-on-Cash Return (CoC)
Annual Cash Flow / Cash Invested
Calculation:
Annual cash flow divided by initial cash invested.
Debt Coverage Ratio (DCR)
Net Operating Income (NOI) divided by total debt payments.
Calculation:
NOI / Total Debt Payments
Internal Rate of Return (IRR)
A metric for assessing profitability over time. IRR is the discount rate at which the net present value (NPV) of all future cash flows (positive and negative) from an investment equals zero — including both periodic cash flow (such as rent) and a projected sale at the end of the holding period. It represents the expected annualized return, accounting for income, expenses, and the recovery of capital through a future sale.
Property Description
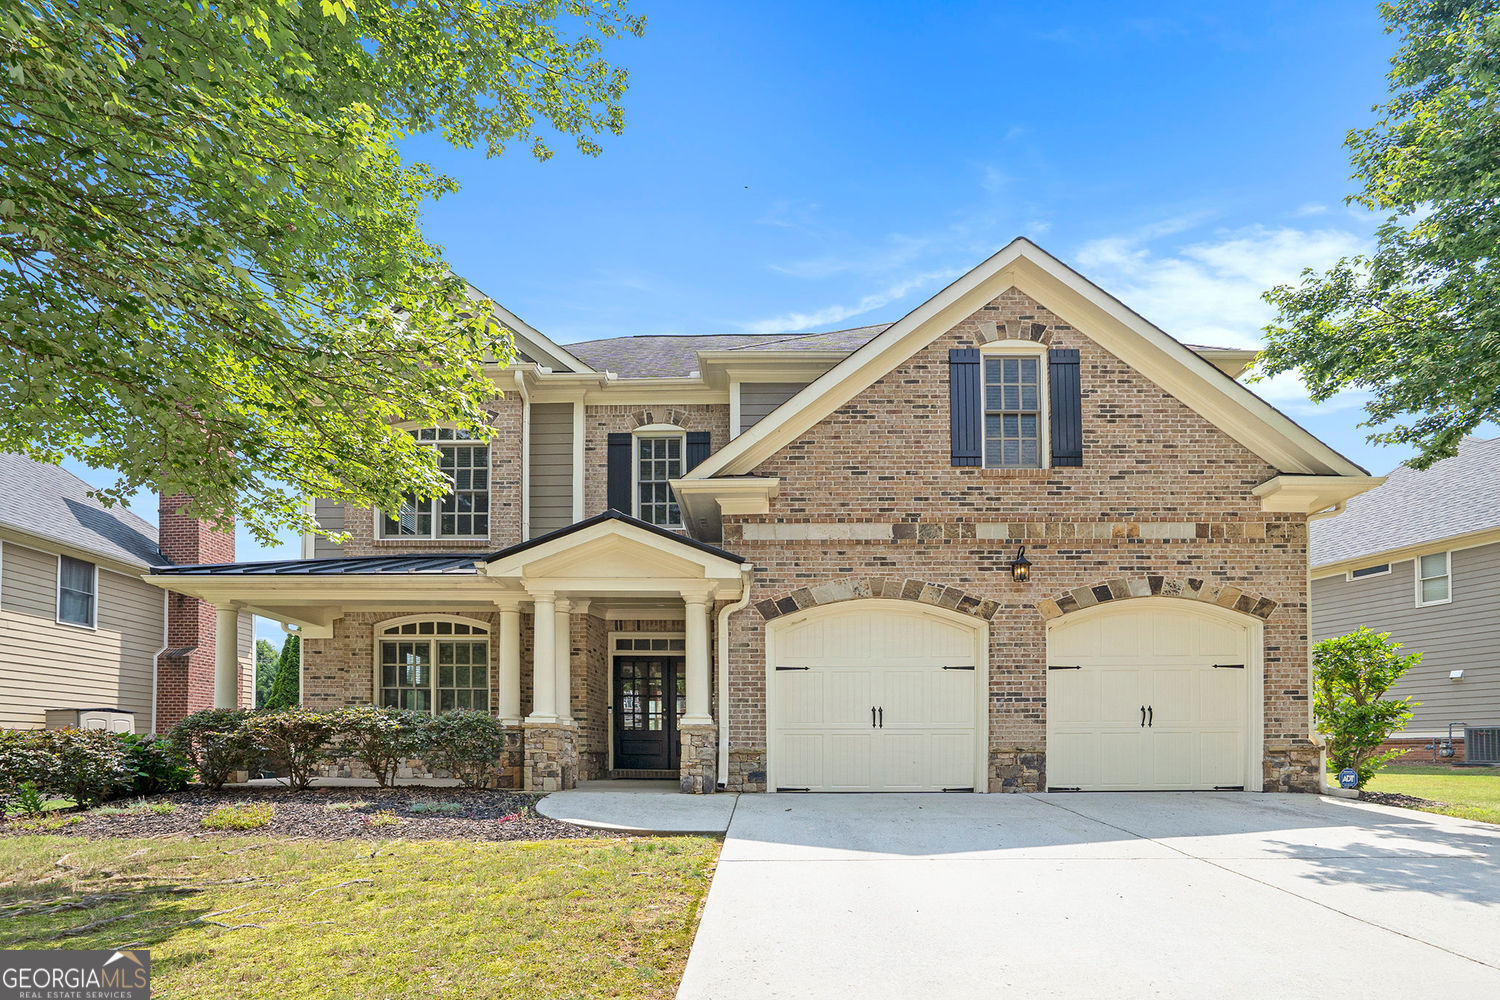
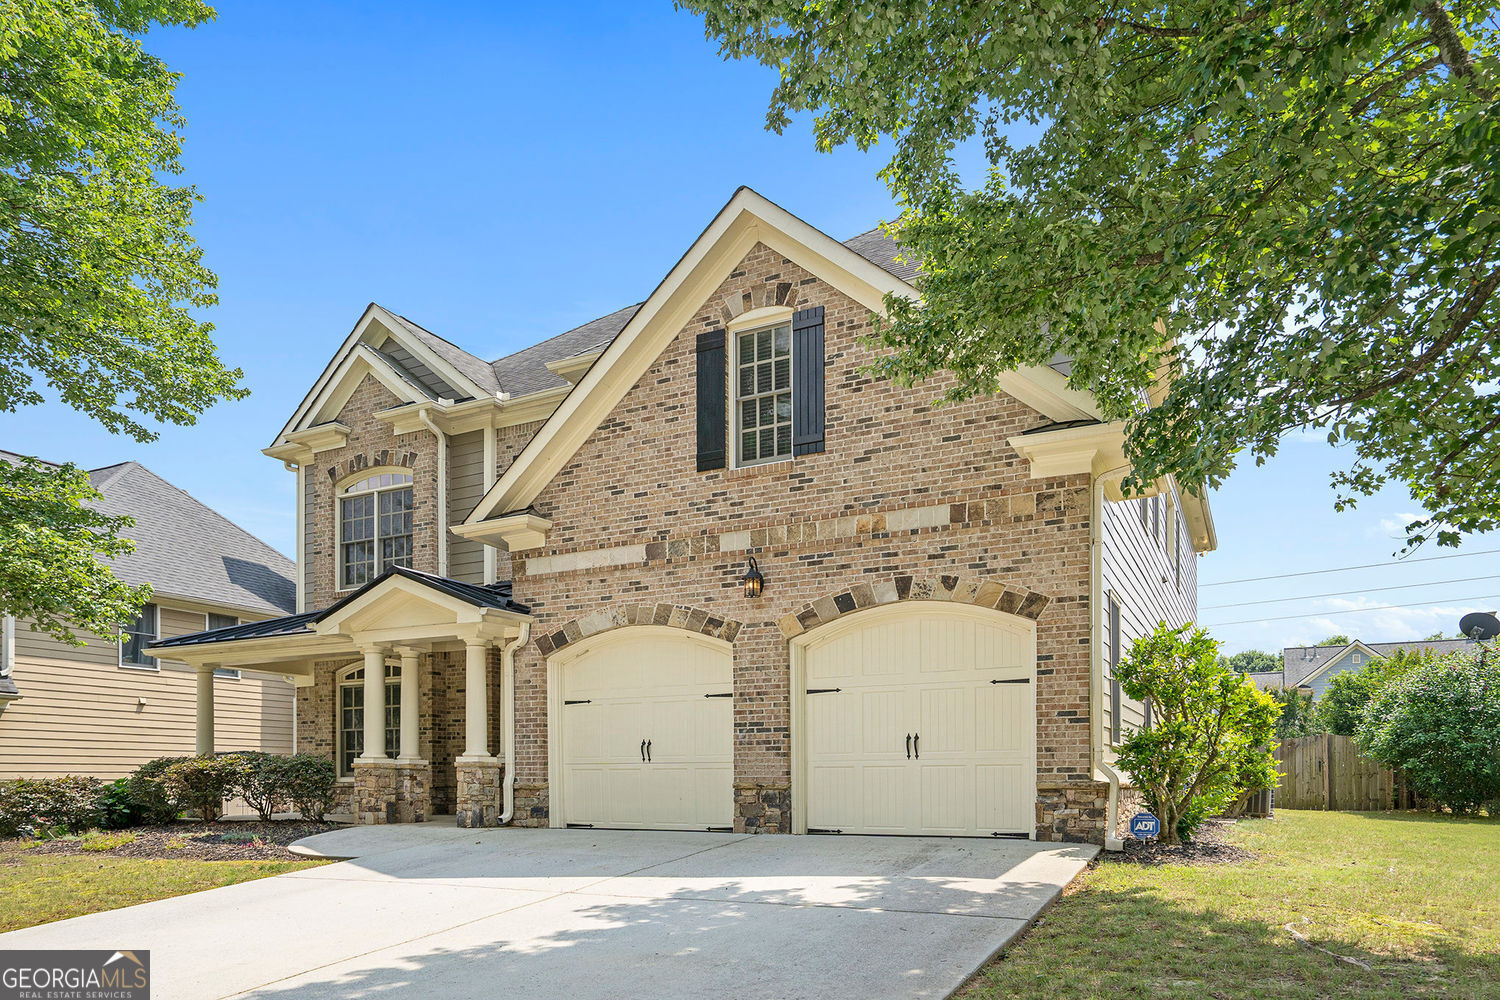
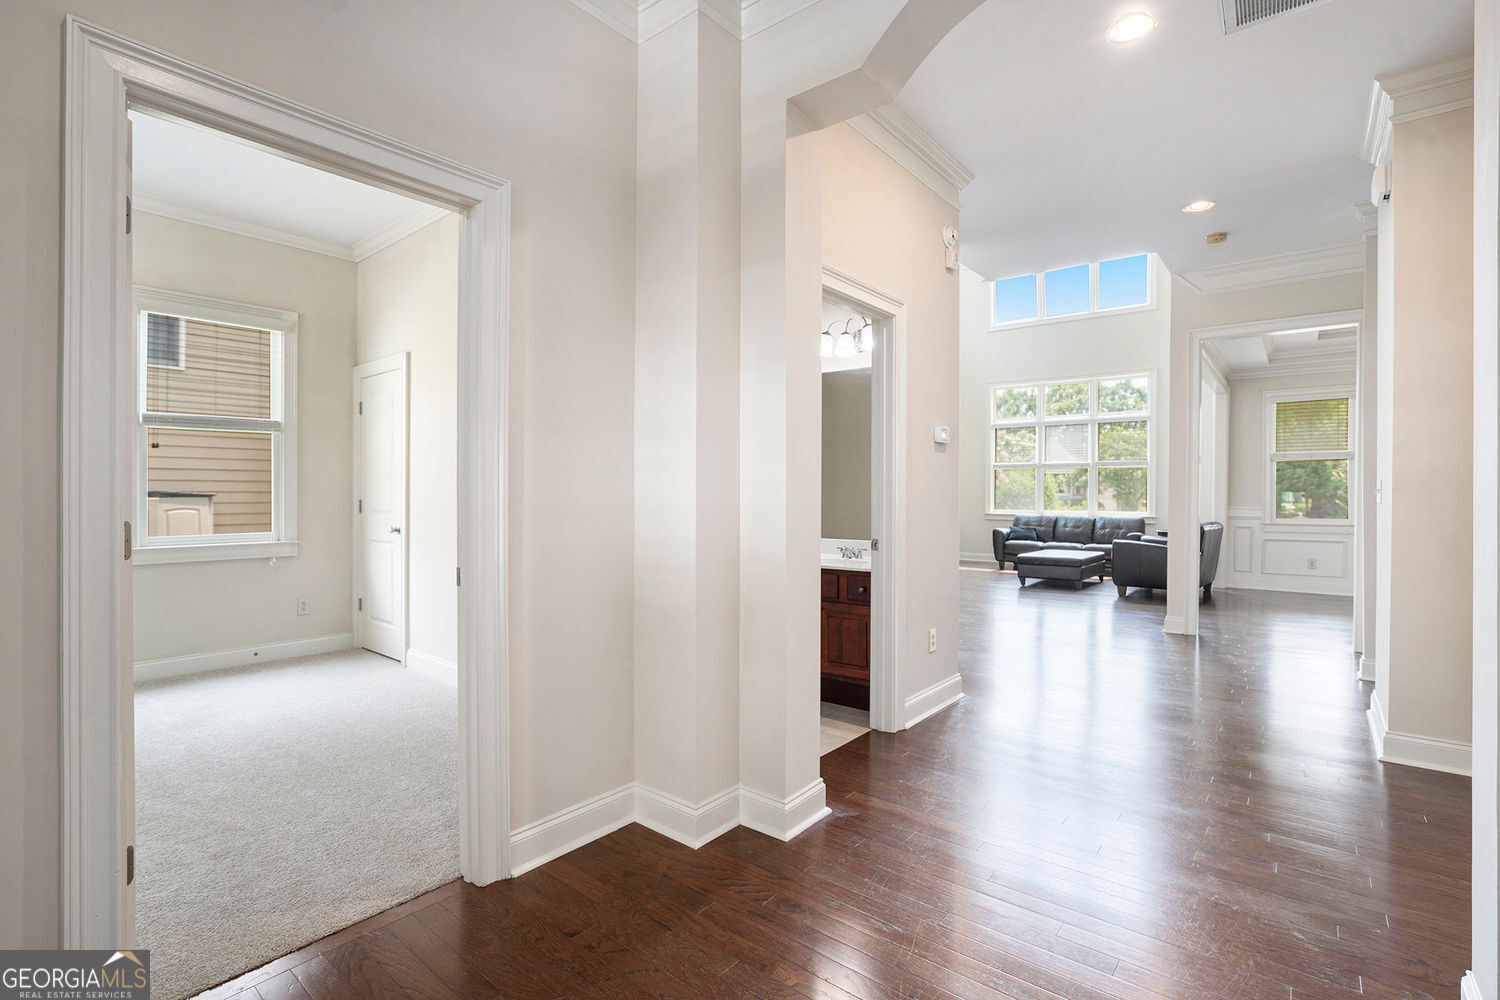
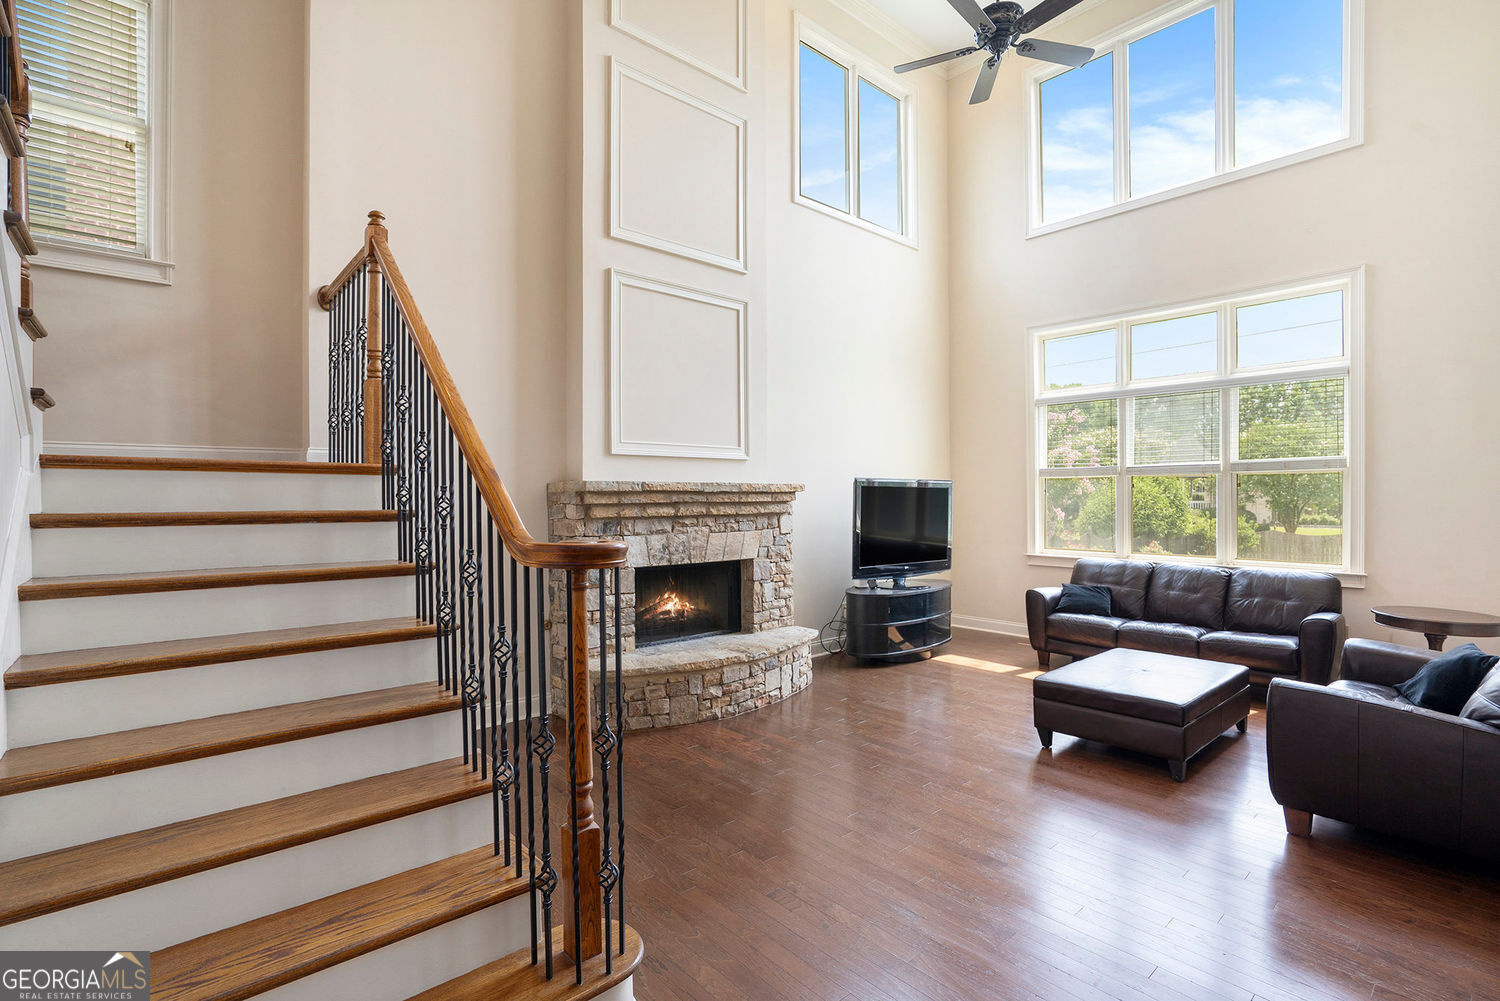
If you're searching for a home that blends space, style, and everyday functionality in one of Smyrna's most desirable neighborhoods-you've found it. Welcome to 585 Lawton Bridge Road, a beautifully maintained 4-bedroom, 3-bathroom home located in the highly sought-after Barnes Mill community. This residence stands out with its thoughtful layout, timeless finishes, and flexible living spaces designed to adapt to the way you live today. From the moment you step inside, it's clear-you're not just touring another house, you're stepping into your next home. Natural light pours across the rich hardwood floors, creating a warm, welcoming ambiance throughout the main level. Just off the foyer, you'll find a full guest bedroom and bathroom-perfect for overnight visitors, in-laws, or a comfortable work-from-home office. At the heart of the home, a dramatic two-story great room with a cozy fireplace and expansive windows creates an inviting space ideal for both everyday living and entertaining. The open layout leads into a formal dining room that offers the perfect backdrop for holiday gatherings, dinner parties, or casual family meals. The kitchen is a true showstopper-boasting an abundance of cabinetry, ample granite counter space, and an oversized center island with bar seating. Whether you're prepping meals, catching up with friends, or helping with homework, this space is designed to handle it all. The sunny breakfast nook just off the kitchen ties it all together, offering an ideal spot for morning coffee or casual dining. Upstairs, the flexible loft area offers endless possibilities. Set up a cozy reading nook, a home office, workout area, or a second media lounge-the choice is yours. The oversized primary suite is a luxurious retreat, complete with a tray ceiling and an impressively large sitting area that can double as a nursery, yoga space, or your own personal lounge. The spa-inspired ensuite features dual vanities, a soaking tub, a separate shower, and a huge walk-in closet designed to impress. Two additional bedrooms upstairs are bright and spacious, connected by a convenient Jack and Jill bathroom-an ideal setup for children, teens, or guests seeking a little extra privacy and comfort. Step outside to your covered porch and enjoy a fully fenced backyard-perfect for pets, playtime, or simply relaxing in your own outdoor sanctuary. Whether you're hosting a summer barbecue or enjoying a quiet evening under the stars, this space is ready for it all. Barnes Mill residents enjoy access to resort-style amenities including a community pool, tennis courts, clubhouse, and direct access to the scenic Silver Comet Trail-ideal for biking, walking, or jogging. And with quick access to The Battery, Truist Park, I-285, and all the shopping and dining that Smyrna has to offer, you'll love the location just as much as the home. Whether you're a growing family, a remote professional, or a multigenerational household, this home offers the layout, features, and lifestyle you've been waiting for. Schedule your private tour today and experience firsthand why 585 Lawton Bridge Road should be the first one on your list.
Build Your Team
Quickly find investor-friendly professionals who can help you succeed in real estate investing at any stage of the investing journey.


Agents
Match with investor-friendly agents who can help you find, analyze, and close your next deal


Lenders
Get the best funding…find investor-friendly lenders who specialize in your deal strategy


Property Managers
Transition to passive investing. Find a trusted property management partnership that lasts.


Tax Pros & Accountants
Taxes and financial reporting made easy—find experts to create tax savings strategies, file taxes, and more
Location
Property Details
Parking
- Description: Garage
- Details: Attached, Garage
- Garage Spaces: 2
- Spaces Total: 2
Bedroom Information
- # of Bedrooms: 4
Bathroom Information
- # of Baths (Full): 3
- # of Baths (Total): 0.0
Interior Features
- # of Rooms: 8
- # of Stories: 2
- Basement Description: None
- Fireplace: Yes
Exterior Features
- Exterior Walls Materials: Masonry
- Foundation: Slab
- Roof Material: Composition
HOA
- Has HOA: Yes
- HOA Fee: $1,100/annually
Land Information
- Land Use: Residential
- Land Use Subtype: Single Family Residential
Lot Information
- Parcel ID: 17009800590
- Lot Size: 0 sqft
Property Information
- Property Type: Single Family Residence
- Style: Traditional
- Year Built: 2007
Tax Information
- Annual Tax: $6,790
Utilities
- Water & Sewer: Public
- Heating: Central
- Cooling: Central Air
Location
- County: Cobb
Investment Summary
- Monthly Cash Flow
- -$1,713
- Cap Rate
- 2.9%
- Cash-on-Cash Return
- -14.0%
- Debt Coverage Ratio
- 0.48
- Internal Rate of Return (5 years)
- -9.6%
Cash Flow
Net Operating Income (NOI) minus mortgage payments.
Calculation:
NOI - Mortgage Payments
Cap Rate (Market Value)
Capitalization Rate is a rate of return that compares the yearly Net Operating Income (NOI) to the market value.
Calculation:
NOI / Market Value
Cash-on-Cash Return (CoC)
Annual Cash Flow / Cash Invested
Calculation:
Annual cash flow divided by initial cash invested.
Debt Coverage Ratio (DCR)
Net Operating Income (NOI) divided by total debt payments.
Calculation:
NOI / Total Debt Payments
Internal Rate of Return (IRR)
A metric for assessing profitability over time. IRR is the discount rate at which the net present value (NPV) of all future cash flows (positive and negative) from an investment equals zero — including both periodic cash flow (such as rent) and a projected sale at the end of the holding period. It represents the expected annualized return, accounting for income, expenses, and the recovery of capital through a future sale.
Purchase Details
Purchase PriceThe price paid for the property. Purchase price:
| $637,000 |
|---|---|
Amount FinancedThe amount of the purchase financed through a loan. Amount financed:
| -$509,600 |
Down paymentThe initial payment made towards the purchase. Down payment:
| $127,400 |
Closing CostsFees and expenses associated with purchasing a property, typically ranging from 2% to 5% of the home’s purchase price, paid at the end of a home purchase to cover services like lending, title transfer, and taxes. Closing costs:
| $19,110 |
Rehab CostsCosts incurred to repair or improve the property, including: roof, flooring, exterior siding, kitchen, exterior paint, bathrooms, etc. Rehab costs:
| $0 |
Initial Cash InvestedThe total initial cash invested in the property. Calculation:Down payment + Buying costs + Rehab costs Initial cash invested:
| $146,510 |
Square Feet (SQFT)The total square footage of the property. Square feet:
| 3,271 |
Cost Per Square FootCost per square foot of the property. Calculation:Purchase Price / Square Feet Cost per square foot:
| $195 |
Monthly Rent Per Square FootMonthly rent divided by the number of square feet. This ratio helps investors compare rental income efficiency across properties, markets, and unit sizes Calculation:Monthly Rent / Square Feet Monthly rent per square foot:
| $0.98 |
Financing Details
Loan AmountThe total sum of money borrowed from a lender to finance a property purchase. Calculation:Purchase Price - Down Payment
Loan amount:
| $509,600 |
|---|---|
Loan to Value Ratio (LTV)Loan amount divided by the market value of the property. Calculation:Loan Amount / Market Value
Loan to value ratio:
| 80.0% |
Loan TypeThe type of loan (e.g., fixed, adjustable).
Loan type:
| Amortizing |
TermThe loan repayment period in years.
Term:
| 30 years |
Interest RateThe percentage a lender charges on the borrowed amount of a loan, determining the cost of borrowing money.
Interest rate:
| 6.625% |
Principal & Interest (PI)The principal is the portion of the loan payment that reduces the loan balance. The interest is the lender's charge for borrowing money. Calculation:(P * r * (1 + r) ** n) / ((1 + r) ** n - 1) Where:
P = Loan amount (principal)
Principal & interest:
| $3,263 |
Property TaxesAnnual taxes levied by local governments on real estate properties. These taxes fund public services like schools, roads, and emergency services.
Property tax:
| $566 |
InsuranceThe costs for insurance coverage to protect against financial losses due to risks like fire, natural disasters, theft, liability, or tenant-related damages. Calculation:Assumes 7% of gross rental income, unless insurance rates are specified.
Insurance:
| $224 |
Private Mortgage Insurance (PMI)A fee that borrowers pay when they take out a conventional loan with a loan-to-value (LTV) ratio above 80%.
Private mortgage insurance (PMI):
| $0 |
Monthly PaymentThe fixed amount a borrower pays each month to repay a loan. It typically includes principal and interest (P&I) and may also cover property taxes, insurance, HOA fees, and PMI if escrowed. Monthly payment:
| $4,053 |
Operating Income
| % Rent | Monthly | Yearly | |
|---|---|---|---|
Gross RentThe total rental income received from tenants before deducting any expenses. Includes base rent, late fees, pet fees, parking fees, and other recurring charges.
Gross rent:
| $3,200 | $38,400 | |
Vacancy LossExpected loss of rent due to vacancies.
Vacancy loss:
(6%)
| 6% | -$192 | -$2,304 |
Operating IncomeGross rental income minus vacancy loss. Calculation:Gross rent - Vacancy loss
Operating income:
| $3,008 | $36,096 |
Operating Expenses
| % Rent | Monthly | Yearly | |
|---|---|---|---|
Property TaxesAnnual taxes levied by local governments on real estate properties. These taxes fund public services like schools, roads, and emergency services. | 18% | -$566 | -$6,790 |
InsuranceThe costs for insurance coverage to protect against financial losses due to risks like fire, natural disasters, theft, liability, or tenant-related damages. Calculation:Assumes 7% of gross rental income, unless insurance rates are specified. | 7% | -$224 | -$2,688 |
Property ManagementThe costs associated with hiring a property manager to handle the day-to-day operations of a rental property. Includes management fees, leasing fes, eviction fees, etc. Calculation:Assumes 8% of gross rental income. | 8% | -$256 | -$3,072 |
Repairs & MaintenanceOngoing costs for routine upkeep and minor fixes needed to keep a property in good working condition. Calculation:Assumes 5% of gross rental income. Varies by property age and condition. | 5% | -$160 | -$1,920 |
Capital ExpensesLarge, infrequent costs for major improvements or replacements, like a new roof, HVAC system, or appliances. Calculation:Assumes 5% of gross rental income. Varies by property age. | 5% | -$160 | -$1,920 |
HOA FeesRegular dues paid to a Homeowners Association for community maintenance, amenities, and management. Similar fees include: Condo Association Fees, Co-op Maintenance Fees, etc. | 3% | -$92 | -$1,104 |
Operating ExpensesRecurring costs required to maintain and manage a rental property, including property taxes, insurance, maintenance, repairs, utilities (if paid by the owner), property management fees, and other day-to-day expenses. Calculation:Insurance + Property Taxes + Property Management + Repairs & Maintenance + Capital Expenditures + HOA Fees | 46% | -$1,458 | -$17,494 |
Cash Flow
| Monthly | Yearly | |
|---|---|---|
Net Operating Income (NOI)The income generated from a property after deducting all operating expenses but before deducting mortgage payments, taxes, and capital expenditures. Calculation:Gross Operating Income - Operating Expenses
Net operating income:
| $1,550 | $18,600 |
Mortgage PaymentThe fixed amount a borrower pays each month to repay a loan. It typically includes principal and interest (P&I) and may also cover property taxes, insurance, HOA fees, and PMI if escrowed. | -$3,263 | -$39,156 |
Cash FlowNet Operating Income (NOI) minus mortgage payments. Calculation:NOI - Mortgage Payments | $1,713 | $20,556 |