$1,075,000
Investment Summary
- Monthly Cash Flow
- -$3,510
- Cap Rate
- 2.2%
- Cash-on-Cash Return
- -17.0%
- Debt Coverage Ratio
- 0.36
- Internal Rate of Return (5 years)
- -12.5%
Cash Flow
Net Operating Income (NOI) minus mortgage payments.
Calculation:
NOI - Mortgage Payments
Cap Rate (Market Value)
Capitalization Rate is a rate of return that compares the yearly Net Operating Income (NOI) to the market value.
Calculation:
NOI / Market Value
Cash-on-Cash Return (CoC)
Annual Cash Flow / Cash Invested
Calculation:
Annual cash flow divided by initial cash invested.
Debt Coverage Ratio (DCR)
Net Operating Income (NOI) divided by total debt payments.
Calculation:
NOI / Total Debt Payments
Internal Rate of Return (IRR)
A metric for assessing profitability over time. IRR is the discount rate at which the net present value (NPV) of all future cash flows (positive and negative) from an investment equals zero — including both periodic cash flow (such as rent) and a projected sale at the end of the holding period. It represents the expected annualized return, accounting for income, expenses, and the recovery of capital through a future sale.
Property Description
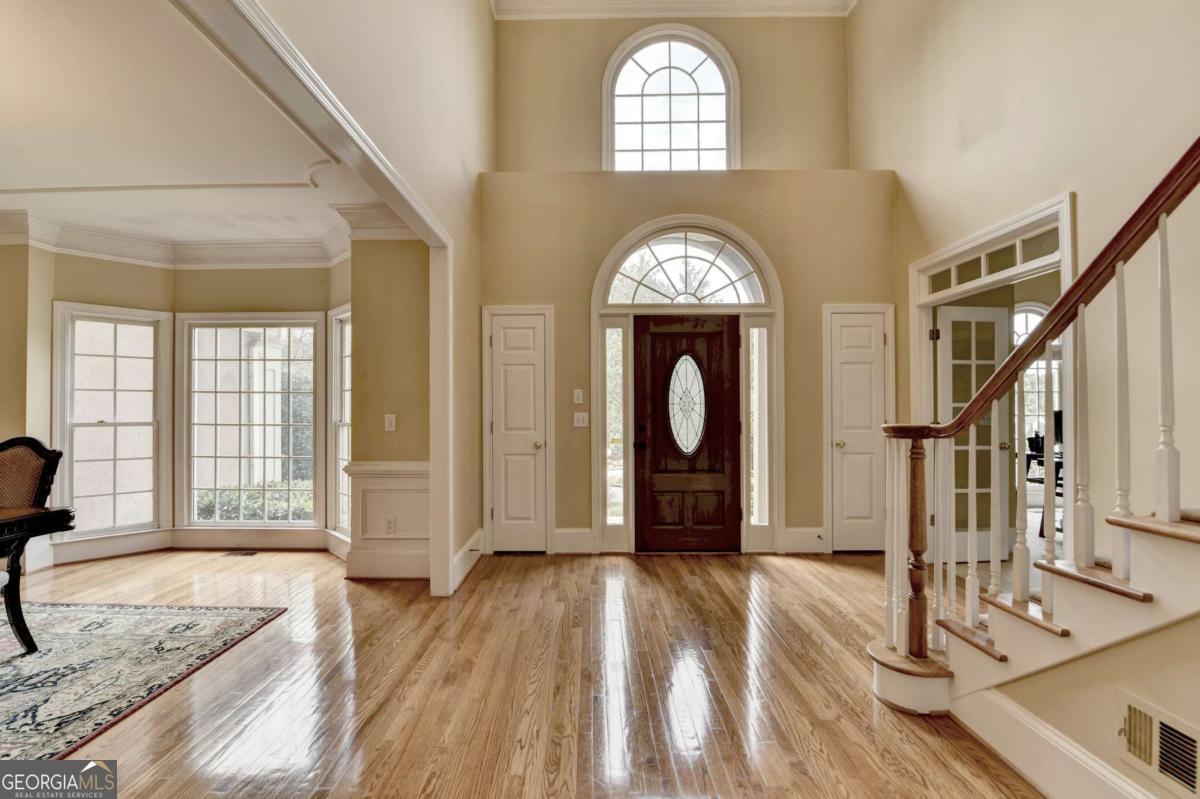
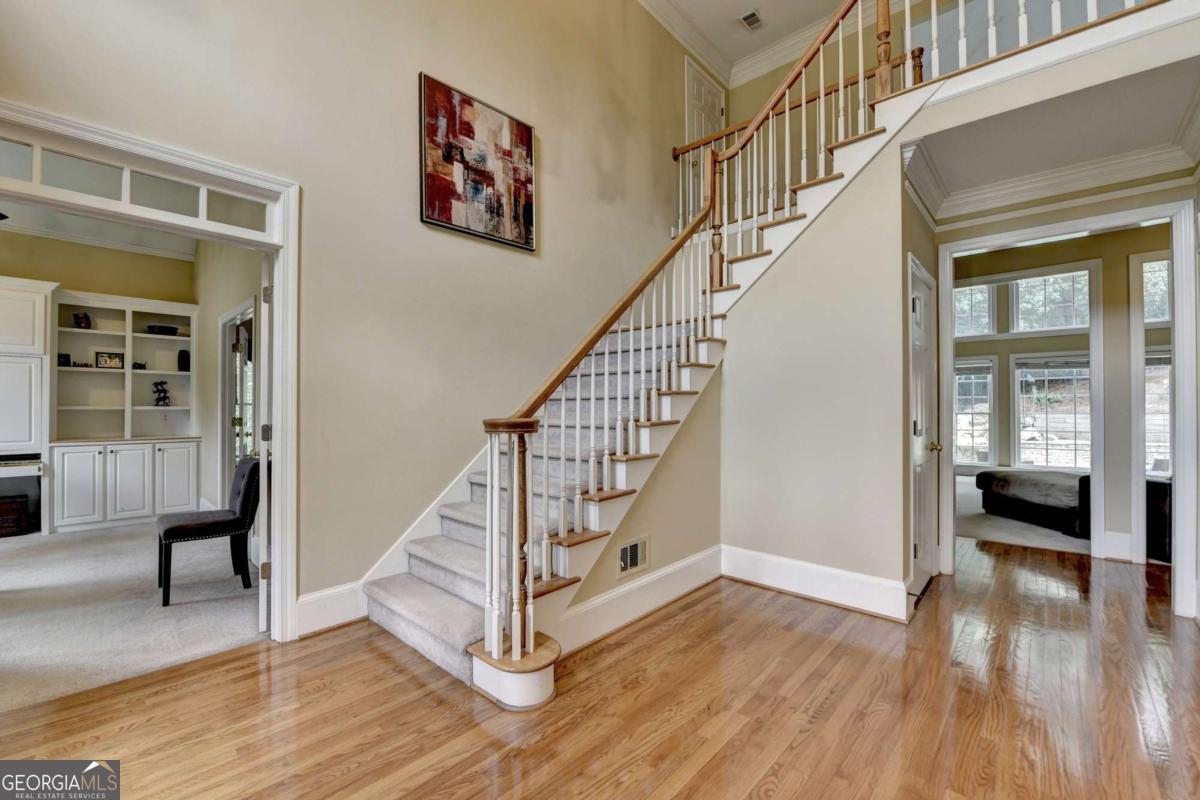
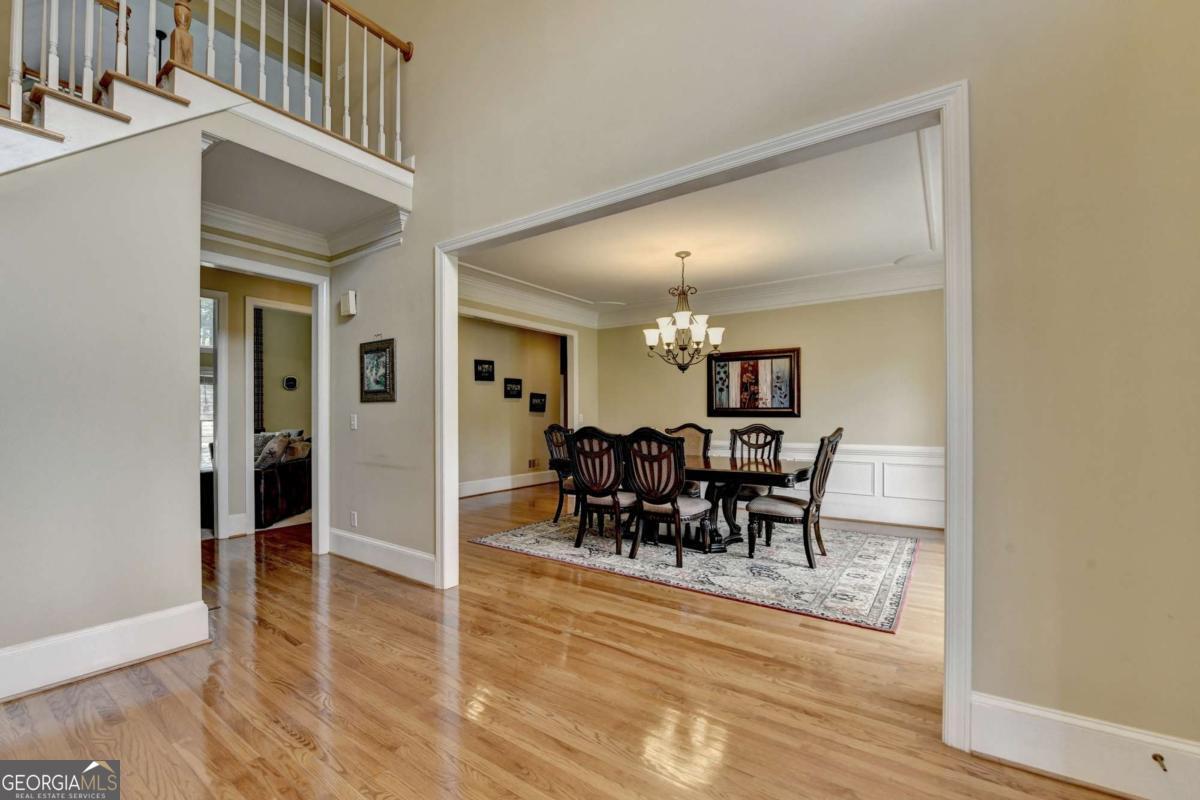
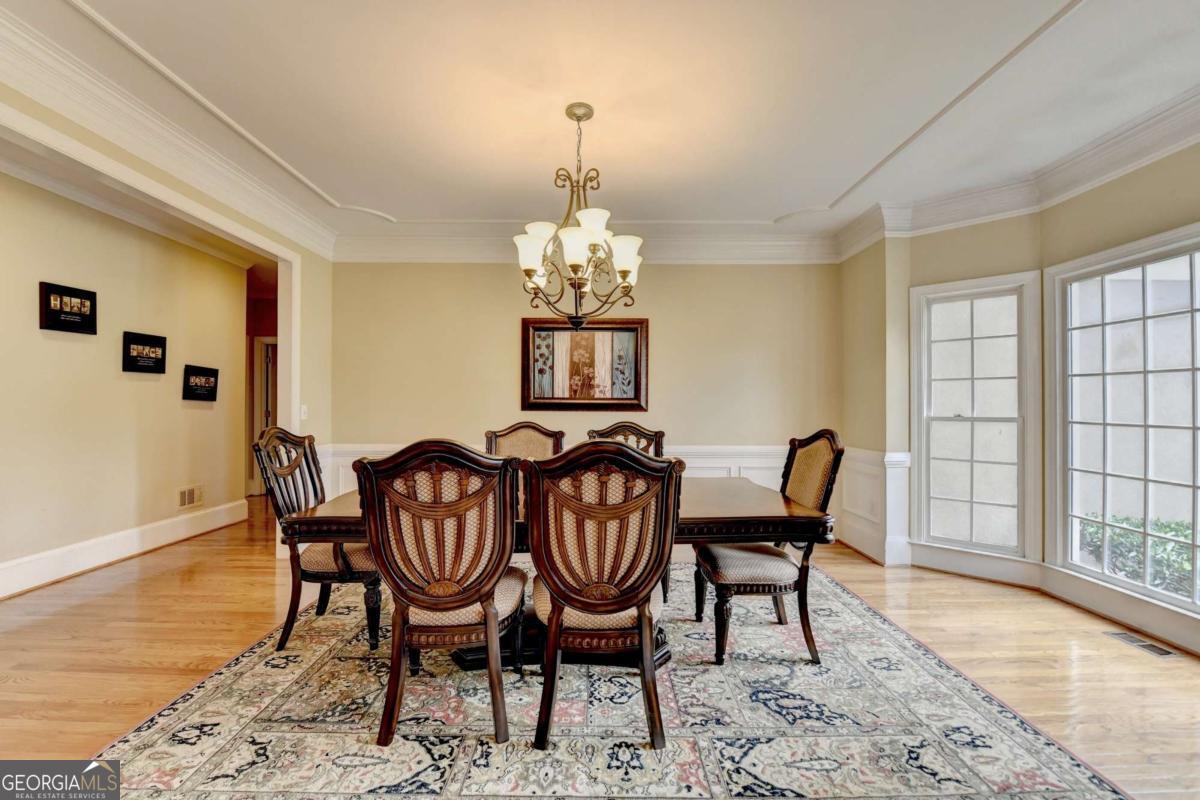
Gorgeous 5 bed/4.5 bath MASTER-ON-MAIN home with HEATED SALTWATER POOL and finished TERRACE LEVEL on a private, CUL-DE-SAC. Step through the arched stone entryway into the 2 story hardwood foyer with double tray ceiling. To your right is the family-sized DINING ROOM with crown and picture frame molding, bayed window and hardwood floor. French doors open to the elegant OFFICE with custom cabinetry, vaulted ceiling and convenient door to the master-on-main bedroom! The grand FAMILY ROOM features a 2 story vaulted ceiling, marble fireplace, custom built-ins and wall of windows overlooking the stunning POOL and private backyard. The gourmet kitchen is perfect for the family chef and features custom cabinetry, a large eat-in island, quartz countertops, stainless steel appliances, a gas cooktop, DOUBLE WALL OVEN, tile backsplash, hardwood floor, WALK-IN PANTRY and work station. This large open plan space also features a bayed BREAKFAST ROOM with door to the expansive patio and luxurious POOL! The romantic MAIN FLOOR MASTER suite features a double tray ceiling and a spa bath with tile floor and shower, double vanity, custom cabinetry, WHIRLPOOL TUB and HIS-AND-HERS closets with built-in cabinetry. A convenient mud/laundry room with SINK and a pretty powder room complete the main level. Upstairs are FOUR large bedrooms, each with crown molding. These large bedrooms share 2 tiled Jack-and-Jill tiled bathrooms; 1 with a double vanity and custom cabinetry. The finished terrace level features wood floors, a family room, a large GAME room, bar with tray ceiling, stain-grade cabinetry, wine fridge, bar fridge and beer KEGORATOR. A MEDIA ROOM, EXERCISE area and huge built-in SAUNA, full bathroom with TILE FLOOR and shower complete this expansive space! This exquisite home's outdoor spaces are sublime! Beautifully designed to create numerous entertaining and relaxing areas! HEATED SALTWATER POOL with a large hot tub and stone pavers, stack stone FIREPLACE, cozy FIREPIT and spacious patio areas. The backyard is completely PRIVATE and beautifully landscaped! This is an incredible opportunity to own a home in the prestigious GOLF/SWIM/TENNIS/GATED Laurel Springs community! Along with being in the SOUGHT-AFTER LAMBERT HIGH SCHOOL district, it features 24-HOUR SECURITY, a private JACK NICKLAUS GOLF COURSE, clubhouse with fitness center, TENNIS courts and tennis team, pickleball courts, swimming POOL with kid's pool and waterslide, swim team, playground area and so much more! The perfect place to call home! ***This home is being sold AS-IS and no epairs will be made by Seller***
Build Your Team
Quickly find investor-friendly professionals who can help you succeed in real estate investing at any stage of the investing journey.


Agents
Match with investor-friendly agents who can help you find, analyze, and close your next deal


Lenders
Get the best funding…find investor-friendly lenders who specialize in your deal strategy


Property Managers
Transition to passive investing. Find a trusted property management partnership that lasts.


Tax Pros & Accountants
Taxes and financial reporting made easy—find experts to create tax savings strategies, file taxes, and more
Location
Property Details
Parking
- Description: Attached, Garage, Garage Door Opener, Garage Faces Side
- Details: Attached, Garage, Garage Door Opener, Kitchen Level
- Garage Spaces: 3
- Spaces Total: 3
Bedroom Information
- # of Bedrooms: 5
Bathroom Information
- # of Baths (Full): 4
- # of Baths (Partial): 1
- # of Baths (Total): 4.5
Interior Features
- # of Stories: 2
- Basement: Yes
- Basement Description: Daylight, Exterior Entry, Finished, Full, Interior Entry
- Fireplace: Yes
Exterior Features
- Exterior Walls Materials: Stucco
- Roof Material: Composition
HOA
- Has HOA: Yes
- HOA Fee: $3,200/annually
Land Information
- Land Use: Residential
- Land Use Subtype: Single Family Residential
Lot Information
- Parcel ID: 137076
- Lot Size: 0 sqft
Property Information
- Property Type: Single Family Residence
- Style: European, Traditional
- Year Built: 1997
Tax Information
- Annual Tax: $10,086
Utilities
- Water & Sewer: Public
- Heating: Central, Forced Air, Natural Gas, Zoned
- Cooling: Ceiling Fan(s), Central Air, Electric, Zoned
Location
- County: Forsyth
Listing Details
Investment Summary
- Monthly Cash Flow
- -$3,510
- Cap Rate
- 2.2%
- Cash-on-Cash Return
- -17.0%
- Debt Coverage Ratio
- 0.36
- Internal Rate of Return (5 years)
- -12.5%
Cash Flow
Net Operating Income (NOI) minus mortgage payments.
Calculation:
NOI - Mortgage Payments
Cap Rate (Market Value)
Capitalization Rate is a rate of return that compares the yearly Net Operating Income (NOI) to the market value.
Calculation:
NOI / Market Value
Cash-on-Cash Return (CoC)
Annual Cash Flow / Cash Invested
Calculation:
Annual cash flow divided by initial cash invested.
Debt Coverage Ratio (DCR)
Net Operating Income (NOI) divided by total debt payments.
Calculation:
NOI / Total Debt Payments
Internal Rate of Return (IRR)
A metric for assessing profitability over time. IRR is the discount rate at which the net present value (NPV) of all future cash flows (positive and negative) from an investment equals zero — including both periodic cash flow (such as rent) and a projected sale at the end of the holding period. It represents the expected annualized return, accounting for income, expenses, and the recovery of capital through a future sale.
Purchase Details
Purchase PriceThe price paid for the property. Purchase price:
| $1,075,000 |
|---|---|
Amount FinancedThe amount of the purchase financed through a loan. Amount financed:
| -$860,000 |
Down paymentThe initial payment made towards the purchase. Down payment:
| $215,000 |
Closing CostsFees and expenses associated with purchasing a property, typically ranging from 2% to 5% of the home’s purchase price, paid at the end of a home purchase to cover services like lending, title transfer, and taxes. Closing costs:
| $32,250 |
Rehab CostsCosts incurred to repair or improve the property, including: roof, flooring, exterior siding, kitchen, exterior paint, bathrooms, etc. Rehab costs:
| $0 |
Initial Cash InvestedThe total initial cash invested in the property. Calculation:Down payment + Buying costs + Rehab costs Initial cash invested:
| $247,250 |
Square Feet (SQFT)The total square footage of the property. Square feet:
| 5,432 |
Cost Per Square FootCost per square foot of the property. Calculation:Purchase Price / Square Feet Cost per square foot:
| $198 |
Monthly Rent Per Square FootMonthly rent divided by the number of square feet. This ratio helps investors compare rental income efficiency across properties, markets, and unit sizes Calculation:Monthly Rent / Square Feet Monthly rent per square foot:
| $0.83 |
Financing Details
Loan AmountThe total sum of money borrowed from a lender to finance a property purchase. Calculation:Purchase Price - Down Payment
Loan amount:
| $860,000 |
|---|---|
Loan to Value Ratio (LTV)Loan amount divided by the market value of the property. Calculation:Loan Amount / Market Value
Loan to value ratio:
| 80.0% |
Loan TypeThe type of loan (e.g., fixed, adjustable).
Loan type:
| Amortizing |
TermThe loan repayment period in years.
Term:
| 30 years |
Interest RateThe percentage a lender charges on the borrowed amount of a loan, determining the cost of borrowing money.
Interest rate:
| 6.625% |
Principal & Interest (PI)The principal is the portion of the loan payment that reduces the loan balance. The interest is the lender's charge for borrowing money. Calculation:(P * r * (1 + r) ** n) / ((1 + r) ** n - 1) Where:
P = Loan amount (principal)
Principal & interest:
| $5,507 |
Property TaxesAnnual taxes levied by local governments on real estate properties. These taxes fund public services like schools, roads, and emergency services.
Property tax:
| $841 |
InsuranceThe costs for insurance coverage to protect against financial losses due to risks like fire, natural disasters, theft, liability, or tenant-related damages. Calculation:Assumes 7% of gross rental income, unless insurance rates are specified.
Insurance:
| $315 |
Private Mortgage Insurance (PMI)A fee that borrowers pay when they take out a conventional loan with a loan-to-value (LTV) ratio above 80%.
Private mortgage insurance (PMI):
| $0 |
Monthly PaymentThe fixed amount a borrower pays each month to repay a loan. It typically includes principal and interest (P&I) and may also cover property taxes, insurance, HOA fees, and PMI if escrowed. Monthly payment:
| $6,663 |
Operating Income
| % Rent | Monthly | Yearly | |
|---|---|---|---|
Gross RentThe total rental income received from tenants before deducting any expenses. Includes base rent, late fees, pet fees, parking fees, and other recurring charges.
Gross rent:
| $4,500 | $54,000 | |
Vacancy LossExpected loss of rent due to vacancies.
Vacancy loss:
(6%)
| 6% | -$270 | -$3,240 |
Operating IncomeGross rental income minus vacancy loss. Calculation:Gross rent - Vacancy loss
Operating income:
| $4,230 | $50,760 |
Operating Expenses
| % Rent | Monthly | Yearly | |
|---|---|---|---|
Property TaxesAnnual taxes levied by local governments on real estate properties. These taxes fund public services like schools, roads, and emergency services. | 19% | -$841 | -$10,086 |
InsuranceThe costs for insurance coverage to protect against financial losses due to risks like fire, natural disasters, theft, liability, or tenant-related damages. Calculation:Assumes 7% of gross rental income, unless insurance rates are specified. | 7% | -$315 | -$3,780 |
Property ManagementThe costs associated with hiring a property manager to handle the day-to-day operations of a rental property. Includes management fees, leasing fes, eviction fees, etc. Calculation:Assumes 8% of gross rental income. | 8% | -$360 | -$4,320 |
Repairs & MaintenanceOngoing costs for routine upkeep and minor fixes needed to keep a property in good working condition. Calculation:Assumes 5% of gross rental income. Varies by property age and condition. | 5% | -$225 | -$2,700 |
Capital ExpensesLarge, infrequent costs for major improvements or replacements, like a new roof, HVAC system, or appliances. Calculation:Assumes 5% of gross rental income. Varies by property age. | 5% | -$225 | -$2,700 |
HOA FeesRegular dues paid to a Homeowners Association for community maintenance, amenities, and management. Similar fees include: Condo Association Fees, Co-op Maintenance Fees, etc. | 6% | -$267 | -$3,204 |
Operating ExpensesRecurring costs required to maintain and manage a rental property, including property taxes, insurance, maintenance, repairs, utilities (if paid by the owner), property management fees, and other day-to-day expenses. Calculation:Insurance + Property Taxes + Property Management + Repairs & Maintenance + Capital Expenditures + HOA Fees | 50% | -$2,233 | -$26,790 |
Cash Flow
| Monthly | Yearly | |
|---|---|---|
Net Operating Income (NOI)The income generated from a property after deducting all operating expenses but before deducting mortgage payments, taxes, and capital expenditures. Calculation:Gross Operating Income - Operating Expenses
Net operating income:
| $1,997 | $23,964 |
Mortgage PaymentThe fixed amount a borrower pays each month to repay a loan. It typically includes principal and interest (P&I) and may also cover property taxes, insurance, HOA fees, and PMI if escrowed. | -$5,507 | -$66,084 |
Cash FlowNet Operating Income (NOI) minus mortgage payments. Calculation:NOI - Mortgage Payments | -$3,510 | -$42,120 |