$495,999
Investment Summary
- Monthly Cash Flow
- -$955
- Cap Rate
- 3.8%
- Cash-on-Cash Return
- -10.0%
- Debt Coverage Ratio
- 0.62
- Internal Rate of Return (5 years)
- -5.7%
Cash Flow
Net Operating Income (NOI) minus mortgage payments.
Calculation:
NOI - Mortgage Payments
Cap Rate (Market Value)
Capitalization Rate is a rate of return that compares the yearly Net Operating Income (NOI) to the market value.
Calculation:
NOI / Market Value
Cash-on-Cash Return (CoC)
Annual Cash Flow / Cash Invested
Calculation:
Annual cash flow divided by initial cash invested.
Debt Coverage Ratio (DCR)
Net Operating Income (NOI) divided by total debt payments.
Calculation:
NOI / Total Debt Payments
Internal Rate of Return (IRR)
A metric for assessing profitability over time. IRR is the discount rate at which the net present value (NPV) of all future cash flows (positive and negative) from an investment equals zero — including both periodic cash flow (such as rent) and a projected sale at the end of the holding period. It represents the expected annualized return, accounting for income, expenses, and the recovery of capital through a future sale.
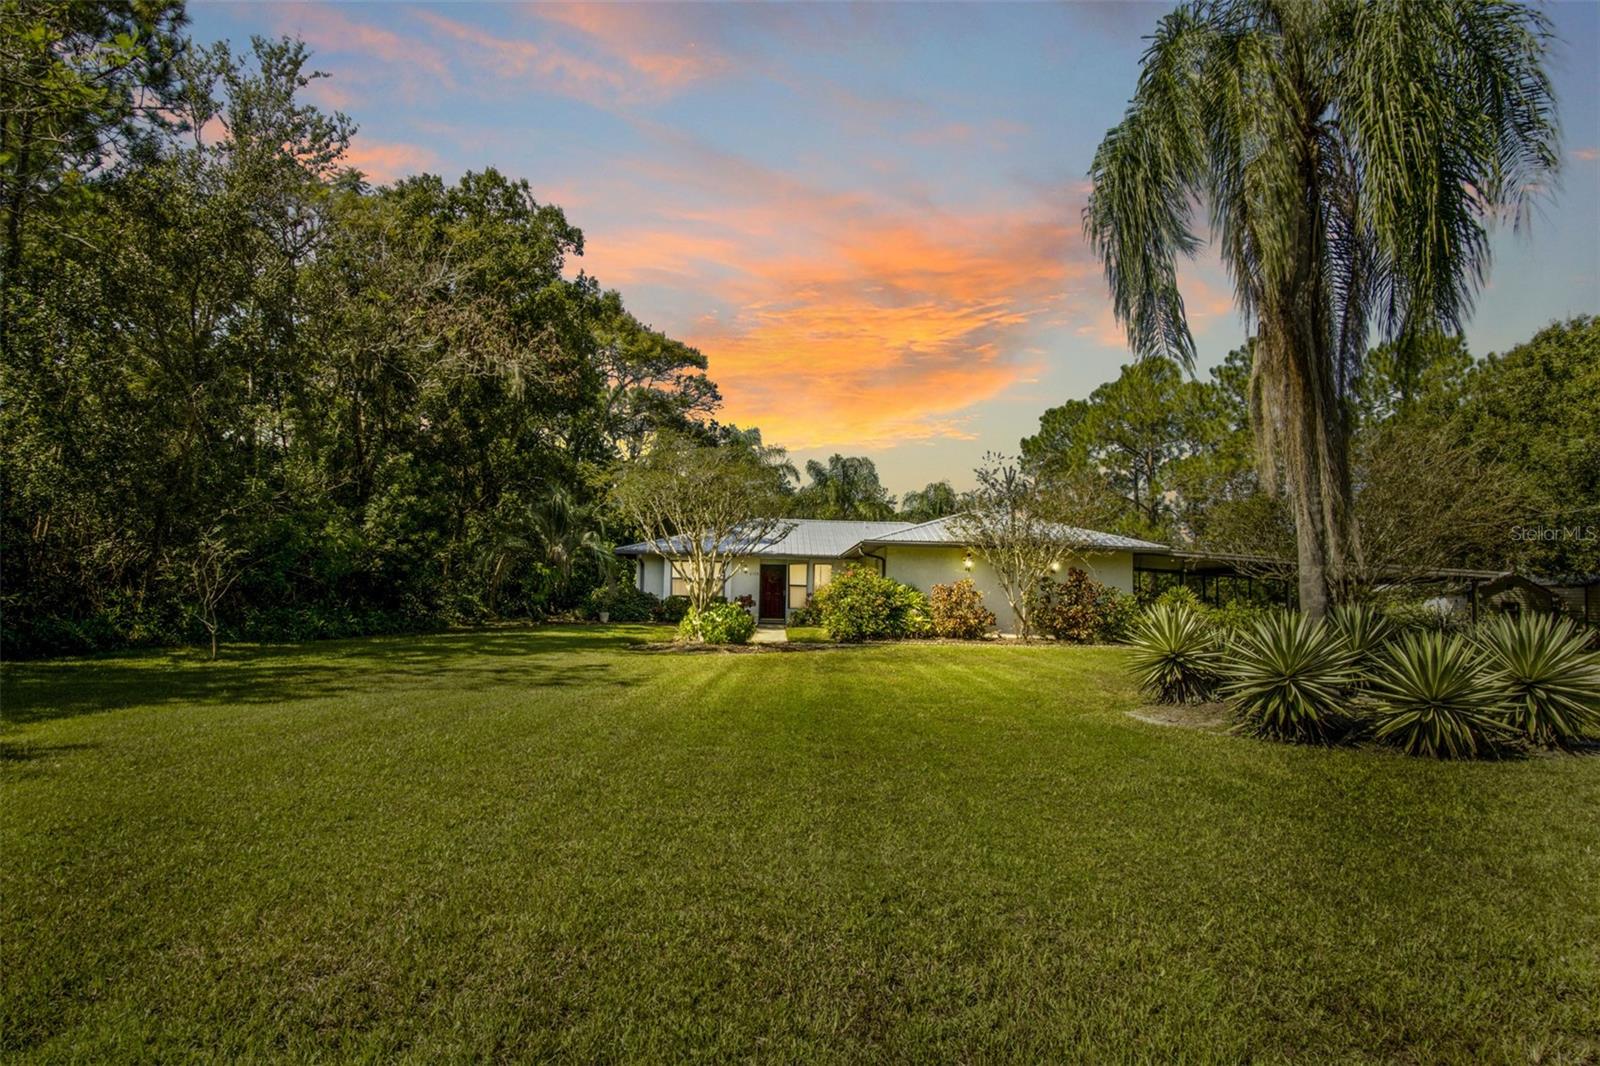
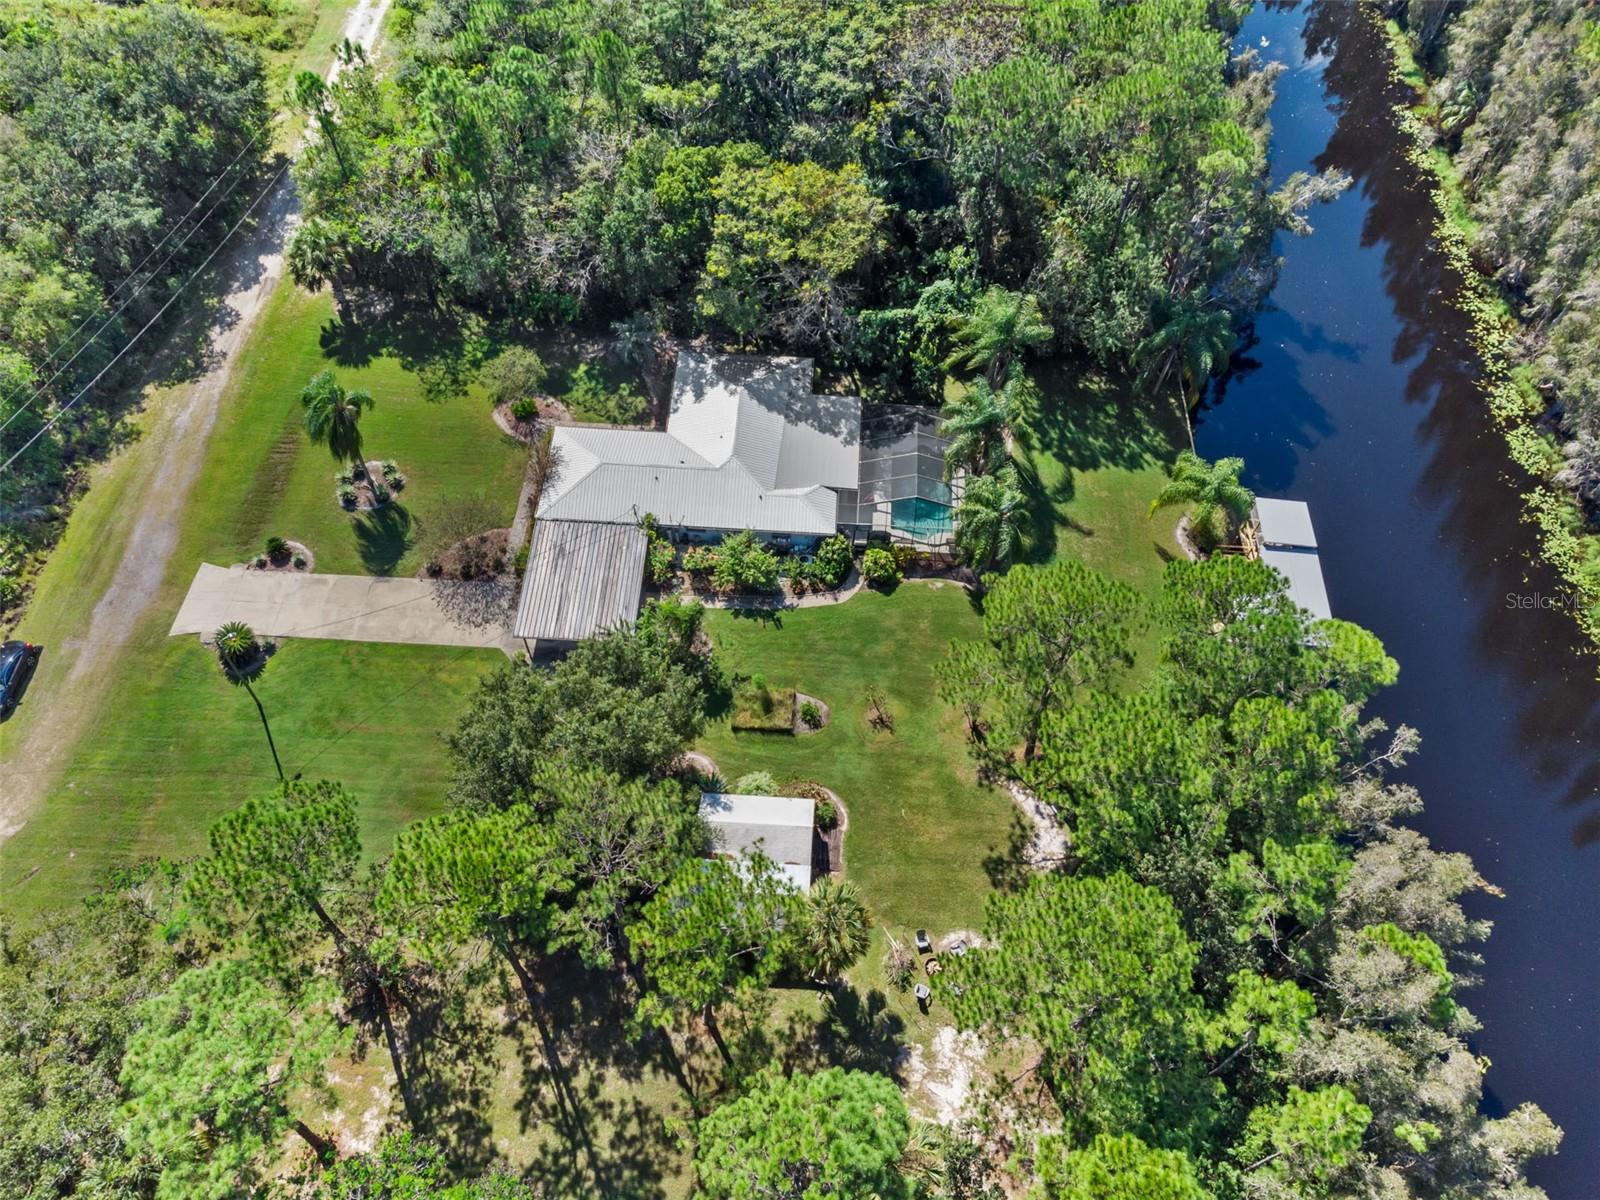
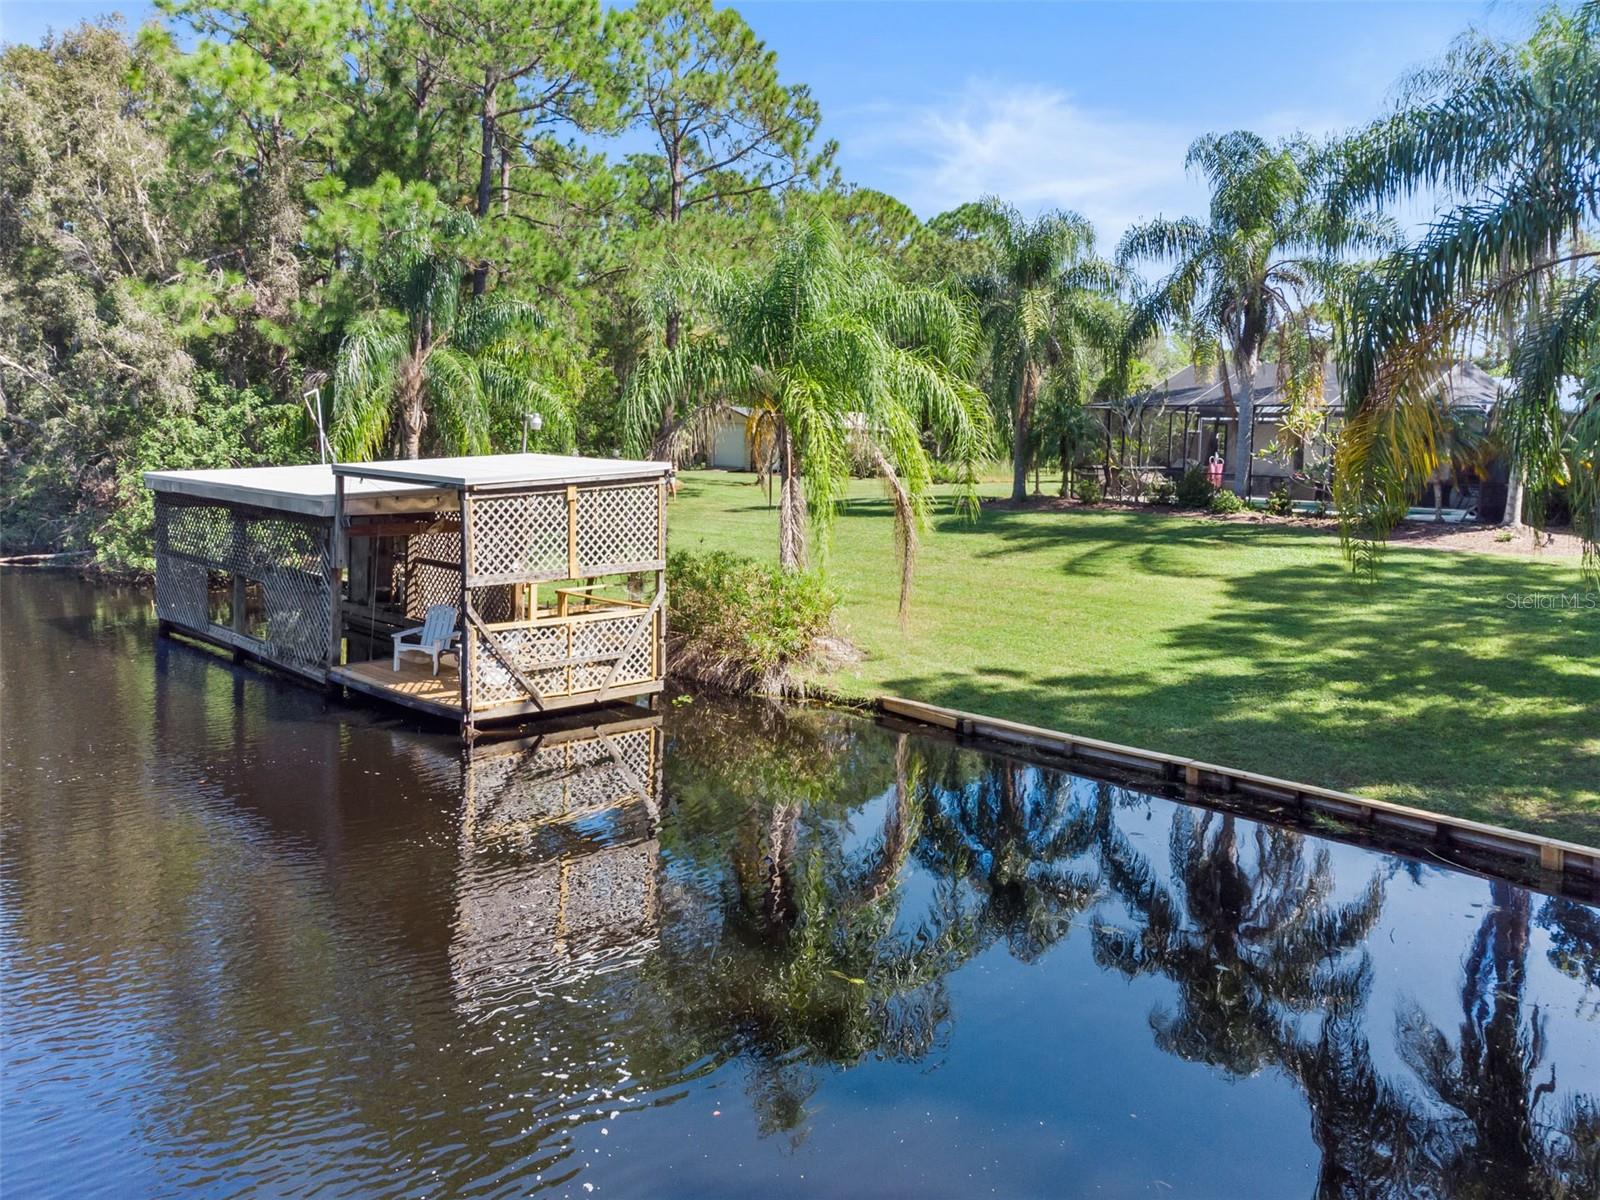
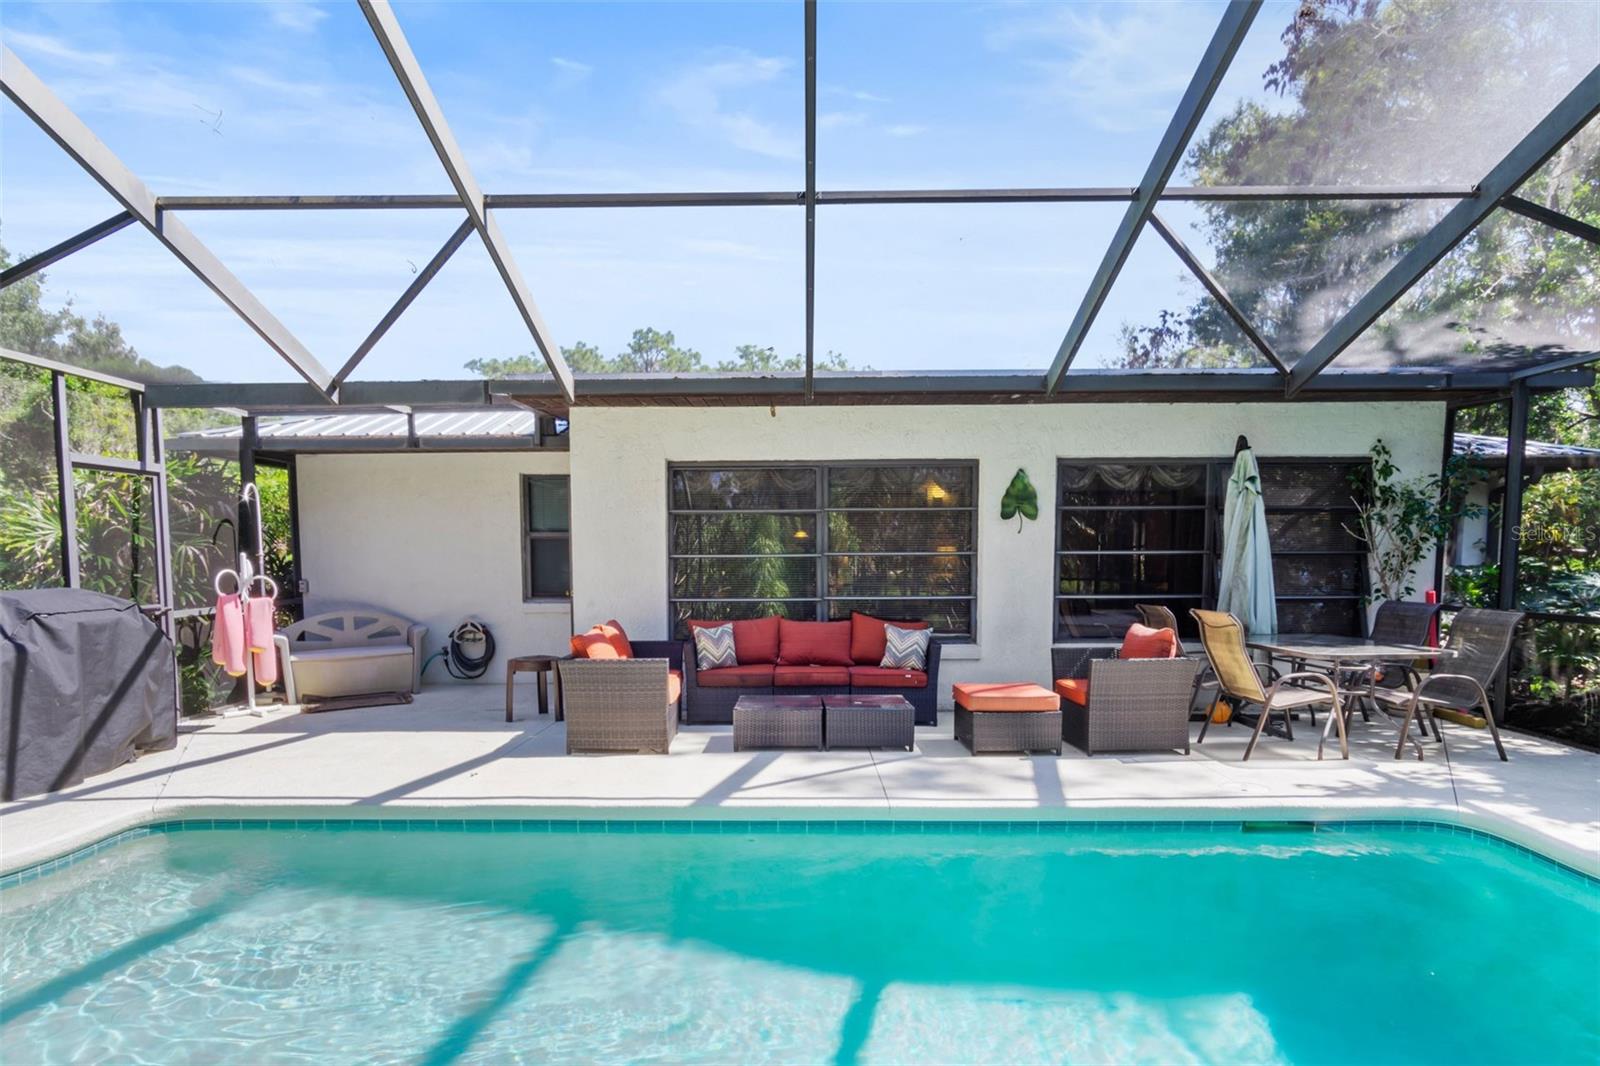
Property Description
HUGE PRICE IMPROVEMENT ON THIS CANAL FRONT HOME ON ONE ACRE (2 LOTS) WITH POOL. Discover the perfect blend of privacy, charm and potential with this enchanting home situated on ( TOTAL OF 1 ACRE) a .50 acre CANAL LOT in Indian Lake Estates, complemented by an additional .50 acre lot included in the sale—perfect for developing another home or expanding your private retreat all on a NEWLY PAVED ROAD. Ideal for an Airbnb/VRBO investment or your own getaway, this 1,926 sq ft residence boasts three bedrooms, two full baths, and a half bath, along with both formal and informal dining areas, a bonus room, and a POOL with a screened lanai. This home is currently utilized as a VRBO at $225 per night and comes fully furnished, offering a turnkey solution for immediate occupancy or continued use as a profitable vacation rental The great room, featuring double pocket sliders, extends seamlessly to an enclosed patio, providing stunning views and an ideal flow for hosting guests. The master suite boasts a walk-in closet and a newly remodeled ensuite with a separate tub and walk-in shower. Across the home, two additional bedrooms offer privacy and convenience, one with direct patio access. The heart of the home, the kitchen, is equipped with extensive counter space, cabinetry, and dual pantries, adjacent to a breakfast nook for cozy meals. The nearby bonus room, currently a vibrant game room with a full bar, promises to be a favorite gathering spot with the close 1/2 bath. State-of-the-art amenities include fiber optic internet, a generator, four-station irrigation system and an array of recent upgrades such as a new metal roof, HVAC system, water softener, and pool equipment such as heater, pump cartridge filter and chlorinator. The property also features a boat house with a new roof, new decking on the dock. Just a five-minute boat ride to Lake Walk In Water, Polk County’s largest lake renowned for bass fishing, and surrounded by a community rich in recreational facilities including and 18 and 9-hole golf courses, a fishing pier, and a clubhouse, cafe, post office, church, library, fitness room, this home offers both tranquility and convenience. Whether as a lucrative Airbnb venture or a serene getaway, this property is a gateway to the best of Florida living, conveniently located an hour and half from Orlando’s attractions and Tampa’s Gulf Coast beaches. Experience the ultimate in country living with easy access to urban amenities. Don’t miss out on this exceptional investment opportunity at Indian Lake Estates, where the potential for expansion or a second home awaits. Visit: https://www.indianlakeestatesinc.com/ for all of what Indian Lake Estates has to offer and CHECK OUT THE HOME VIRTUAL TOUR: https://my.matterport.com/show/?m=Fvf2DrVHhao&brand=0
Build Your Team
Quickly find investor-friendly professionals who can help you succeed in real estate investing at any stage of the investing journey.


Agents
Match with investor-friendly agents who can help you find, analyze, and close your next deal


Lenders
Get the best funding…find investor-friendly lenders who specialize in your deal strategy


Property Managers
Transition to passive investing. Find a trusted property management partnership that lasts.


Tax Pros & Accountants
Taxes and financial reporting made easy—find experts to create tax savings strategies, file taxes, and more
Location
Property Details
Parking
- Description: Carport
- Garage Spaces: 0
- Spaces Total: 0
Bedroom Information
- # of Bedrooms: 3
Bathroom Information
- # of Baths (Full): 2
- # of Baths (Partial): 1
- # of Baths (Total): 3.0
Interior Features
- # of Rooms: 10
- # of Stories: 1
Exterior Features
- Exterior Walls Materials: Stucco
- Foundation: Slab
- Roof Type: Hip
- Roof Material: Metal
- Pool: Yes
HOA
- Has HOA: Yes
- Association: Althea Torkildson
- HOA Fee: $751/annually
Land Information
- Land Use: Residential
- Land Use Subtype: Single Family Residential
Lot Information
- Parcel ID: 293101994070026326
- Lot Size: 43560 sqft
Property Information
- Property Type: Single Family Residence
- Style: Ranch
- Year Built: 1986
Tax Information
- Annual Tax: $4,224
Utilities
- Water & Sewer: Private, Well
- Heating: Central
- Cooling: Central Air
Location
- County: Polk
Listing Details
Investment Summary
- Monthly Cash Flow
- -$955
- Cap Rate
- 3.8%
- Cash-on-Cash Return
- -10.0%
- Debt Coverage Ratio
- 0.62
- Internal Rate of Return (5 years)
- -5.7%
Cash Flow
Net Operating Income (NOI) minus mortgage payments.
Calculation:
NOI - Mortgage Payments
Cap Rate (Market Value)
Capitalization Rate is a rate of return that compares the yearly Net Operating Income (NOI) to the market value.
Calculation:
NOI / Market Value
Cash-on-Cash Return (CoC)
Annual Cash Flow / Cash Invested
Calculation:
Annual cash flow divided by initial cash invested.
Debt Coverage Ratio (DCR)
Net Operating Income (NOI) divided by total debt payments.
Calculation:
NOI / Total Debt Payments
Internal Rate of Return (IRR)
A metric for assessing profitability over time. IRR is the discount rate at which the net present value (NPV) of all future cash flows (positive and negative) from an investment equals zero — including both periodic cash flow (such as rent) and a projected sale at the end of the holding period. It represents the expected annualized return, accounting for income, expenses, and the recovery of capital through a future sale.
Purchase Details
Purchase PriceThe price paid for the property. Purchase price:
| $495,999 |
|---|---|
Amount FinancedThe amount of the purchase financed through a loan. Amount financed:
| -$396,799 |
Down paymentThe initial payment made towards the purchase. Down payment:
| $99,200 |
Closing CostsFees and expenses associated with purchasing a property, typically ranging from 2% to 5% of the home’s purchase price, paid at the end of a home purchase to cover services like lending, title transfer, and taxes. Closing costs:
| $14,880 |
Rehab CostsCosts incurred to repair or improve the property, including: roof, flooring, exterior siding, kitchen, exterior paint, bathrooms, etc. Rehab costs:
| $0 |
Initial Cash InvestedThe total initial cash invested in the property. Calculation:Down payment + Buying costs + Rehab costs Initial cash invested:
| $114,080 |
Square Feet (SQFT)The total square footage of the property. Square feet:
| 1,936 |
Cost Per Square FootCost per square foot of the property. Calculation:Purchase Price / Square Feet Cost per square foot:
| $256 |
Monthly Rent Per Square FootMonthly rent divided by the number of square feet. This ratio helps investors compare rental income efficiency across properties, markets, and unit sizes Calculation:Monthly Rent / Square Feet Monthly rent per square foot:
| $1.50 |
Financing Details
Loan AmountThe total sum of money borrowed from a lender to finance a property purchase. Calculation:Purchase Price - Down Payment
Loan amount:
| $396,799 |
|---|---|
Loan to Value Ratio (LTV)Loan amount divided by the market value of the property. Calculation:Loan Amount / Market Value
Loan to value ratio:
| 80.0% |
Loan TypeThe type of loan (e.g., fixed, adjustable).
Loan type:
| Amortizing |
TermThe loan repayment period in years.
Term:
| 30 years |
Interest RateThe percentage a lender charges on the borrowed amount of a loan, determining the cost of borrowing money.
Interest rate:
| 6.625% |
Principal & Interest (PI)The principal is the portion of the loan payment that reduces the loan balance. The interest is the lender's charge for borrowing money. Calculation:(P * r * (1 + r) ** n) / ((1 + r) ** n - 1) Where:
P = Loan amount (principal)
Principal & interest:
| $2,541 |
Property TaxesAnnual taxes levied by local governments on real estate properties. These taxes fund public services like schools, roads, and emergency services.
Property tax:
| $352 |
InsuranceThe costs for insurance coverage to protect against financial losses due to risks like fire, natural disasters, theft, liability, or tenant-related damages. Calculation:Assumes 7% of gross rental income, unless insurance rates are specified.
Insurance:
| $203 |
Private Mortgage Insurance (PMI)A fee that borrowers pay when they take out a conventional loan with a loan-to-value (LTV) ratio above 80%.
Private mortgage insurance (PMI):
| $0 |
Monthly PaymentThe fixed amount a borrower pays each month to repay a loan. It typically includes principal and interest (P&I) and may also cover property taxes, insurance, HOA fees, and PMI if escrowed. Monthly payment:
| $3,096 |
Operating Income
| % Rent | Monthly | Yearly | |
|---|---|---|---|
Gross RentThe total rental income received from tenants before deducting any expenses. Includes base rent, late fees, pet fees, parking fees, and other recurring charges.
Gross rent:
| $2,900 | $34,800 | |
Vacancy LossExpected loss of rent due to vacancies.
Vacancy loss:
(6%)
| 6% | -$174 | -$2,088 |
Operating IncomeGross rental income minus vacancy loss. Calculation:Gross rent - Vacancy loss
Operating income:
| $2,726 | $32,712 |
Operating Expenses
| % Rent | Monthly | Yearly | |
|---|---|---|---|
Property TaxesAnnual taxes levied by local governments on real estate properties. These taxes fund public services like schools, roads, and emergency services. | 12% | -$352 | -$4,224 |
InsuranceThe costs for insurance coverage to protect against financial losses due to risks like fire, natural disasters, theft, liability, or tenant-related damages. Calculation:Assumes 7% of gross rental income, unless insurance rates are specified. | 7% | -$203 | -$2,436 |
Property ManagementThe costs associated with hiring a property manager to handle the day-to-day operations of a rental property. Includes management fees, leasing fes, eviction fees, etc. Calculation:Assumes 8% of gross rental income. | 8% | -$232 | -$2,784 |
Repairs & MaintenanceOngoing costs for routine upkeep and minor fixes needed to keep a property in good working condition. Calculation:Assumes 5% of gross rental income. Varies by property age and condition. | 5% | -$145 | -$1,740 |
Capital ExpensesLarge, infrequent costs for major improvements or replacements, like a new roof, HVAC system, or appliances. Calculation:Assumes 5% of gross rental income. Varies by property age. | 5% | -$145 | -$1,740 |
HOA FeesRegular dues paid to a Homeowners Association for community maintenance, amenities, and management. Similar fees include: Condo Association Fees, Co-op Maintenance Fees, etc. | 2% | -$63 | -$756 |
Operating ExpensesRecurring costs required to maintain and manage a rental property, including property taxes, insurance, maintenance, repairs, utilities (if paid by the owner), property management fees, and other day-to-day expenses. Calculation:Insurance + Property Taxes + Property Management + Repairs & Maintenance + Capital Expenditures + HOA Fees | 39% | -$1,140 | -$13,680 |
Cash Flow
| Monthly | Yearly | |
|---|---|---|
Net Operating Income (NOI)The income generated from a property after deducting all operating expenses but before deducting mortgage payments, taxes, and capital expenditures. Calculation:Gross Operating Income - Operating Expenses
Net operating income:
| $1,586 | $19,032 |
Mortgage PaymentThe fixed amount a borrower pays each month to repay a loan. It typically includes principal and interest (P&I) and may also cover property taxes, insurance, HOA fees, and PMI if escrowed. | -$2,541 | -$30,492 |
Cash FlowNet Operating Income (NOI) minus mortgage payments. Calculation:NOI - Mortgage Payments | $955 | $11,460 |